
Welcome to the daily financial report about the Hive blockchain.
All the information presented in this report is based on the data collected from the blockchain until 2022-01-29 midnight UTC. This report aims to provide you with a clear view of what is happening on the Hive blockchain.
 Este post está traducido al español - aquí
 Dieser Beitrag ist ins Deutsche übersetzt - hier
 Une version en français de ce post est disponible - ici
1. Price
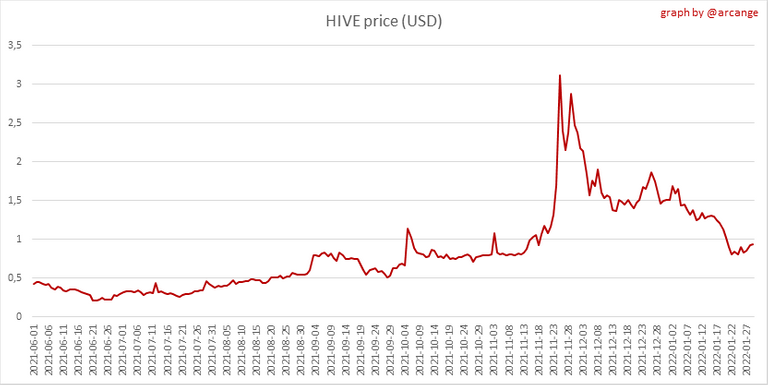 | 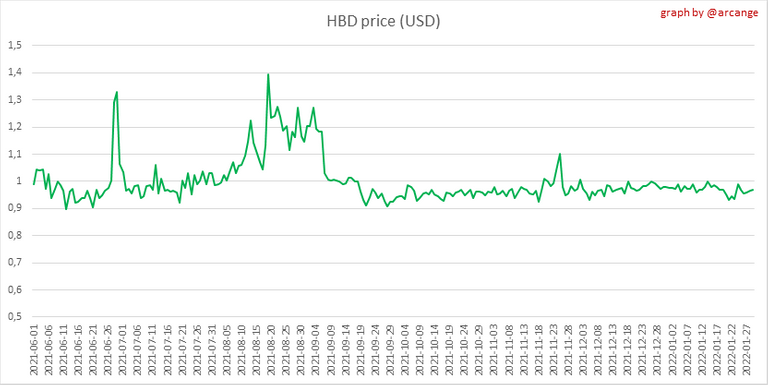 |
These graphs show the evolution of prices in USD for HIVE and HBD.
2. Supply
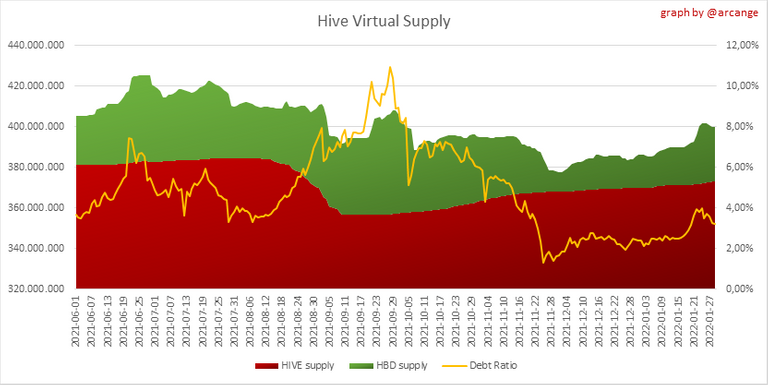
This graph shows the evolution of HIVE virtual Supply. The virtual supply is the sum of HIVE supply (liquid and staked HIVE) and HBD supply (converted into HIVE).
The graph also displays the debt ratio (HBD supply / HIVE virtual supply). Keep in mind that since hardfork 24 funds in the treasury (@hive.fund HBD balance) don't count towards the HBD debt ratio.
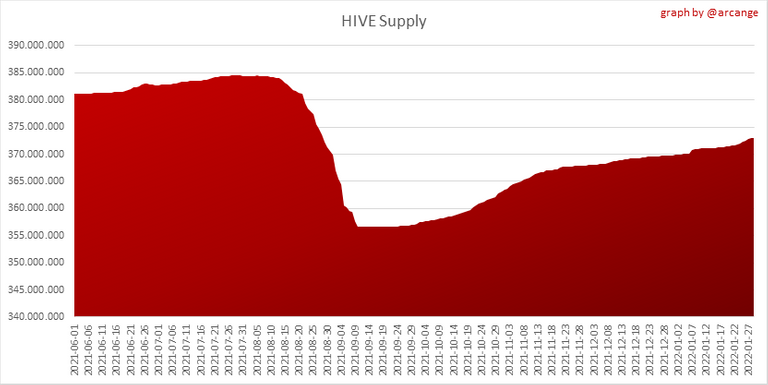 | 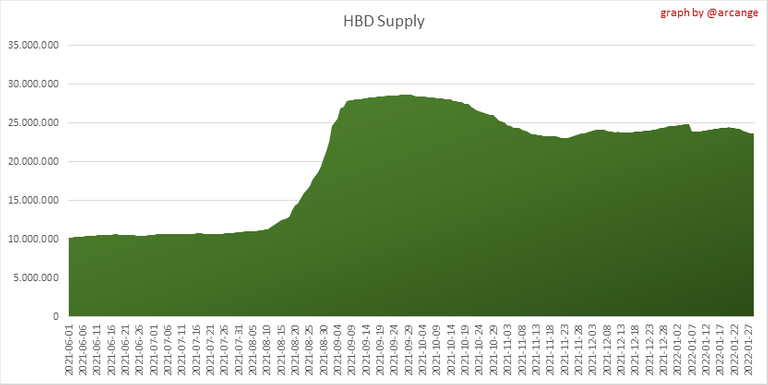 |
These graphs show the evolution of the HIVE Supply (both liquid and staked) and the HBD supply.
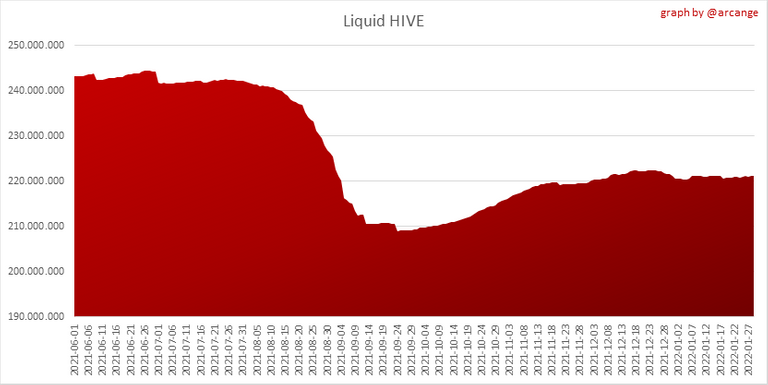 | 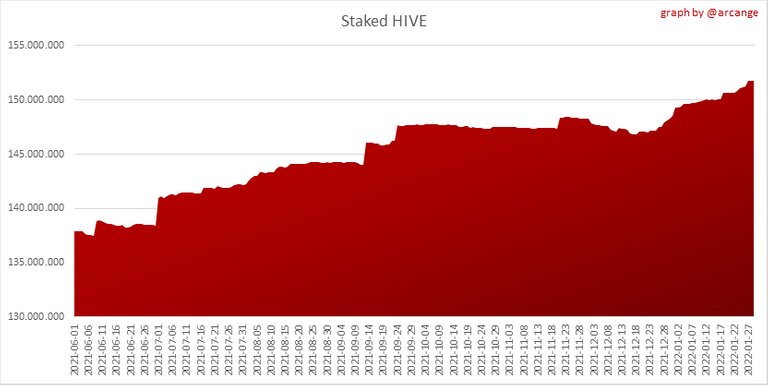 |
These charts show the evolution of the liquid HIVE and the staked HIVE (Hive Power).
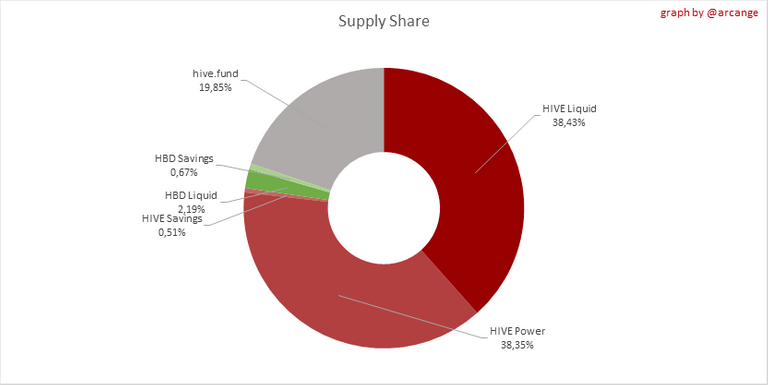
This graph shows the overall Hive tokens distribution.
3. HBD Savings

| Account | Deposit | Account | Withdrawal |
|---|---|---|---|
| @therealyme | 34,967.010 HBD | @slobberchops | 1,500.000 HBD |
| @onthewayout | 13,601.525 HBD | @fa-him | 504.159 HBD |
| @piggybox-002 | 2,992.969 HBD | @velinov86 | 358.535 HBD |
| @hbdsavings | 1,104.496 HBD | @fionasfavourites | 275.674 HBD |
| @demotruk | 665.050 HBD | @new.things | 106.716 HBD |
| @hiveauth | 324.984 HBD | @orcish | 97.455 HBD |
| @moemanmoesly | 284.199 HBD | @saffisara | 73.000 HBD |
| @howo | 274.992 HBD | @melochacalie | 58.302 HBD |
| @seventhdragon | 213.297 HBD | @bengy | 50.000 HBD |
| @kaelci | 210.475 HBD | @brightstar | 50.000 HBD |
This graph shows how much and how many accounts store HBD in savings. The table below shows the topmost HBD deposits and withdrawals of the day.

Note: As of 2021-06-30 (HF25) interest is only paid for HBD which are stored in savings.
This chart shows the amount of interest paid each month for holding HBD and how many accounts received such interest.
4. Balances
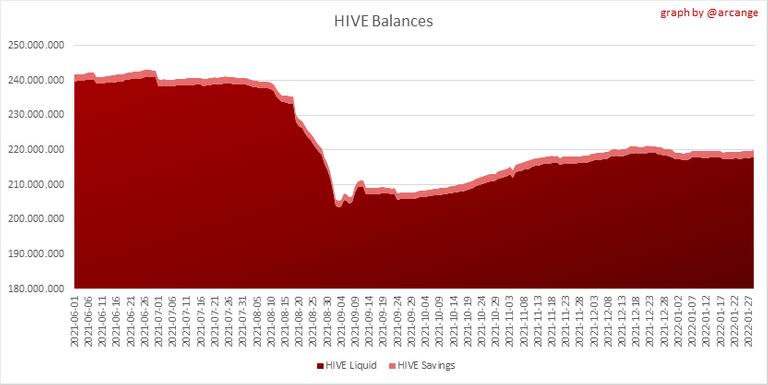
This graph shows the number of HIVE, both liquid and in savings, held by all accounts.
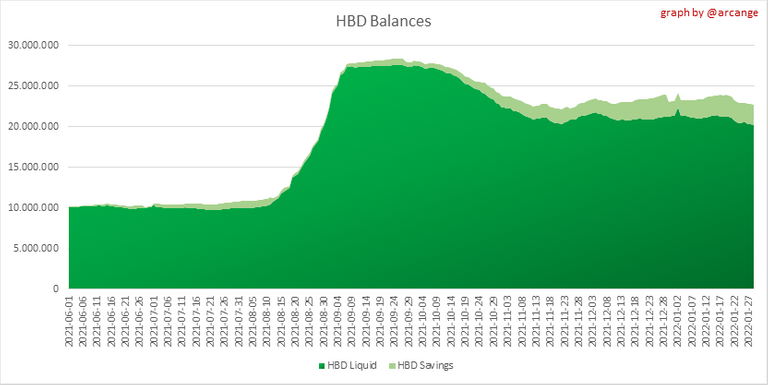
This graph shows the number of HBD, both liquid and in savings, held by all accounts.
5. Conversions
Note: As a reminder, conversion requests are only finalized after 3 days. It is only then that it is known exactly how many HIVE were burned in return for the HBD received at the time of the conversion request.
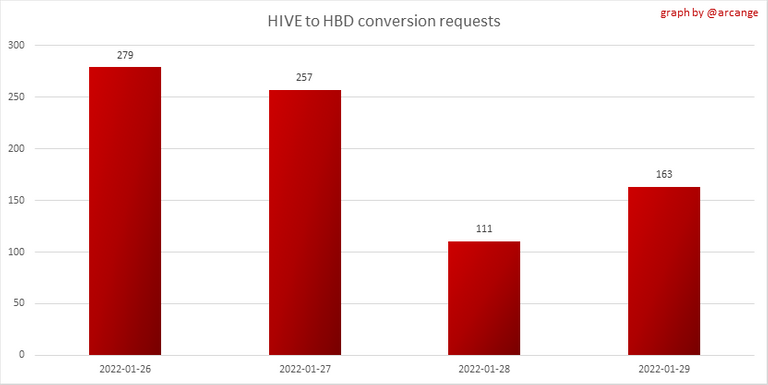
This graph shows the number of HIVE collateralized due to requests to convert HIVE to HBD over the past few days.
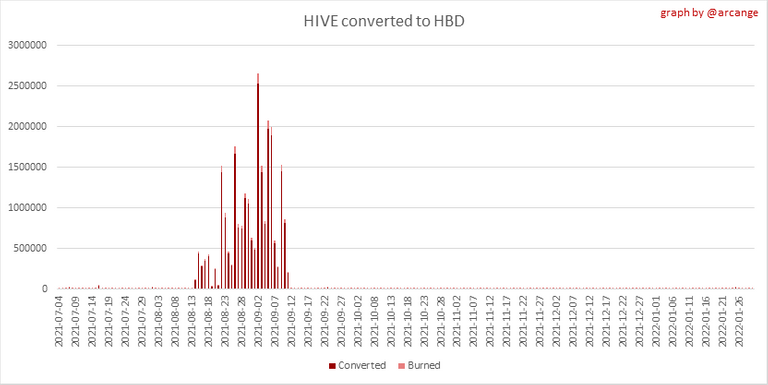 |  |
These graphs show the number of HIVE effectively used by the conversion process (HIVE converted and 5% HIVE fee which is burned) each day and month when requests to convert HIVE to HBD have been finalized.
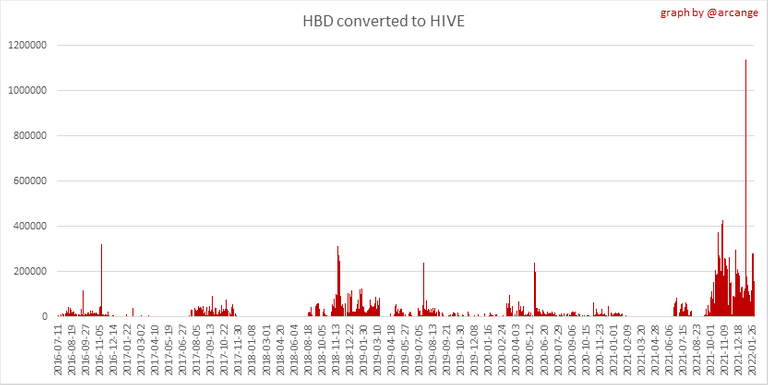 | 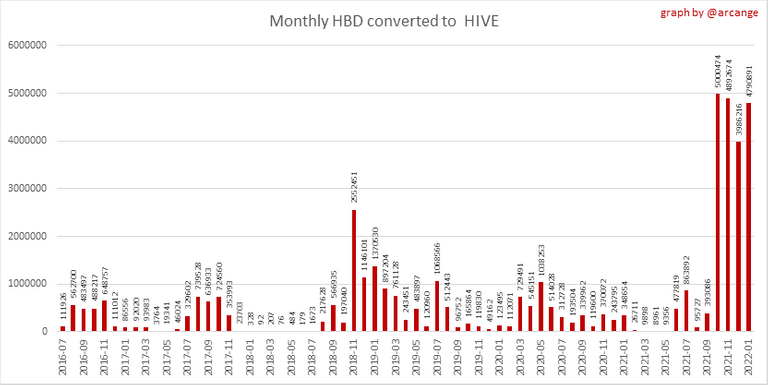 |
These graphs show the number of HBD burned, each day and each month, following requests to convert HBD to HIVE.
6. Powerup and Powerdown
| Date | Account | Amount |
|---|---|---|
| 2022-01-29 09:10:27 | @m31 | 17,410.937 HIVE |
| 2022-01-29 01:33:21 | @skenderbeu | 9,354.029 HIVE |
| 2022-01-29 06:56:18 | @zullyscott | 3,510.305 HIVE |
| 2022-01-29 02:07:42 | @article61 | 2,065.130 HIVE |
| 2022-01-29 03:44:39 | @cami.rojas | 1,548.985 HIVE |
| 2022-01-29 12:38:54 | @aglaide | 1,295.187 HIVE |
| 2022-01-29 08:57:27 | @luckylinkz | 1,058.668 HIVE |
| 2022-01-29 02:23:45 | @yusvelasquez | 845.086 HIVE |
| 2022-01-29 07:07:15 | @dimascastillo90 | 753.035 HIVE |
| 2022-01-29 04:15:09 | @justyy | 692.148 HIVE |
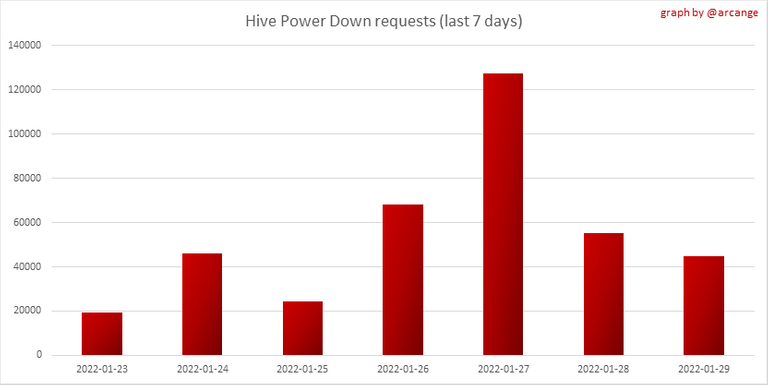
This graph and table show the amount of powerdown initiated over the last 7 days, and the largest initiated on this day.
| Account | Powerup | Account | Powerdown |
|---|---|---|---|
| @therealyme | 10,999.700 HIVE | @ocdb | 14,589.069 HIVE |
| @blrog | 8,564.587 HIVE | @luckyolddaddy | 2,815.545 HIVE |
| @urri2020 | 1,240.940 HIVE | @schlees | 2,542.648 HIVE |
| @catwomanteresa | 1,009.518 HIVE | @kevinwong | 2,160.842 HIVE |
| @road2horizon | 900.000 HIVE | @timcliff | 1,992.265 HIVE |
| @geneeverett | 194.000 HIVE | @glastar | 1,903.233 HIVE |
| @stafhalr | 184.980 HIVE | @sharkthelion | 1,794.187 HIVE |
| @timoremoti | 178.608 HIVE | @gniksivart | 1,522.353 HIVE |
| @zedcell | 177.041 HIVE | @mammasitta | 1,223.486 HIVE |
| @pouchon | 137.523 HIVE | @thecryptodrive | 1,169.102 HIVE |
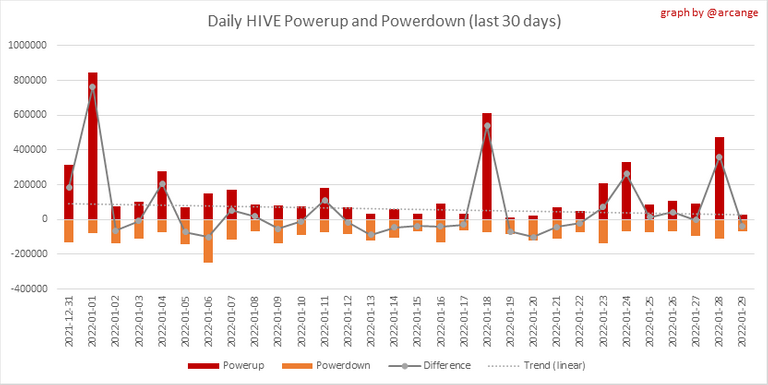
This graph shows the daily HIVE power-up, power-down, and the resulting variation over the last 30 days. The table shows the topmost power-ups and power-downs of the day.

This graph shows the monthly HIVE power-up, power-down and the resulting variation.
Values for the last 3 months
| Period | Powerup | Powerdown | Difference |
|---|---|---|---|
| 2022-01 | 4,529,550.000 | 2,924,271.000 | 1,605,279.000 |
| 2021-12 | 3,561,589.000 | 5,121,574.000 | -1,559,985.000 |
| 2021-11 | 1,857,545.000 | 2,848,894.000 | -991,349.000 |
7. Transfers
These graphs show the volume (in USD) of HIVE and HBD transferred between accounts.
8. Exchanges
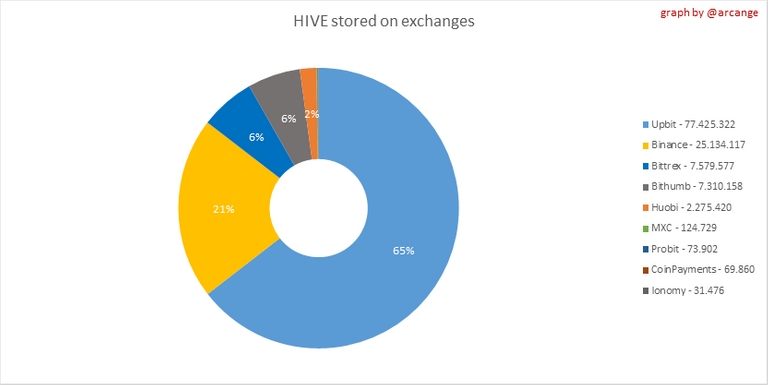 |  |
These graphs show the amount and distribution of HIVE and HBD stored on the exchanges where they are listed.
 | 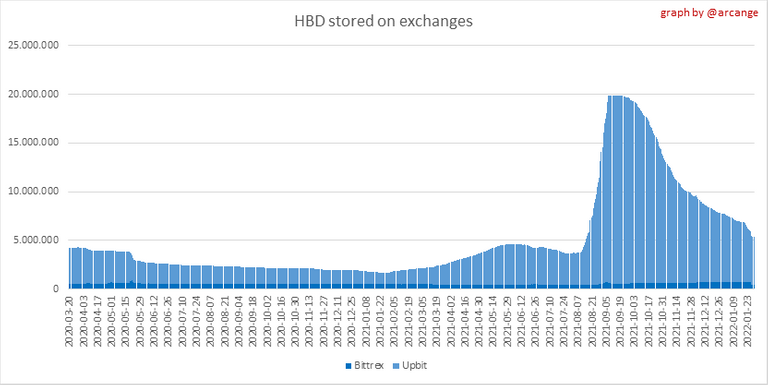 |
These graphs show the daily evolution of HIVE and HBD stored on the exchanges where they are listed.
I hope you find those stats useful. If you would like to see additional stats, feel free to drop me a comment. Your feedback is than welcome.
Thanks for reading.
Check out my apps and services


PIZZA Holders sent $PIZZA tips in this post's comments:
@pixresteemer(2/5) tipped @arcange (x1)
Learn more at https://hive.pizza.
$WINE
Congratulations, @theguruasia You Successfully Shared 0.200 WINEX With @arcange.
You Earned 0.200 WINEX As Curation Reward.
You Utilized 2/3 Successful Calls.
Contact Us : WINEX Token Discord Channel
WINEX Current Market Price : 0.333
Swap Your Hive <=> Swap.Hive With Industry Lowest Fee (0.1%) : Click This Link
Read Latest Updates Or Contact Us
Hi @arcanage. Hope you're doing good. Had a question related to Hive-Net library.
Why are we still on .NET standard and not on .NET 5 or 6? Would you be fine with me taking up that task or do you already have ongoing development to migrate to the latest .NET version?
The project is open source. Feel free to contribute and push a merge request.