This is the fourth part of a 9 part tutorial series about the R Statistical Programming Language, targeted at data analysts and programmers that are active on Steem.
In this course you will learn the R programming language through practical examples.
![]()
Repository
The R source code can be found via one of the official mirrors at
This tutorial is part of a series, the text as well as the code is available in my github repo
What Will I Learn?
The first two tutorials introduced the basics of R and the free R Studio IDE, the rest of this series will focus on worked examples where we will slowly introduce new concepts and learn some of the extended functionality of the R programming language.
In this tutorial you will:
- Get an intro to Data Wrangling with R
- Learn techniques to Explore Raw Data with R
- Learn about Regular Expressions in R
- Learn how to Manipulate Dates in R
- Extract Clean and Visualise a Raw Dataset
Requirements
- Lesson 1 Introduction to R
- Lesson 2 Finding Your Way Around R
- Basic Knowledge of Statistics
- Basic Programming Experience
- Some Knowledge of Steem and Cryptocurrencies
Difficulty
Intermediate

Data Wrangling
80% or more of a data analysis project can be spent on this first stage, data cleaning.
What is Data Wrangling?
Data that has been collected is usually in a raw unprocessed messy format. The first stage of data analysis involves detecting and correcting corrupt or inaccurate data from a dataset and standardising the formatting and meaning of the data.
- Data can be corrupt if it is incomplete, inaccurate or irrelevant.
- Data may also be in the incorrect format for analysis.
How does R help?
R enables you explore your data using statistical summary tools and visualizations.
R excels in data manipulation, it has general flexibility common to other languages including tools such as Regex, but packages extend generic functionality and provide a concise syntax (low cognitive) for data cleaning and manipulation. The most advanced set of packages are known as the TidyVerse set of packages where data processing actions are expressed as verbs.
The TidyVerse ...
Apart from mentioning it, I will not talk much about the TidyVerse ecosystem of opinionated packages much in this tutorial. For our introduction to data cleaning with R we we will focus on using features of the data.table package and get an introduction to regular expressions and a useful date package for cleaning our data.
Data.Table
The data.table package is a good place to start in R for data wrangling for two reasons:
- It has a familiar structure, providing a table or database like structure to the data. It is interchangeable with a data frame format which is a commonly used data storage framework in R.
- It is extremely fast.
- It works with efficiently with very large datasets.
Exploring the Data
Before modifying of fixing any of our data we can use some functionality from R to have a look at it. We will work through some of these tools using live data from the Steem Blockchain.
***To begin we will get some interesting data using the steemRdata package. ***
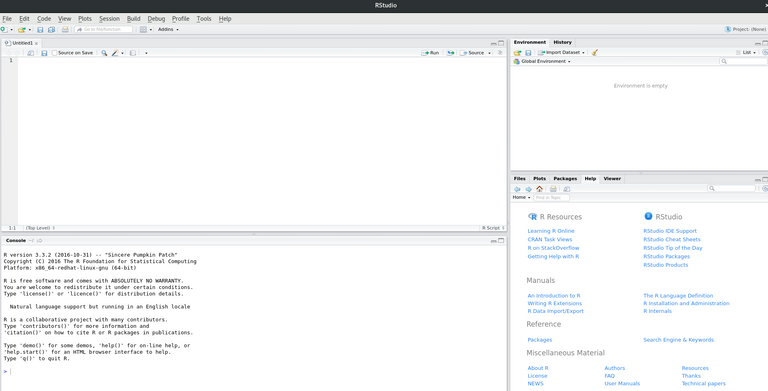
We will first load our familiar R Studio setup. If you need to refresh about R Studio, you may look back to Lesson 2 for a refresher.
Open R Studio and open a new untilted script where we will type our code
Load the steemRdata package by typing the following in the script and hitting ctrl + Enter to send the command to the console
library(steemRdata)
For this exercise we are going to look at delegations made by @blocktrades and see what insights we can get by exploring the data.
We will now get all the delegations that are being made by the @blocktrades account
Type the following in our script and send to the console
blocktrades <- getDelegation("blocktrades")
- This will retrieve data about all the delegations from the Blocktrades account and store it in a variable "blocktrades".
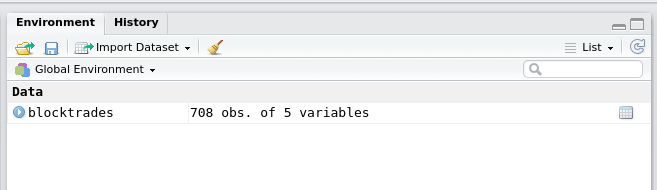
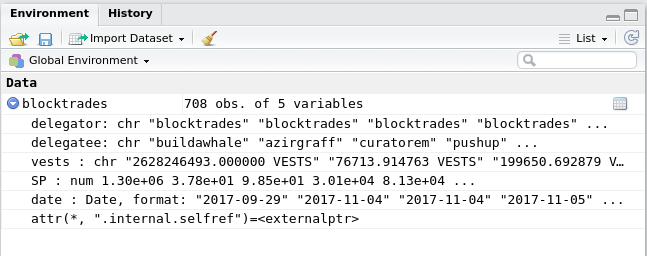
- You will see a variable appear in the upper right area of R Studio
Exploring the Data
Typing the variable name in the console gives us a summary of the data.
blocktrades
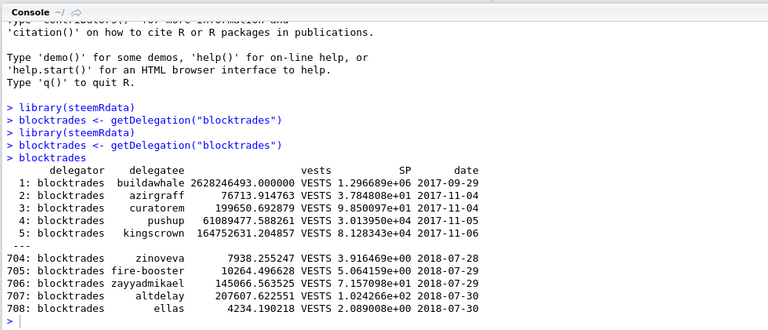
- From this we can begin to understand the data, we can see how many rows, some data items etc.
To take this a little further we can get more details of the fields using the str (structure) command
str(blocktrades)
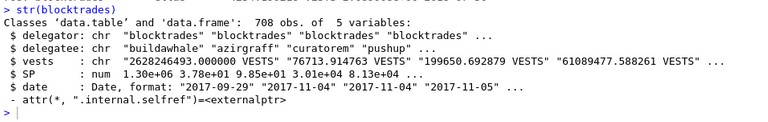
- We can now see that some of the fields have numeric values and some are characters.
You could also see the same information by expanding the blue button in the Environment window
We now have our data loaded from the blockchain
Next we can get a statistical overview by typing the summary command and sending it to the console
summary(blocktrades)
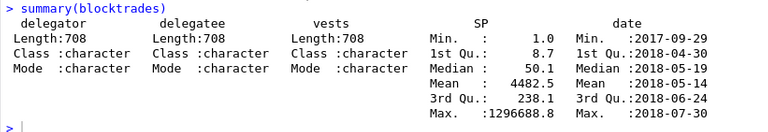
- For each field we get a statistical summary
- We get a 5 number summary if the data fields is a numeric field
- If the field is a character we get less info, here just the the size of the field.
- If the field is a factor (which we will discuss in later tutorials) we get a cross tab summary.
Today I am going to look at how much SP @blocktrades is delegating to different accounts. I can access the SP field with the following command
blocktrades$SP
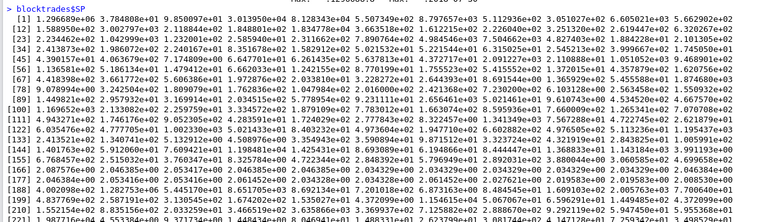
- This shows all the SP for each delegatee in the console but using R we can build in visual statistical summaries.
To view a histogram of the data type
hist(blocktrades$SP)
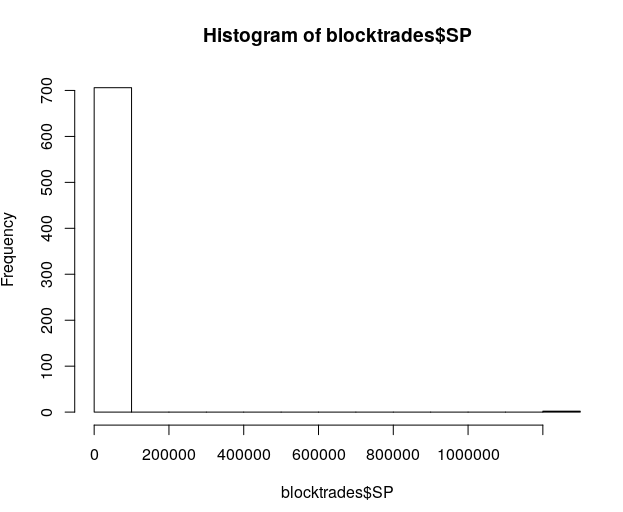
- Here you can see the distribution of the SP, lots of small delegations and some very big ones.
To view a boxplot of the data
boxplot(blocktrades$SP)
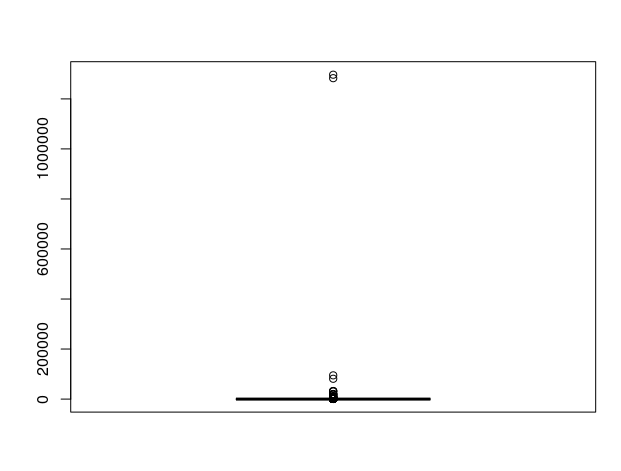
- The boxplot is another way of representing the distribution of the SP, again lots of small delegations and some very big ones.
At this stage we have explored the data. The data is complete, there are no errors but there may be extra columns we would like to add, or subsets of the data we wish to look at.
Regular Expression
Regular expressions provide tools for searching and manipulating strings which are extremely useful.
We mentioned that R has many general purpose tools such as Regular Expressions but it extends the generic functionality with add on packages.
In R the stringr package makes working with regular expressions really easy. If this is not installed we can install it before loading it.
install.packages("stringr")
Load the package
library(stringr)
We will now check each delegatee to see if they have the word “steem” in the username using the "str_detect" function.
blocktrades[str_detect(delegatee, "steem")]
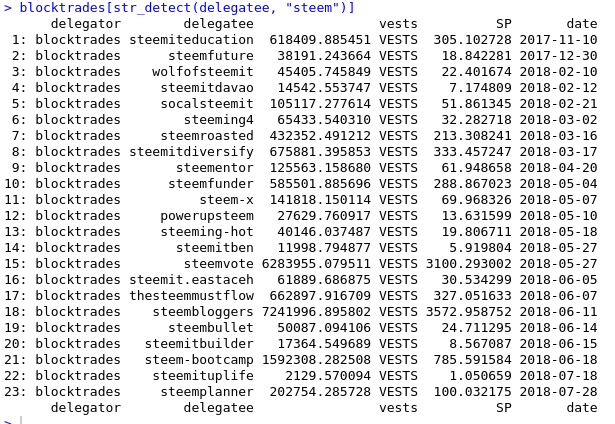
- str_detect is a function from the stringr package which takes two arguments. The field to search, and the regular expression to search for, in this case the word steem. The function will return true or false if it matches the string. This filters our result to just show the rows of the blocktrades variable that have the matching condition
- We found 23 delegatees with the word steem in their name
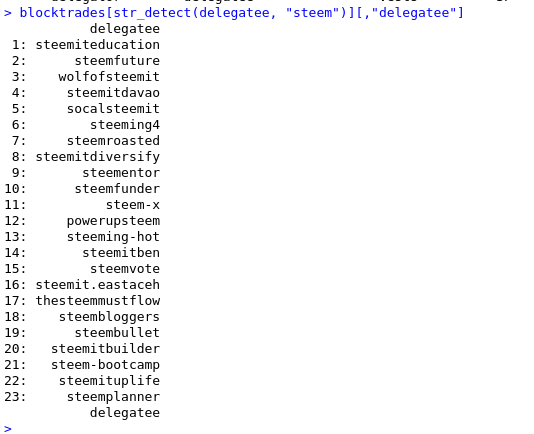
You can tidy this up into one line and chain multiple expressions to the data table syntax
blocktrades[str_detect(delegatee, "steem")][,"delegatee"]
This is very basic example of a regular expression but it is a really powerful tool that is seamlessly integrated into R. It is ideal for parsing blockchain data and building up complex regular expressions to extract text that you are looking for from json_metadata.
Working with Dates
Dates are fun in any programming language, but in R there are packages that make working with dates very intuitive. The package we are using today is the lubridate package.
install.packages("lubridate")
library(lubridate)
We are going to use this package to add a year and month column to our dataset so that we can summarise and plot monthly SP delegations.
Adding a column in a data.table we can use the := command which performs row wise operations on the data.table. In this case we apply the month and year function and store them in new fields "del_month" and "del_year"
blocktrades[, del_month:=month(date)]
blocktrades[, del_year:=year(date)]
Plotting the Data/Modelling
For illustration purposes today we are going to plot monthly totals for SP delegated in 2018.
At this stage in our workflow we have explored our data, cleaned it and and added a few useful columns which we are now going to use to plot the data.
To plot our data we will use the ggplot2 package from previous tutorials.
library(ggplot2)
We will next use the ggplot function to make a bar plot using the geom_col() function.
ggplot(blocktrades[year==2018], aes(x=month, y=SP))+geom_col()
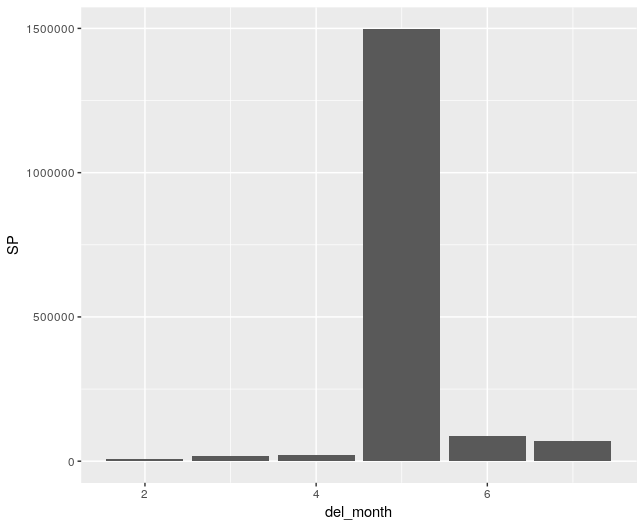
- In this command we have filtered the data where del_year is 2018 i.e. blocktrades[del_year==2018]
- We specify the aesthetics, the x variable is the month, and the y variable is the Steem Power Delegated or SP i.e. aes(x=month, y=SP)
- We use the plotting function geom_col() which creates a bar chart based on our data
To see how many delegations were made each month you can use a very similar plotting command but with a different geometry
ggplot(blocktrades[del_year==2018], aes(x=del_month))+geom_bar()
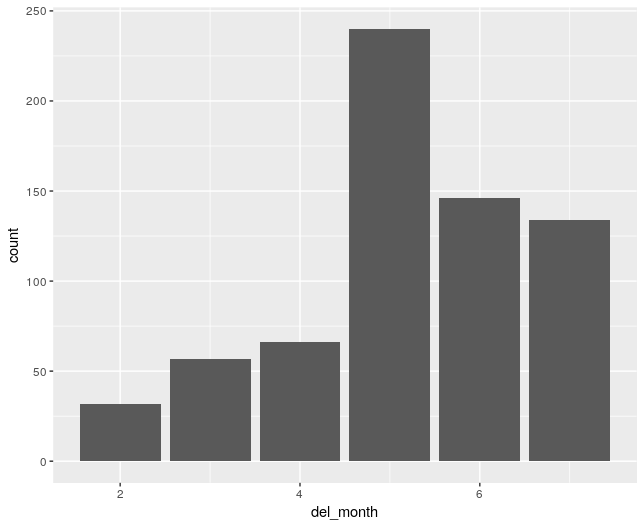
- geom_bar() counts the number of observations in each bucket, in this case the buckets are specified by the month.
Recap
In this lesson:
- Get an intro to Data Wrangling with R
- Learn techniques to Explore Raw Data with R
- Learn about Regular Expressions in R
- Learn how to Manipulate Dates in R
- Extract Clean and Visualise a Raw Dataset
Benefits of Using R for Data cleaning
- Powerful Regular Expression Support,
- Support For Dates and Other Awkward Formats
- Fast rowwise Data.Table Operations on Large Datasets
- Advanced Best Practice Workflows Built into Package Design
Code Used
Get Data from the Steem Blockchain
library(steemRdata)
blocktrades <- getDelegation("blocktrades")
blocktradesExplore the Data
str(blocktrades)
summary(blocktrades)
blocktrades$SP
hist(blocktrades$SP)
boxplot(blocktrades$SP)
install.packages("stringr")Run regular expressions to filter the data
library(stringr)
blocktrades[str_detect(delegatee, "steem")]Add features to the data
install.packages("lubridate")
library(lubridate)
blocktrades[, del_month:=month(date)]
blocktrades[, del_year:=year(date)]Visualise the data
library(ggplot2)
ggplot(blocktrades[del_year==2018], aes(x=del_month, y=SP))+geom_col()
ggplot(blocktrades[del_year==2018], aes(x=del_month))+geom_bar()
Coming up
This course will cover the basics of R over a series of 9 lessons. We began with some essential techniques (in the first 2 lessons) and I will take you on a tour of some of the more advanced features of R with worked examples that have a Cryptocurrency and Steem flavour.
Rich data structures are one of the key features of R. In the next lesson we will explore time series data structures which will allow us to work efficiently and intuitively with time series data.
We might even make a few predictions about the price of Steem!
Curriculum
For a complete list of the lessons in this course you can find them on github. Feel free to reuse these tutorials but if you like what you see please don't forget to star me on github and upvote this post.
Related Posts
Thank you for reading. I write on Steemit about Blockchain, Cryptocurrency and Travel.
R logo source: https://www.r-project.org/logo/
But stringr, lubridate, ggplot2... those are all part of the tidyverse! Which is great, these days I think the tidyverse is the main thing R has got going for it. Cool to see that there is a
steemRdatapackage.One thing that I think is a BIG PROBLEM with R is how namespaces are handled. Even though you don't have to do
steemRdata::getDelegation, you should so:getDelegationyou are calling. For example in Python,from package import *is discouraged for this reason.Namespaces can be annoying alight, I do get conflicts with packages I have loaded.
I use lubridate and ggplot2 all the time but there are many other newer packages in this group that I want to learn more about. The TidyVerse is great.
I do not have the time right now, but will bookmark these for later.
Just so you know I will do a round up when I finish of the highlights.
Congratulations! Your post has been selected as a daily Steemit truffle! It is listed on rank 13 of all contributions awarded today. You can find the TOP DAILY TRUFFLE PICKS HERE.
I upvoted your contribution because to my mind your post is at least 22 SBD worth and should receive 89 votes. It's now up to the lovely Steemit community to make this come true.
I am
TrufflePig, an Artificial Intelligence Bot that helps minnows and content curators using Machine Learning. If you are curious how I select content, you can find an explanation here!Have a nice day and sincerely yours,

TrufflePigThank you for your contribution.
Your contribution has been evaluated according to Utopian policies and guidelines, as well as a predefined set of questions pertaining to the category.
To view those questions and the relevant answers related to your post, click here.
Need help? Write a ticket on https://support.utopian.io/.
Chat with us on Discord.
[utopian-moderator]
Cheers @portugalcoin ;)
Thanks for your informative post.
Hey @eroche
Thanks for contributing on Utopian.
We’re already looking forward to your next contribution!
Want to chat? Join us on Discord https://discord.gg/h52nFrV.
Vote for Utopian Witness!