In this tutorial series you will learn how to use the open source R programming language and the steemRdata package to analyse data from the Steem Blockchain.
![]()
Repository
The R source code can be found via one of the official mirrors at
https://cran.r-project.org
What Will I Learn?
This is the second part of a 9 part tutorial series about the R Statistical Programming Language, targeted at data analysts and programmers that are active on Steem. This 2nd tutorial is quite long but in it we will cover all the basics of using R. You may wish to review Lesson 1 Introduction to R before proceeding.
Subsequent tutorials will focus on worked examples and we will introduce new concepts with each lesson.
In this tutorial you will:
- Become Familiar with the R Studio IDE
- Learn the basics of R data structures and functions
- Learn the basics of R Packages
- Learn how to import and export data to the R environment
- Plot and Summarise Data with R
- Get an overview of the different Graphics Engines in R
- Use the steemRdata package to download all your Steemit Posts.
Requirements
- Lesson 1 Introduction to R
- Basic Knowledge of Statistics
- Basic Programming Experience
- Some Knowledge of Steem and Cryptocurrencies
Difficulty
- Intermediate
R Studio
R Studio is an IDE for R which includes many useful features for managing your data, storing and running scripts as well as managing packages. In the Introduction to R post we began using R Studio (The Free Version). Today we will take a closer look at some of the features of the IDE.
You do not need to use R studio to use R but it has many useful features especially when you are learning.
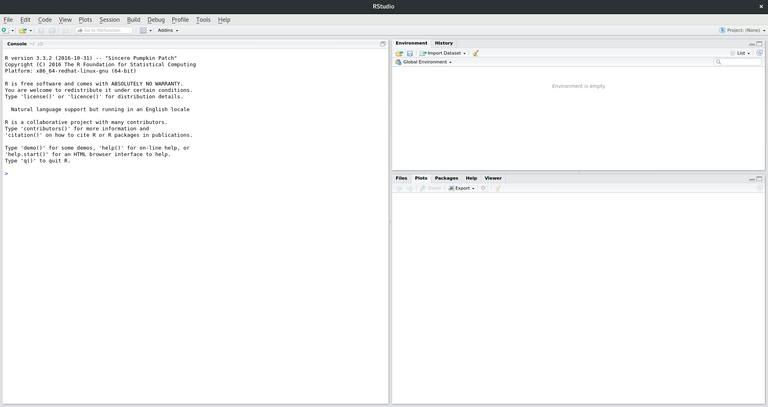
Default Layout
The default layout for R studio is a 3 screen layout. This is what you see when you open R Studio for the first time.
Scripts
R commands are executed in the console, but in order to reuse and save code you typically open up an R script, write the code there then send it to the console to be executed.
open a new script
Click File > New File> R Script.
This adds another window to the R Studio IDE which is an empty script file. This can be seen on the top left.
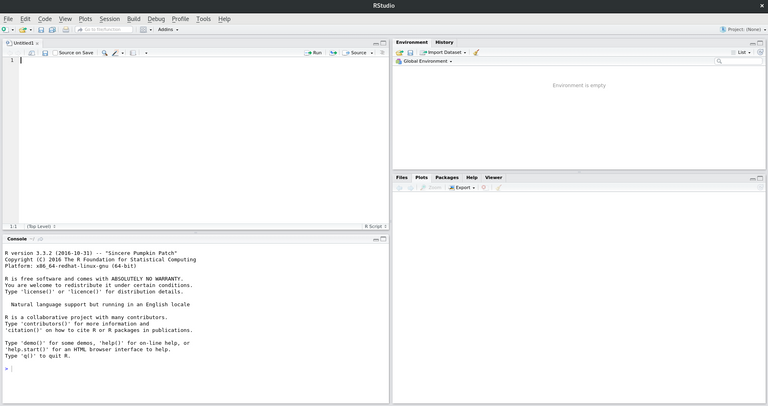
In the IDE we can also see the following sections
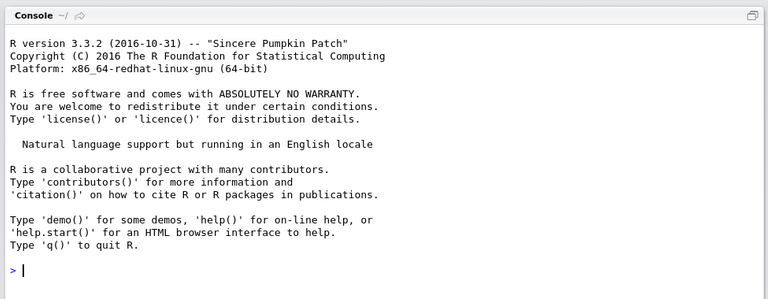
Console (Bottom Right)
This is an interactive area where your commands are executed. If you wish to run a script you must copy and paste the commands to the console, R studio provides a convenient way to pass commands from your scripts (Ctrl + Enter). You can cycle through commands in the console (just like a terminal) and this is useful to tweak formulas.
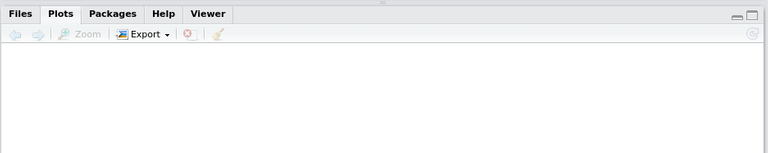
Files, Plots, Packages, Help, Viewer
This pane shows output from running commands (Plots, Help, Viewer) as well as important configuration options (Packages) and a way to navigate the local files.
Typical Workflow
A typical workflow coding in R will be as follows:
- type commands in the script file
- Send the commands to the console (Highlight Code in script file then hit Ctrl+Enter)
- View the output in the console and graphics on the bottom right pane
You will also see any variables that are created under Environment in the top right pane

Now that we have gotten to know our workspace we can take a closer look at some of the building blocks of R programmes, namely data types & structures and functions. Let's get coding
Data Types & Structures
vectors, matrices, arrays, lists & data frames
R is used for statistical analysis and every analysis will have data inputs and outputs.
At the lowest level R data is stored in two different formats; numeric and character but R allows you to build rich data structures from these two basic types. What makes R powerful as a prototyping language is that it is intuitive for statisticians to use. The basic data structures have intuitive features and work as a non specialist programmer, such as a statistician, would expect.
There are 4 basic data structures in R ; Vectors, Matrices, Arrays and Lists
Vectors – a 1 dimensional array of elements
You can construct a vector with the c (combine) command.
Type the following into the script file , select it and hit ctrl + enter
x = c(1,2,3,4)
x
You will see the results in the commands being sent to the console and the results.
- The first command creates a vector x with elements 1,2,3,4
- The second command prints the values stored in the vector x
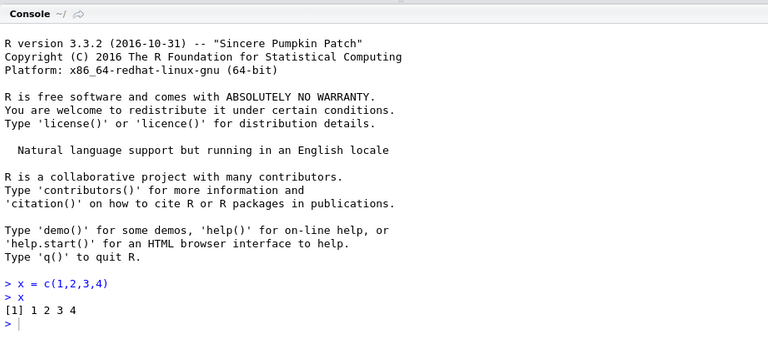
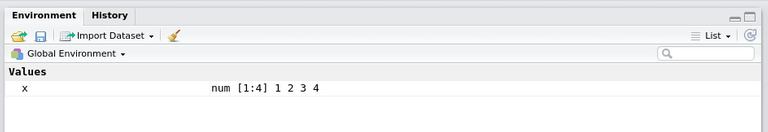
You will also notice a vector appearing in environment (top right)
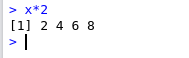
Most R functions operate on vectors in an intuitive way. By giving the basic elements (numbers characters) some higher level structure, R knows how to deal with the basic operations. For example if we multiplied the vector x by 2, R will automatically multiply each element of the vector by 2.
In the console type the following and you will see the result of multiplying each element of the vector x by 2.
x*2
Matrices – a 2 dimensional array of elements
To construct a Matrix we need to use the matrix function and specify a few parameters.
In the script file underneath the vector code, type the following, select it and hit ctrl + enter
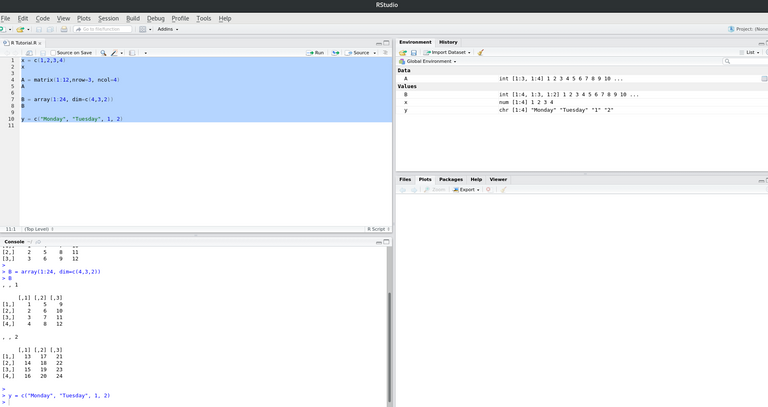
A = matrix(1:12,nrow=3, ncol=4)
A
You will see the results in the commands being sent to the console and the results.
- The first command creates a Matrix A with elements 1,...,12 with 3 rows and 4 columns
- The second command prints the values stored in the Matrix A
- You will also notice a Matrix A appearing in environment (top right)

Arrays – higher dimensional arrays of elements
To construct an Array we need to use the array function and specify a few parameters.
In the script file underneath the Matrix code, type the following, select it and hit ctrl + enter
B = array(1:24, dim=c(4,3,2))
B
You will see the results in the commands being sent to the console and the results.
- The first command creates an Array B with elements 1,...,24 with 4 rows and 3 columns and 2 layers
- The second command prints the values stored in the Array B
- You will also notice an Array B appearing in environment (top right)
You will have noticed that in all the above examples we have only had numbers. For Vectors, Matrices and Arrays. If we had used Characters then they would all the elements would have been the same type.
In the script file underneath the Array code, type the following, select it and hit ctrl + enter
y = c(“Monday”, “Tuesday”, 1, 2)
in this case typing x*2 in the console would give an error.
So the conclusion is elements of a Vector, Matrix or Array can be a number or a character but not both.
Can we have mixtures of types of elements?
Lists – These are data structures potentially composed of heterogeneous elements.
Lets combine the first three variable we have created into a list
In the script file underneath the other code, type the following, select it and hit ctrl + enter
alist =list(vec=x, mat=A, arr=B)
alist
You will see the results in the commands being sent to the console and the results.
- The first command creates a data structure that includes x, A & B
- The second command prints the values stored in the list. This data structure is richer and in order to access the different elements we can use commands as follows
alist$vec #(Equivalent to x)
alist$mat #(Equivalent to A)
alist$arr #(Equivalent to B)
Data Frames and Data Tables
A special type of list is called a dataframe. This is a two dimensional table (much like a spreadsheet) and was common for storing data but it is not very efficient. We mention it here because it is common and easy to use. For the rest of the course we will use a similar structure which is not native to base R but is introduced via an add on package. This structure is called a Data Table.
Before moving on to the next section lets save our untitled script so we can close out of it and come back later
Click File>Save As
Choose a location and save using a suitable name e.g. "R Tutorial.R"
Your IDE should look like this
Functions & Help
In Built
R includes basic mathematical operations such as addition, subtraction, multiply … but it extends basic arithmetic with hundreds of inbuilt mathematical operations for statistical analysis.
For example to calculate the natural log of 100, you can use the log function.
In the console type
log(100)
Help
To get help about a functions you can type help(funName)
In the console type
help(log)
You will see the help files in the bottom right screen in R Studio.

User Defined Functions
R lets you create your own functions using a straightforward syntax.
In the script file under the other code type the following, select it and and hit ctrl + enter
square <- function(x) {
return(x*x)
}
You can now type in the console to see 5 squared
square(5)
Packages
Add on Packages CRAN, github
You can extend the functionality of base R by loading R packages. The main R repostirory for pacakges is called CRAN. There are over 14,000 and counting in this repositry alone. Packages generally add additional functions which you can then use in your workflow.
- For example steemRdata adds functions for querying data from the Steem Blockchain.
To install packages from CRAN you can click on the packages tab in R studio, and search for a package to install. Packages shown here are in the main R repository only. These are not official packages but rather user submitted packages to CRAN.
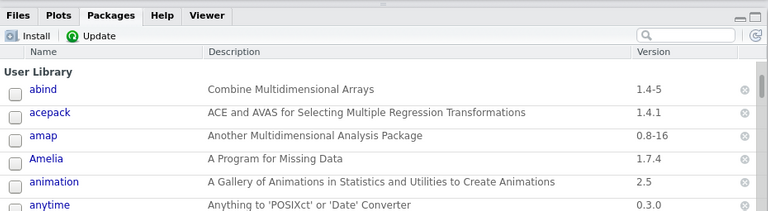
- Packages already included in the list shown in R Studio are already installed locally but in order to make them active you need to tick the box next to the package name which loads it.
Install Devtools
There are many additional packages which you can install that are not on CRAN and in particular there are many on github which you can install. To make this process easier a package called devtools makes downloading and compiling packages from github directly. We will install this package now.
Click on the Packages Tab
Click Install
type devtools
click install
This will take a few minutes to complete as it downloads the package and any dependencies. When it is complete you can activate the devtools package by scrolling down and ticking the box. or typing library(devtools) in the console.
If you wish to see what is in a package you can browse the help files on the bottom right screen by clicking on the hyperlinks. Packages in R are generally well documented.
steemRdata
We will make use of the steemRdata package in this course so lets install this package from github
Type into the console
library(devtools)
install_github("kharoof/steemRdata")
When this has completed you will see it appear in the right hand screen next to the other packages.
Our Environment is configured, we have learned about data structures and packages so we can now start loading data and analysing it
Data Import and Export
The first stage of any analysis will involve reading in the data to R, and specifying the data types and storage format (data frames, vectors, matrices, lists)
To keep this simple to begin we will only read in data that is stored in nicely formatted csv files but R is very flexible and in future lessons we will see how easy it is to read in data from remote locations and even scrape webpages for data.
In the console Type
library(data.table)
steem_data <- fread("https://raw.githubusercontent.com/kharoof/R-Tutorials-for-Steemit/master/steem_data.csv")
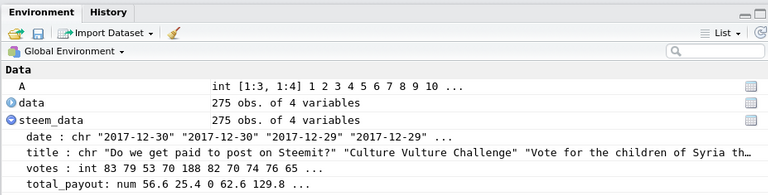
steem_data
- We can see steem_data is a variable/data structure that includes a list of steem posts with the post title, date, number of votes and post payouts
In order to save output you would use a similar command e.g.
In the console Type
frwite(data=steem_data, file="steem_data.csv")
Data Exploration
Now that we have loaded our data to the R environment we can begin our data analysis
Basic Stats
We will first look at basic summary stats for our dataset which give us a feel for the data (quantile, max, min, mean, mode)
In the console Type
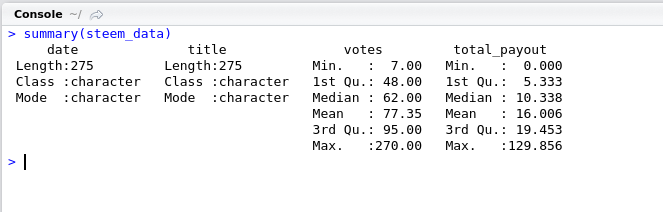
summary(steem_data)
This shows you a summary of each column of the table
You can also explore the data by clicking on the data item in the environment pane on the top right
Deeper Analysis
Our data is stored in a variable called steem_data. In order to access just the votes of our data table
In the console Type
steem_data$votes
Lets explore the votes using some of R’s powerful statistical analysis capabilities
In the console Type
plot(steem_data$votes)
Then type
hist(steem_data$votes)
- You will see two graphs appear showing properties of the data.
Graphics
R graphics are based on 4 core graphics engines. Each has its own strengths and weaknesses and can be used in the analysis stage and the final output and presentation stage.
- Base – useful for quick plotting (pen and paper type analysis)
- Grid – not usually used directly but implemented by other packages.
- Lattice – multidimensional visualisations including faceting.
- ggplot2 – advanced polished visualisations implementing grammar of graphics
We have seen some basic graphs which are useful and quick to get a feel for the data. Lets begin looking at more advanced graphics capabilities which can be accessed by enabling the ggplot2 packages
ggplot2
Looking at the following code initially it may seem more complicated than the base plot function, but we will see in later tutorials how ggplot2 and its implementation of the grammar of graphics can be used to create powerful insightful graphics.
Don't forget most of this code is stored in scripts. You do not need to know how to write it you just need to know what parameters you can tweak to get it working.
Load the ggplot2 package. In the console type
library(ggplot2)
Plot the Vote Data, In the console type
ggplot(data, aes(x=date, y=votes))+geom_point()
Plot the Payout Data, In the console type
ggplot(steem_data, aes(x=date, y=total_payout))+geom_point()
- You will notice here all we had to change was the name of the variable.
The first part "ggplot" specifies the data and the aesthetics of the data we wish to graph, the second part "geom" specifies how we want to plot the data. In the first example the aesthetics are date and votes (the x and y axis) and the geom is to plot these aesthetics as points.
Analyse your own Blog
You have now mastered the basics of R and you can begin to start analysing your own Steemit blog feed with it. We will use the steemRdata package to get your post history.
In the console type the following
library(steemRdata)
my_data <- getBlog("steemusername") # Change steemusername to your steemit user name
summary(my_data)
- The output will include a lot of fields with each record in the data.table representing one of your posts.
You may wish to try to run some of the commands we learned today such as hist(my_data$votes)
Coming up
This post covered the basics of R but you can already see how easy it is to use. After just 2 lessons we are downloading data from the steem blockchain and visualising it.
This course will cover the basics of R over a series of 9 lessons. We begin with some essential techniques (in the first 2 lessons) and I will then take you on a tour of some of the more advanced features of R with worked examples that have a Cryptocurrency and Steem flavour. The next tutorial will look at scraping web data with R.
Curriculum
For a complete list of the lessons in this course you can find them on github. Feel free to reuse these tutorials but if you like what you see please don't forget to star me on github and upvote this post.
Related Posts
Thank you for reading. I write on Steemit about Blockchain, Cryptocurrency and Travel.
R logo source: https://www.r-project.org/logo/
Wow, very impressive. 'R' is one of the languages I've been aiming to add to my repertoire. Will definitely be following you!
Nice tutorial, always wanted to learn about R language, we had statistics in college but it felt pretty boring... They should have taught us about R
Thank you. I think statistics can be boring until you see applications of it. This series will focus on the applications. I hope you find something useful in every tutorial.
I admit I am a bit of a data geek but I think it gets really interesting when you combine R with the steem blockchain :)
Can it be used with python api of steem
R is very versatile and you can use python from within R.
You could also use the httpRequest package within R to directly query the REST API.
Congratulations! Your post has been selected as a daily Steemit truffle! It is listed on rank 21 of all contributions awarded today. You can find the TOP DAILY TRUFFLE PICKS HERE.
I upvoted your contribution because to my mind your post is at least 15 SBD worth and should receive 106 votes. It's now up to the lovely Steemit community to make this come true.
I am
TrufflePig, an Artificial Intelligence Bot that helps minnows and content curators using Machine Learning. If you are curious how I select content, you can find an explanation here!Have a nice day and sincerely yours,

TrufflePig@eroche very nice tutorial, I will be honest, I have not tried it, but I have read the tutorial and from an e-learning view point this is very well laid out. R scripts can be used in Power BI but I have never tried it, as I don't know R. But if I follow you then I have a chance. as soon as I have time I will try this out. Thank you.
Thanks for the comment Paula, it means a lot. After reading the feedback from the Utopian reviewer I was beginning to think I needed to rethink completely how I was presenting it. Sure a few things could be improved but I think there is a decent balance in this piece.
We should get together and do a tutorial on implementing r in power bi.
Thanks for the comment.
ohhhhhh would love that........wow.....good idea, a series of tutorials would rock, the powerbi community (off steemit) would love it.
Just finished writing and recording a stats in excel course so stats are fresh in my head. I have never touched R. but you know how I like data, so not knowing it feels like I am missing out.
I hope that you continue with this series, because I for one would love to learn and when I understand it then I am sure I will know others also interested :-)
#learnandearn
Great, I have 9 lessons in store for this R course, the rest will be all use cases/worked examples. We will see if any are suitable as good showcases for integrating to powerbi and we may be able to team up on that.
awesome - I look forward to working with you :-)
@eroche R language was in my Todo list. Now you give me a push . I'll definitely going for it now . thanks ;)
I have some interesting hands on tutorials on the way. I'll aim for one a week. Next week is webscraping.
@eroche am waiting eagerly.
So many things one can discover with R and Steem! This is a great tutorial, @eroche, congrats!
Thank you
Thank you for your contribution.
Your contribution has been evaluated according to Utopian policies and guidelines, as well as a predefined set of questions pertaining to the category.
To view those questions and the relevant answers related to your post, click here.
Need help? Write a ticket on https://support.utopian.io/.
Chat with us on Discord.
[utopian-moderator]
Hi @portugalcoin, I haven't received an upvote for this post and its 2 days since you reviewed it. Is there an issue with it?
Thanks
I am still waiting on an upvote for this. Would you check out why there is such a delay. Thanks
You are next in queue to get upvoted. You should get one in 17 min.
Hey @eroche
Thanks for contributing on Utopian.
We’re already looking forward to your next contribution!
Want to chat? Join us on Discord https://discord.gg/h52nFrV.
Vote for Utopian Witness!
Thank you for sharing. I look forward to going through the training.