In this tutorial series you will learn how to use the open source R programming language and the steemR package to analyse data from the Steem Blockchain.
Repository
The R source code can be found via one of the official mirrors at
https://cran.r-project.org
The steemR source code can be found at https://github.com/kharoof/steemR
What Will I Learn?
This is the beginning of a 9 part tutorial series about the R Statistical Programming Language, targeted at data analysts and programmers that are active on Steem.
In this tutorial you will:
- Get an Introduction to the course.
- Install free and opensource R as well as a free IDE for managing your workflow, R Studio
- Learn about benefits of using R
- Get started using R, by visualising a sample data set.
Requirements
- Basic Knowledge of Statistics
- Basic Programming Experience
- Some Knowledge of Steem and Cryptocurrencies
Difficulty
- Intermediate

R
R is an free open source software environment for statistical computing and graphics. R is widely used in academia and should be on any serious statisticians to do list. The initial learning curve can be steep and it lends itself to people who like working with scripting languages, and with programming backgrounds.
Key benefits of using R:
- Cutting edge modelling techniques and extensive documentation
- Data Manipulation
- Powerful graphics
- R can work with different data types and it is not limited to the rectangular data structure required by environments such as Excel. A useful example is the time series structure which we will cover in this course.
Once you get past the initial learning curve R becomes extremely intuitive to use and the documentation is extensive.
You can extend the basic functionality with user defined functions and add on packages.
R also increasingly integrates with existing established statistical programs such as Excel and SAS.
Scripting vs Spreadsheets
I use spreadsheets every day, they have many uses and are they are the go to tool in industry. Scripting languages like R have some advantages over spreadsheets.
- For certain tasks the structure that a scripting language imposes improves performance and reduces errors compared to using spreadsheets.
- Scripting languages make it easy to iterate though models.
You can update data, assumptions and even formulas without breaking the structure of your models. How many times have you noticed an error with some data in a spreadsheet at the last minute but were afraid to fix it in case it messed up your graph? - Scripting languages make it easy to create reusable templates. We will see examples of these in this course where we will create graph templates that can be reused.
Many of the positives of R could also be said about SAS or other scripting languages such as Python however these programmes differ in some respects and I have found R to be much more versatile, intuitive and rewarding for statistical analysis. It is so intuitive to use when you become familiar with it.
fRustRation
The initial frustration that many new users find with R is usually the perception that simple things are not easy or intuitive.
In a spreadsheet program it is very intuitive to create a graph for example. Simply; open a spreadsheet, type in a table of data and plot a line graph by pointing and clicking. You can even click and add titles and format them as you wish to polish the graph.
Managing graphs gets more difficult if you are updating an existing template or adding data.
With a scripting language such as R you first read in the data to the program then call a function that plots the graph. If you are starting from scratch you will find it comparatively more difficult than using spreadsheet. You can’t just type in data and plot the graph without guidance. However if you have a script with the necessary commands set up you can easily plot a graph. Scripts and templates are widely available so you don’t even need to create them yourself.
Installation
There are two programs you will need to install for this course. Base R is the engine and is all that you need to use R however we will also be using a free version of general purpose IDE called R Studio which streamlines the process of creating scripts and visualising your environment.
To get started download and install the latest versions for your system from the following links
R
R Studio (Free Version)
Getting Started
In the next tutorial we will show you around the R Studio IDE but if you are eager to get started open R Studio and let's give it a go!
- Open R Studio
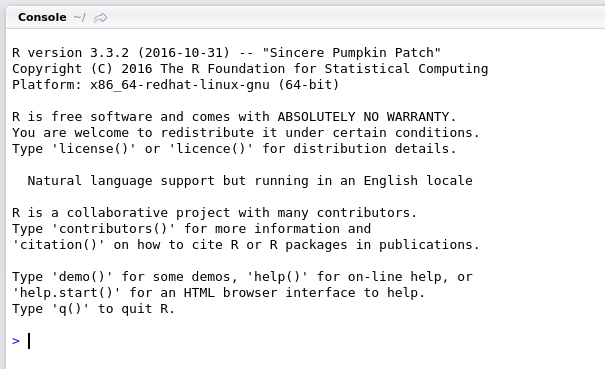
You will notice a widow called “console” when you open R Studio. In this console you can type commands.
Next we will look at a sample dataset ...
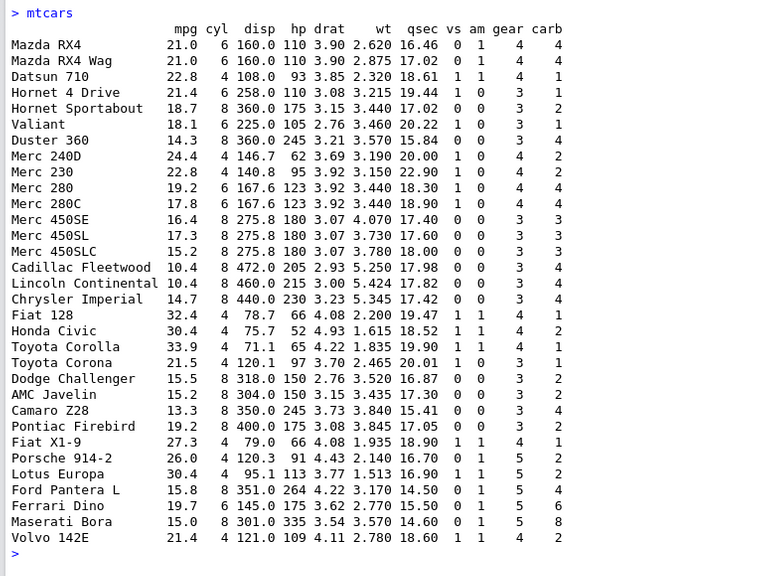
- Type the following command in the console
mtcars
You will see a sample dataset that is available called "mtcars"
What does this dataset mean?
We can look at the help file for this dataset to find out more ...
- Type the following command in the console
help(mtcars)
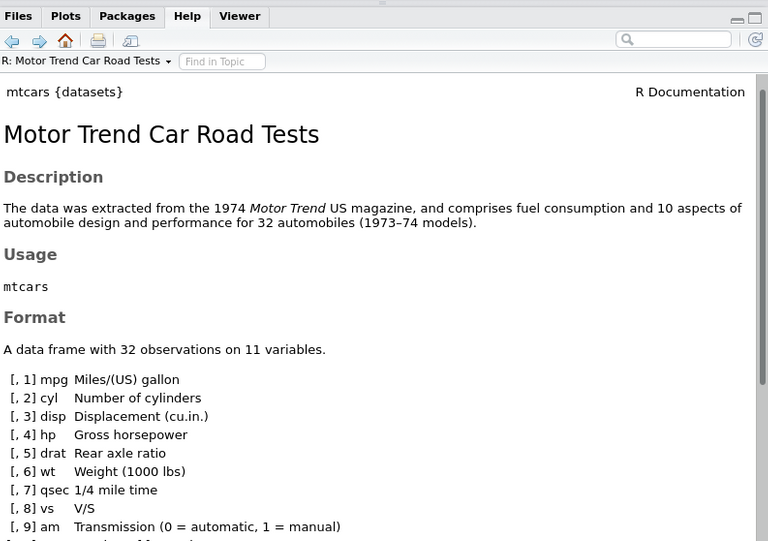
In the help section of the R Studio IDE you will see details about the dataset. After reading this we can now visualise the data
What does the data look like?
We will plot the data to examine it ...
- Type the following command in the console
plot(mtcars)
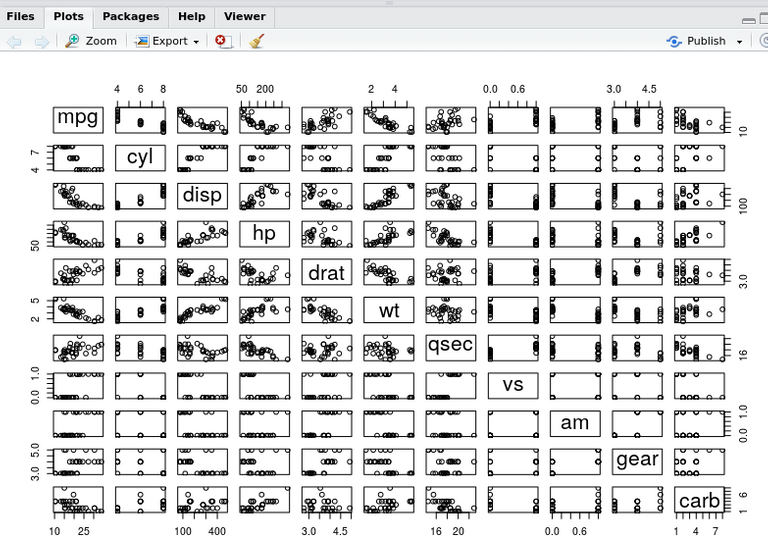
This graph shows an X-Y plot of all the variables in the mtcars dataset.
Coming up
This post just looked at some basic features of R but you can already see how easy it is to use. With just a few simple commands we can visualise our data.
This course will cover the basics of R over a series of 9 lessons. We will begin with some essential techniques and then I will take you on a tour of some of the more advanced features of R with examples that have a Cryptocurrency and Steem flavour. I will also take you on a tour of the steemR package. We will learn how to install that in the next lesson!
Curriculum
For a complete list of the lessons in this course you can find them on github. Feel free to reuse these tutorials but if you like what you see please don't forget to star me on github and upvote this post.
Thank you for reading. I write on Steemit about Blockchain, Cryptocurrency and Travel.
R logo source: https://www.r-project.org/logo/
Hey @eroche
Thanks for contributing on Utopian.
We’re already looking forward to your next contribution!
Contributing on Utopian
Learn how to contribute on our website or by watching this tutorial on Youtube.
Want to chat? Join us on Discord https://discord.gg/h52nFrV.
Vote for Utopian Witness!
Wow indeed this is a little too far already for me to fully understand but it is still interesting and I feel this will be an knowledgeable series for those wanting to know more, good work @eroche utopia approves.
Oh, this series will be great.
Hello. What program language I must learn to see inside Steem?
In this series you will learn to use R but there are packages for all the popular programming languages.
For more info the official dev portal is
https://developers.steem.io/
Thank you. I will try to understand it. It interesting for me. But I haven't enough knowledge 😀💚😎😐
Really awesome series, and Thank You for introduce with R and share Key benefits of using R.
Is this an automated comment?
I am learning data science with python. Great that now we got open source contributer on R too. Thank you for the series. It would be of great help to those who are learning data anlaysis. For me personally, I can now compare and learn R and Python for data science.
I am learning data science with python. Great that now we got open source contributer on R too. Thank you for the series. It would be of great help to those who are learning data anlaysis. For me personally, I can now compare and learn R and Python for data science.
Python is an excellent tool and very much in demand. I would be interested to see how you get on with R if you are following along. How does the experience compare to learning python for data analysis.
For me as a beginner it's always a learning process. As i was introduced to python earlier i feel more comfortable to learn data science with python rather than R. Let's see in future what these both beautiful languages brinngs.
Thank you for your contribution.
Your contribution has been evaluated according to Utopian policies and guidelines, as well as a predefined set of questions pertaining to the category.
To view those questions and the relevant answers related to your post, click here.
Need help? Write a ticket on https://support.utopian.io/.
Chat with us on Discord.
[utopian-moderator]
Need help? Write a ticket on https://support.utopian.io/.
Chat with us on Discord.
[utopian-moderator]
hmm. thanks for the additional knowledge. :)