This report presents data on cryptocurrency and ICO market changes during 2018. Special emphasis has been placed on an analysis of the changes that have taken place during September 2018, including over the past week (September 2-9, 2018).
Information as of September 10, 2018
Professor Dmitrii Kornilov, Doctor of Economics, Member of the Russian Academy of Natural Sciences, and Leading Analyst at ICOBox
Dima Zaitsev, PhD in Economics, Head of International Public Relations and Business Analytics Department Chief at ICOBox
Nick Evdokimov , Co-Founder of ICOBox
Mike Raitsyn , Co-Founder of ICOBox
Anar Babaev , Co-Founder of ICOBox
Daria Generalova, Co-Founder of ICOBox
Cryptocurrency Market Analysis (September 2-9, 2018)
1. General cryptocurrency and digital assets market analysis. Market trends
1.1. General cryptocurrency and digital assets market analysis
1. General cryptocurrency and digital assets market analysis. Market trends
1.1. General cryptocurrency and digital assets market analysis
Table 1.1. Trends in capitalization of the cryptocurrency market and main cryptocurrencies from April 1, 2018, to September 9, 2018


Cryptocurrency market capitalization fell over the analyzed period (September 2-9, 2018), and as of 03:00 UTC equaled $193.2 billion (see Table 1.1). In this regard, bitcoin dominance increased to 55.6%. The market dominance of the four and eight largest cryptocurrencies as of 03:00 UTC on September 9, 2018, equaled 76% and 82.8%, respectively (see Table 1.1).
The drop in cryptocurrency market capitalization compared to the start of the month equaled around $35 billion, including a drop in bitcoin capitalization by $14 billion and altcoin capitalization by $21 billion.
During the period from September 2-9, 2018, cryptocurrency market capitalization fluctuated from $192.1 billion (min) to $240.3 billion (max) (Fig. 1a), i.e. within a range of $48 billion. For its part, bitcoin capitalization fluctuated from $107 billion (min) to $127.4 billion (max), i.e. within a range of $20.4 billion.


Figure 1a. Cryptocurrency market capitalization since September 1, 2018
Figure 1b shows bitcoin capitalization (red line) superimposed on cryptocurrency market capitalization (blue line). The high correlation between the indicators is obvious. This synchronicity has been seen for more than four months already, with a steady growth in bitcoin dominance. Since the start of May, bitcoin dominance has increased from 36% to 55.6%.

Figure 1b. Capitalization of the cryptocurrency market (blue) and bitcoin (red) since September 1, 2018
A clear downward trend can be seen on September 5-6. Capitalization fell by $39 billion over a space of 15 hours (Fig. 1a, 1b).
According to many publications, the report of Business Insider dated September 5 stating that Goldman Sachs was abandoning its plans to trade in cryptocurrencies was the incendiary news that led to this sharp drop. This “fake news,” as it turned out to be, managed to trigger a market collapse over these two days (Goldman Sachs назвал «фейком» новость об отказе от крипто-подразделения). Some major altcoins, including Ethereum, hit new record lows for the year (see the news in Tables 1.4, 1.6). Despite the denial of this report on September 7, capitalization did not recover. In fact, in the evening of September 8 there was another market plunge, with capitalization plummeting by another $8 billion (Fig. 1a, 1b).
The rise and fall of cryptocurrency prices over the past seven days (September 2-9, 2018)
Last week’s leaders from among the top 500 cryptocurrencies by capitalization that showed the largest growth were the projects BitcoinDark (+255.5%) and Digitex Futures (+96%). The growth of Lympo (+83.15%), Niobium Coin (+66.05%), Cosmo Coin (+56.65%), and Holo (+43.87%) should also be noted.
During the period from September 2-9, 2018, the change in the prices of cryptocurrencies in the top 500 ranged from -68.9% (ETERNAL TOKEN) to +255.5% (BitcoinDark). The price of the BitcoinDark cryptocurrency (BTCD), created in 2014, which previously positioned itself as an improved alternative to bitcoin, showed a growth of 255% over the week against the backdrop of increased trading volume. As reported by forklog, in 2018 the creators of BitcoinDark turned their attention to the development of the Komodo (KMD) cryptocurrency. After BTCD was left without the support of its creators, asset holders received the right to exchange the coins for KMD until mid-January 2018.
Eternal Token, on the other hand, showed the worst price dynamics. The price of this token has been falling for the entire month since it was listed on an exchange on August 10, with the negative trend being exacerbated by the pessimistic mood of the market.
The price of 40 cryptocurrencies and digital assets from the top 500 showed growth, including 4 from the top 100.
Over the past week the number of cryptocurrencies with a capitalization of more than $1 billion remained the same at 15, with the price of all of them decreasing except Tether (the price of which is tied to the US dollar).
The coins and tokens from the top 200 that demonstrated the largest price growth are given in Fig. 2.
Biggest gainers and losers over the week (September 2-9, 2018)
The prices of some cryptocurrencies may fluctuate from -50% to +50% over the course of a single day. Therefore, when analyzing cryptocurrency price trends, it is advisable to use their average daily amounts on various cryptoexchanges.
Below we consider the 10 cryptocurrencies that demonstrated the most significant change in price over the past week (Fig. 2-3). In this regard, only those coins and tokens included in the top 200 (Fig. 2) and top 100 (Fig. 3) by market capitalization were considered2.
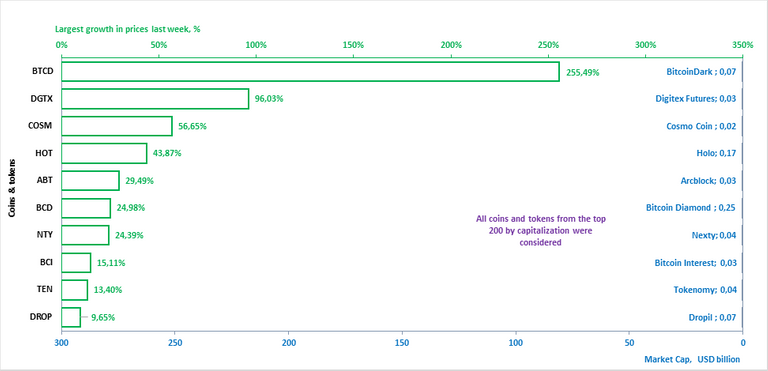

Figure 2. Largest growth in prices over the past week
Tables 1.2 and 1.3 show the possible factors or events that might have influenced the fluctuation in prices for certain cryptocurrencies. Table 1.4 shows the possible factors or events that might have influenced the cryptocurrency market in general.
Table 1.2. Factors or events that might have led to a growth in cryptocurrency prices over the past week

A depreciation in price was seen last week for 460 coins and tokens from the top 500 cryptocurrencies and digital assets by capitalization. The ten crypto assets from the top 100 that experienced the most noticeable drops in price are shown in Fig. 3 and Table 1.3.
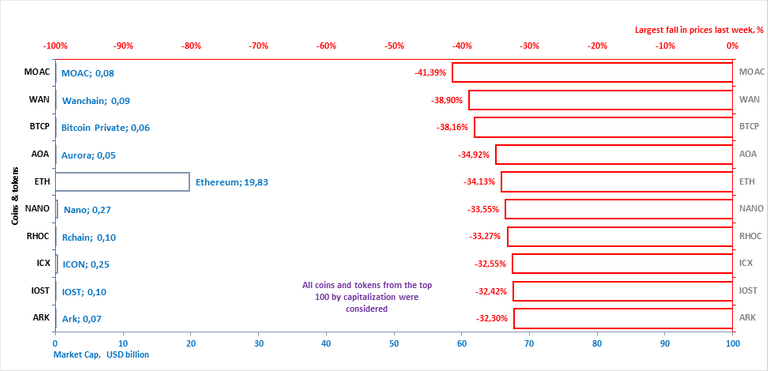
Figure 3. Largest fall in prices over the past week
Table 1.3. Factors or events that might have led to a fall in cryptocurrency prices over the past week


Last week Ethereum was among the 10 coins and tokens that demonstrated the most significant fall in price (Fig. 3). As Business Insider writes, according to Wall Street analyst and co-founder of Fundstrat Global Advisors Tom Lee the launch of Ethereum futures might not only lead to a fall in the price of the second largest cryptocurrency by capitalization, but might also have a positive impact on its main competitor, bitcoin.
Table 1.4 shows events that took place from September 3-9, 2018, that had an impact on both the prices of the dominant cryptocurrencies and the market in general, with an indication of their nature and type of impact.
Table 1.4. Key events of the week having an influence on cryptocurrency prices, September 3-9, 2018

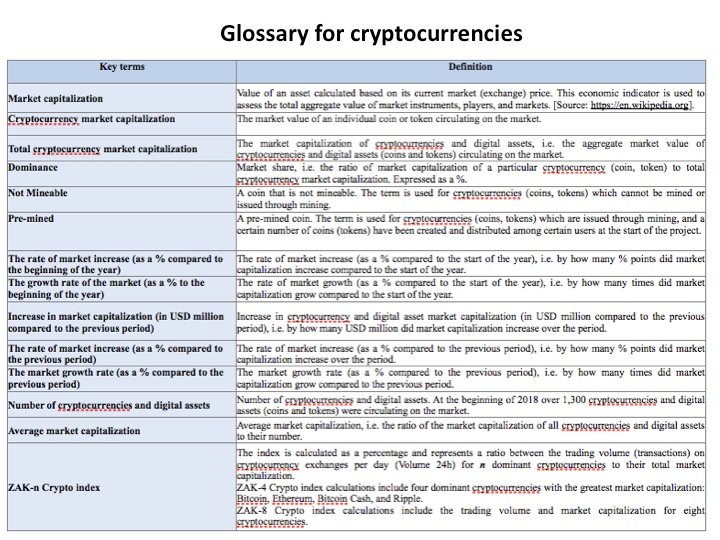
To analyze trading activity on cryptocurrency exchanges, the ZAK-n Crypto index is calculated (see the Glossary). The values of the ZAK-4 Crypto and ZAK-8 Crypto indices are presented in Tables 1.1, 1.5.a, and 1.5.b. In September the 24-hour trading volumes (Volume 24h) for the four dominant cryptocurrencies (Bitcoin, Ethereum, Bitcoin Cash, Ripple) equaled from $5.7 billion to $9.1 billion (Table 1.5.a). The value of the daily ZAK-4 Crypto ranged from 3.4% to 5.2% of capitalization. The highest trading volume was seen on September 5-6.
Table 1.5.a. Daily ZAK-4 Crypto index calculation (from September 1-9, 2018)

By the end of the week the 24-hour trading volumes (Volume 24h) for the eight dominant cryptocurrencies not including Tether (Bitcoin, Ethereum, Bitcoin Cash, Ripple, Litecoin, Stellar, EOS, and Cardano) equaled $6.7 billion (Table 1.5.b), or 4.2% of their market capitalization. The ZAK-4 Crypto and ZAK-8 Crypto indices are considered in more detail in Tables 1.5.a and 1.5.b.
Table 1.5.b. Daily ZAK-8 Crypto index calculation (continuation of Table 1.5.а)

Table 1.6 gives a list of events, information on which appeared last week, which could impact both the prices of specific cryptocurrencies and the market in general.
Table 1.6. Events that could have an influence on cryptocurrency prices in the future

1.2. Market trends
The weekly cryptocurrency and digital asset market trends from December 31, 2017, to September 9, 2018, are presented as graphs (Fig. 1.1-1.5).
Table 1.7. Legends and descriptions of the graphs

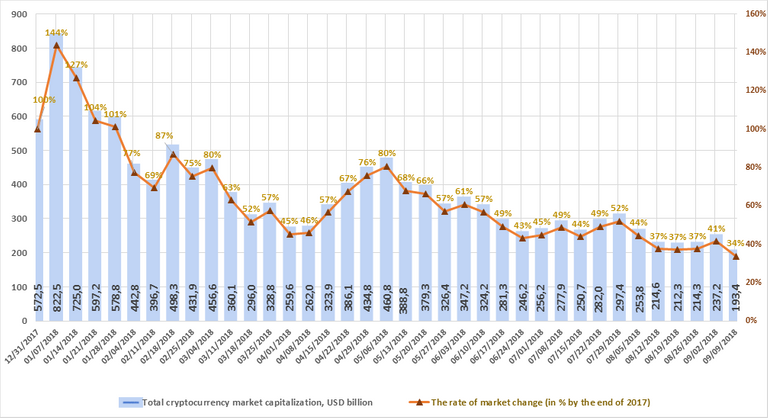

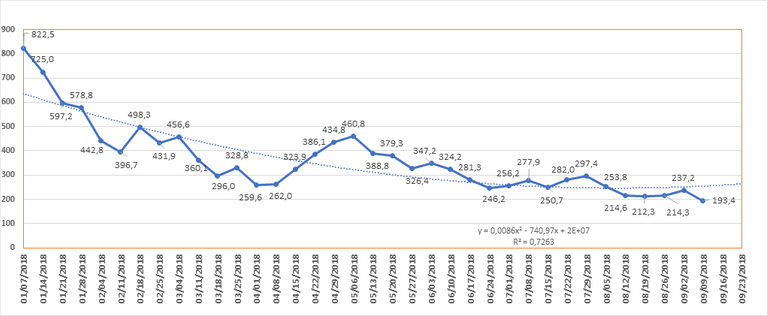
Figure 1.1. Total cryptocurrency market capitalization
Figure 1.1 shows a graph of the weekly cryptocurrency market change from December 31, 2017, to September 9, 2018. Over this period, market capitalization dropped from $572.5 billion to $193.4 billion, i.e. by 67%. Last week (September 2-9, 2018) cryptocurrency market capitalization fell from $237.2 billion to $193.4 billion (as of September 9, 2018, based on the average daily figures from coinmarketcap.com).
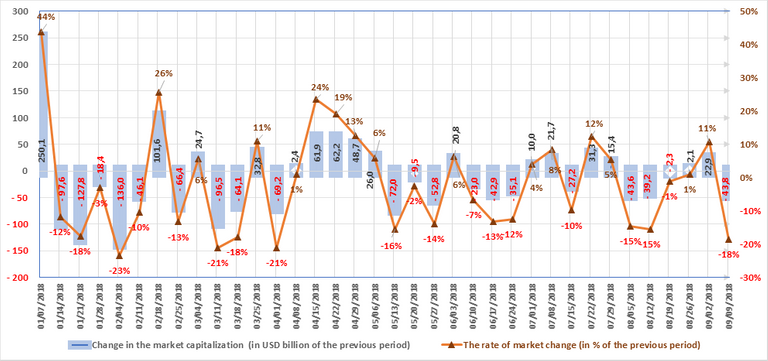
Figure 1.2. Change in market capitalization
The market is susceptible to sudden and drastic fluctuations. Nine of the thirteen weeks in the first quarter of 2018 were “in the red,” i.e. capitalization fell based on the results of each of these weeks, and the weekly fluctuations ranged from USD -136 billion to USD +250 billion.
Six of the thirteen weeks in the second quarter were “in the red.” The market grew based on the results of the other seven weeks. As noted earlier, a growth was seen in April, while in May and June there was generally a reduction in capitalization. The weekly fluctuations ranged from USD -72 billion to USD +62.2 billion.
Five of the past ten weeks of the third quarter saw an increase in capitalization, and five a decrease (with due account of average daily data of coinmarketcap.com, see Fig. 1.2). In July there was an increase of $20 billion, but August saw a decrease of $49 billion. On the whole, since early September capitalization has fallen by approximately $35 billion.
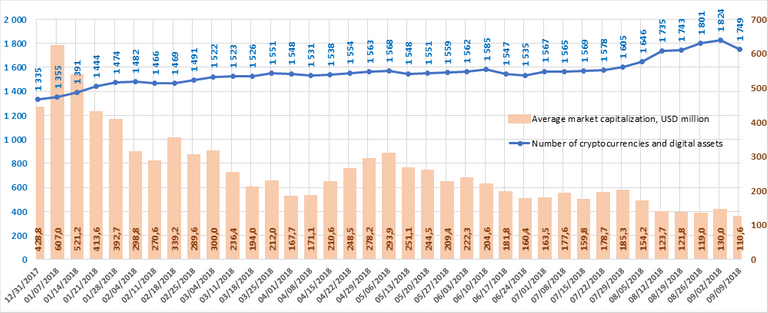

Figure 1.3. Number of cryptocurrencies and digital assets
Since December 31, 2017, the total number of cryptocurrencies and digital assets presented on coinmarketcap has increased from 1,335 to 1,926. However, when calculating cryptocurrency market capitalization only those coins and tokens on which there is information on trades (trading volume) are taken into consideration. Over the past week their number decreased from 1,824 to 1749, while average capitalization decreased to $110.6 million. In total, over the past month 113 new coins and tokens have appeared on coinmarketcap.com. However, it should be noted that a number of other coins and tokens were also excluded from the list. Among the tokens that were added to coinmarketcap.com last week, AiLink Token and ShineChain showed high trading volumes.
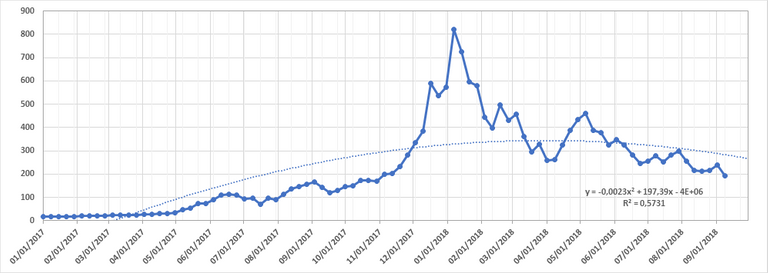
Figures 1.4 and 1.5. Forecast of total cryptocurrency market capitalization
The movement toward the standardization of regulatory documents for the cryptocurrency industry and the rules for holding ICOs within the European Union could significantly reduce the risks for all participants by increasing the transparency of interactions and a lessening of uncertainty with respect to cryptocurrency startups.
The experts of the Belgian research center Bruegel have prepared a report that, according to a story in Reuters, was supposed to be presented at an informal meeting of EU ministers of finance on September 7-8 in Vienna. The report could become the basis for the standardization process within the EU.
At the same time, the EU’s new rules on money laundering may increase the number of audits on cryptoexchange platforms, the users of which will have to undergo mandatory verification. For example, on September 4 the popular instant digital cryptocurrency exchange platform ShapeShift already launched a membership program (“loyalty program”) that stipulates the collection of personal data, which may become a mandatory condition. That being said, an indisputable restriction on regulatory processes is the decentralized nature of the crypto market.
Ultimately, it must be admitted that the approval of rules and regulations could have both a positive and a negative effect on the crypto industry. Back in April the European Parliament approved a set of new measures in the fight with money laundering in the countries of the European Union, including a strengthening of control over bitcoin and other cryptocurrencies. The EU member states were given 18 months to introduce the new rules into their national legislative frameworks.
ICO Market Analysis (September 3-9, 2018)
1. General analysis of the ICO market (by week, month)
1.1. Brief overview of ICO market trends
1. General analysis of the ICO market (by week, month)
1.1. Brief overview of ICO market trends
Table 1.1. Brief ICO market overview, key events, news for the past week (September 3-9, 2018)

Table 1.2 shows the development trends on the ICO market since the start of May 2018. Only popular and/or successfully completed ICOs (i.e. ICOs which managed to collect the minimum declared amount of funds) and/or ICOs listed on exchanges were considered.
Table 1.2. Aggregated trends and performance indicators of past (completed) ICOs1,2,3


The data for the previous period have been adjusted to account for the appearance of more complete information on past ICOs. Over the past week (September 1-9, 2018) the amount of funds collected via ICOs equaled $78 million. This amount consists of the results of 12 ICOs, with the largest amount of funds collected equaling $21 million by the You42 ICO. The average collected funds per ICO project equaled $6.5 million (see Tables 1.2, 1.3). A total of more than 40 ICOs were completed last week. However, not all projects indicate the amount of funds collected on their official websites (Table 1.5).
Table 1.3. Amount of funds collected and number of ICOs


Table 1.3 shows that the largest amount of funds was collected via ICOs in March 2018, mainly due to the appearance of major ICOs. The highest average collected funds per ICO was also seen in March 2018.
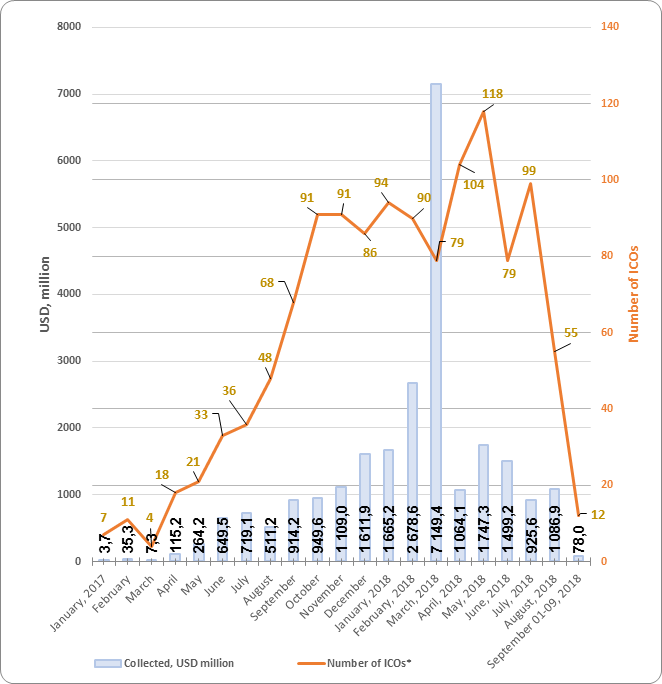
Figure 1.1. Trends in funds collected and number of ICOs since the start of 2017
1.2. Top ICOs since the start of the month
Table 1.4. Top 10 ICOs by the amount of funds collected (September 1-9, 2018)


The data for the previous period (September 1-9, 2018) may be adjusted as information on the amounts of collected funds by completed ICOs is finalized.
Last week’s leader was the You42 project. You42 is a social and entertainment platform oriented on management of content with public access. The You42 platform combines games, music, video, sports and other news, and much more, providing users with everything they want in one centralized social space. You42 unites content creators and users, providing authors with a new way to monetize and rewards and incentives to users. Unlike other social platforms, You42 allows users to rate their own experience based on their own interests and rewards them for listening to, watching, commenting on and/or sharing content using tokens and experience points (i.e. the platform has been built around a cryptocurrency ecosystem where recording labels, studios, artists, authors, and creators of any type can interact with fans and monetize their work to the maximum degree possible).
Figure 1.2 shows the top 10 ICOs.
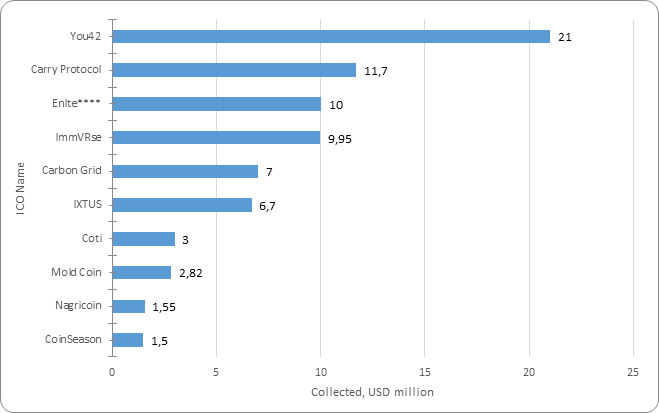
Figure 1.2. Top 10 ICOs by the amount of funds collected (September 1-9, 2018)
1.3. Top ICOs in the Content Management category
The list of top ICOs by category is compiled with due account of the categories of the leading ICOs for the week. The You42 project was among the 10 largest projects in the Content Management category by the amount of funds collected via ICO (Table 1.5).
Table 1.5. Top 10 ICOs by the amount of funds collected, Content Management category


The presented projects from the top 10 in the Content Management category currently have low token performance indicators ranging from 0.07x to 0.24x.
For example, the DxChain project has a current token price к token sale price of 0.24x, i.e. its price is four times lower than during the ICO. However, it should be remembered that this project completed its ICO in early August 2018, and over this same period the capitalization of the cryptocurrency market as a whole has fallen by approximately 30%.
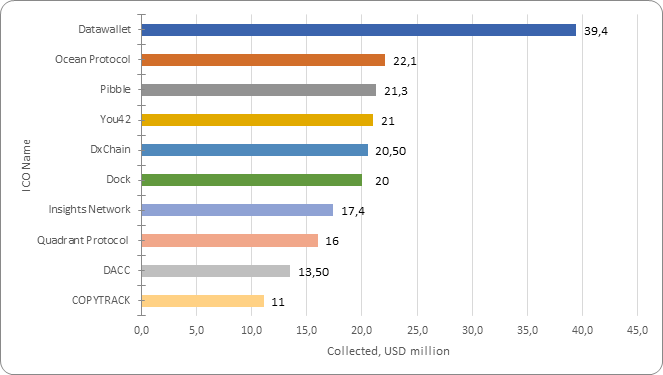
Figure 1.3. Top 10 ICOs by the amount of funds collected, Content Management category
During the analyzed period (September 1-9, 2018) more than 40 ICO projects were completed, and at least 12 projects have clearly indicated the amount of funds collected on their websites and this amount exceeds $100,000. The total amount of funds collected equaled more than $78 million. Last week’s leader was the You42 project. The total amount of funds collected by a number of ICOs failed to reach even $100,000 (the information for some projects is still being finalized). A clear trend is being seen toward a fall in the amount of funds collected via ICOs, which is directly related to the fall in cryptocurrency market capitalization since the start of 2018.
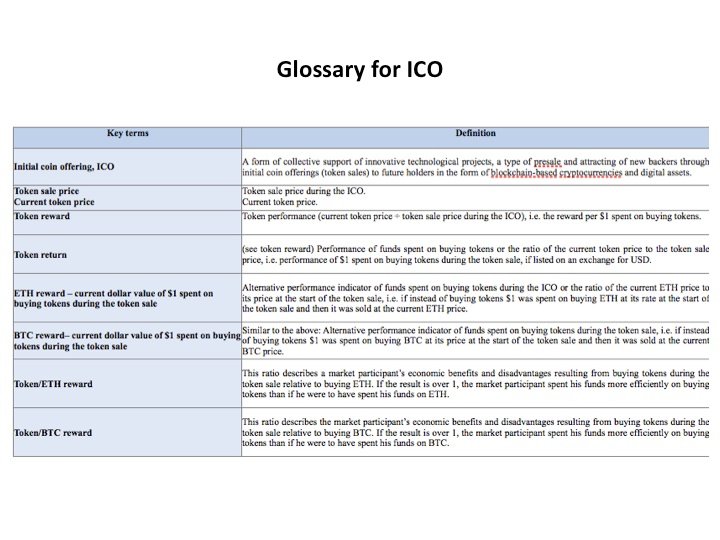
The Glossary is given in the Annex.
Annex
Glossary