Bitcoin’s (BTC) bears would be put on the
back foot if prices climb past key
resistance lined up at $4,140.
The leading cryptocurrency jumped to a
two-week high of $4,090 earlier today, as
expected, ending a weeklong period of
low volume consolidation near $3,800.
Notably, the break above $4,000 has
added further credence to the short-term
bearish-to-bullish trend change signaled
by the three-day chart on Dec. 20.
The job, however, is only half done for
bulls, as prices are yet to take out the
resistance at $4,140 – the neckline of the
inverse head-and-shoulders bullish
reversal pattern. A convincing break
above that level would put the bulls back
into the driver’s seat.
That said, a longer-term bullish reversal
would be confirmed only above the former
support -turned-resistance of the 21-month
exponential moving average (EMA) of
$5,567.
As of writing, BTC is changing hands at
$4,000 on Bitstamp, representing a 5
percent gain on a 24-hour basis.
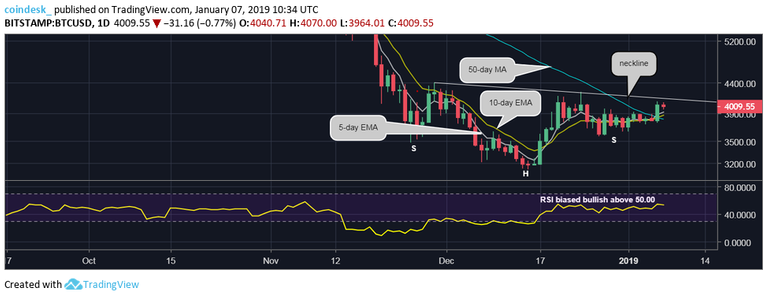
Daily chart
As seen above, BTC has charted an
inverse head-and-shoulders pattern,
which represents a transition from the
bear market to the bull market – a low
followed by recovery (left shoulder), a
bearish-lower low and recovery (head),
and finally a bullish-higher low and
recovery (right shoulder).
A breakout from an inverse head-and-
shoulders usually yields a powerful move
to the upside. BTC, therefore, could rise
well above $5,000 (target as per the
measured move method) if the neckline
resistance, currently seen at $4,140, is
crossed on the back of high trading
volumes.
Further, the cryptocurrency has found
acceptance above the 50-day moving
average (MA) hurdle, while the 5- and 10-
day MAs are trending north, indicating a
bullish setup. The 14-day relative
strength index (RSI) is also biased
toward the bulls.
Hence, prospects of a bull breakout above
$4,140 appear high.
Monthly chart
On the monthly chart, the outlook remains
bearish while BTC is trading below the
21-month EMA of $5,567. Interestingly,
the trendline connecting the December
2017 and November 2017 highs is also
located near the 21-month EMA.
Forcing a long-run breakout, therefore, is
going to be an uphill task for the bulls –
more so, as both the 5- and 10-month
EMAs are still trending south, indicating
a bearish setup. As a result, these
averages – currently are located at $4,791
and $5,651, respectively – could work as
stiff resistance levels.
View
An inverse head-and-shoulders
breakout, if confirmed, would
signal a major bullish reversal
and could yield a quick move to
the psychological hurdle of
$5,000.
A break above the 21-month
EMA of $5,567 could see in a
long-run bullish breakout.
Failure to take out the neckline
resistance of $4,140, if followed
- by a break below $3,566 (low of
the right shoulder), will likely
embolden the bears and allow
re-test of the recent low of $3,122
Posted using Partiko Android