I haven't been posting about Hive price in quite a while so today I felt like taking a look at my Python code to see how the different charts were looking
Here's the data at the present time.
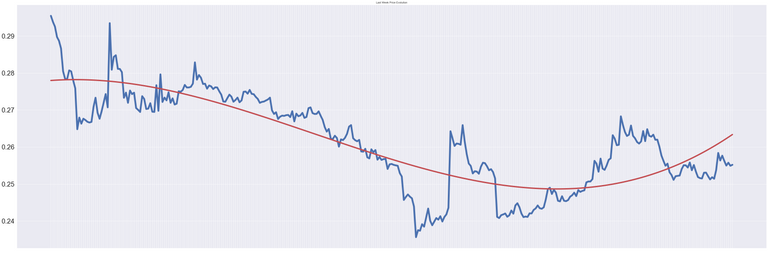
Current price: 0.2557 USD
Ath price: 0.9705 USD
Ath date: 2020-04-27 at 00:38:45
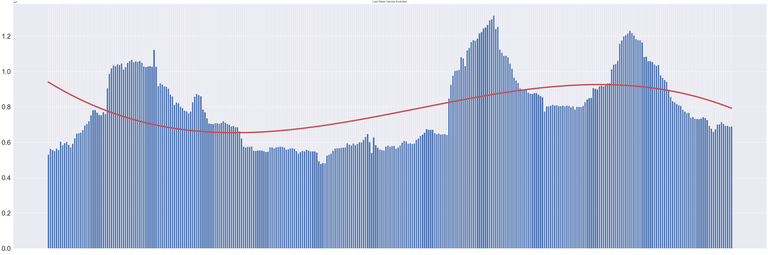
Volume: 6925946.00 USD
Still, the same ATH from the end of April right after Huobi decided to offer Hive in its trading platform. I have the feeling it will take a while until that high is exceeded but it will all depend on how BTC does in the coming months.
Charts show data from the past 14 days. You can see how the price was down-trending until a few days ago. The trendline shows a possible bottom but we need to see how the price evolves next week
The volume chart seems to be ranging between 6M and 12M USD. I do not expect big changes there unless some unexpected events happen.
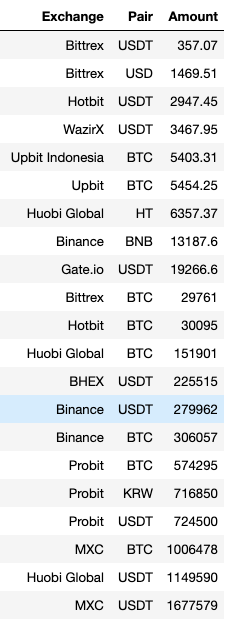
A few more options keep adding to the list of exchanges/pairs and MCX/USDT has reached to top volume position.
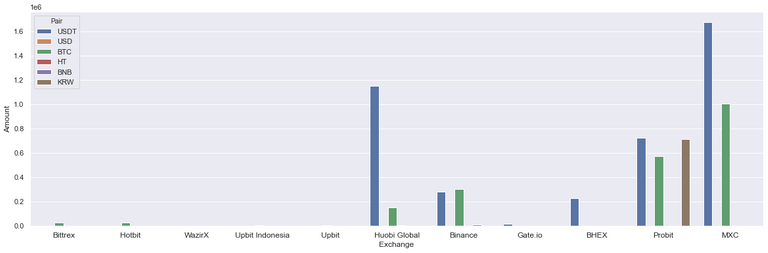
The histogram shows a balanced graph with higher bars on the lower volume scale. The bubble chart now clearly shows how MCX USDT has the biggest bubble with Huobi USDT as the second but if we consider total exchange volume we might see Probit as the leading one.
| Volume Histogram | Volume Bubble Graph |
|---|---|
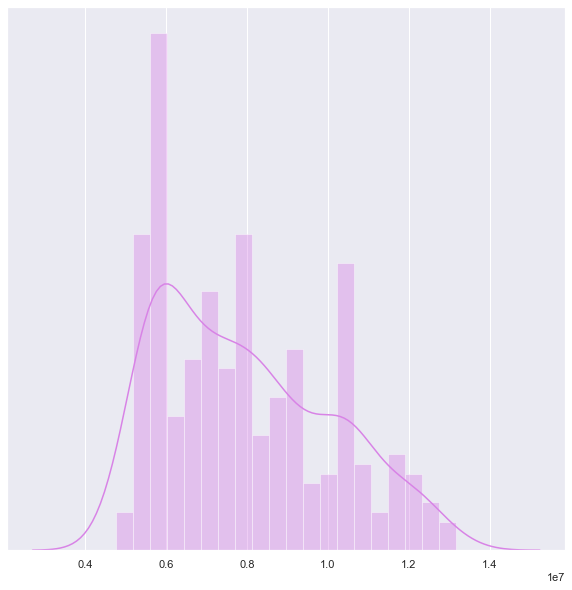 | 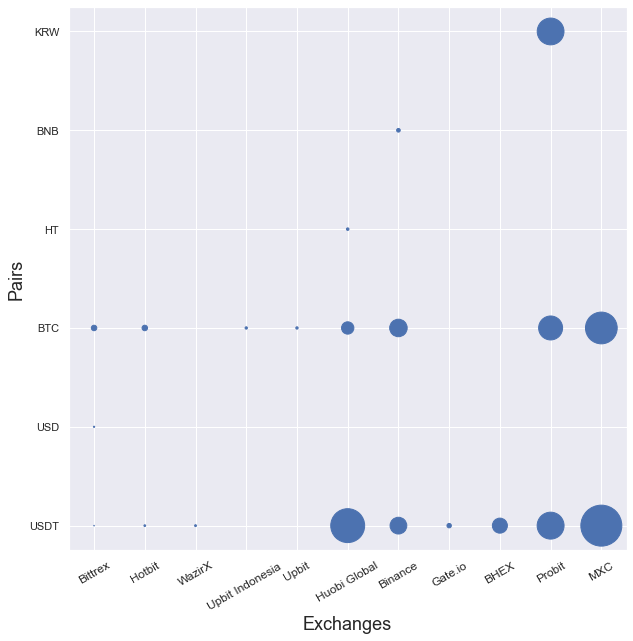 |
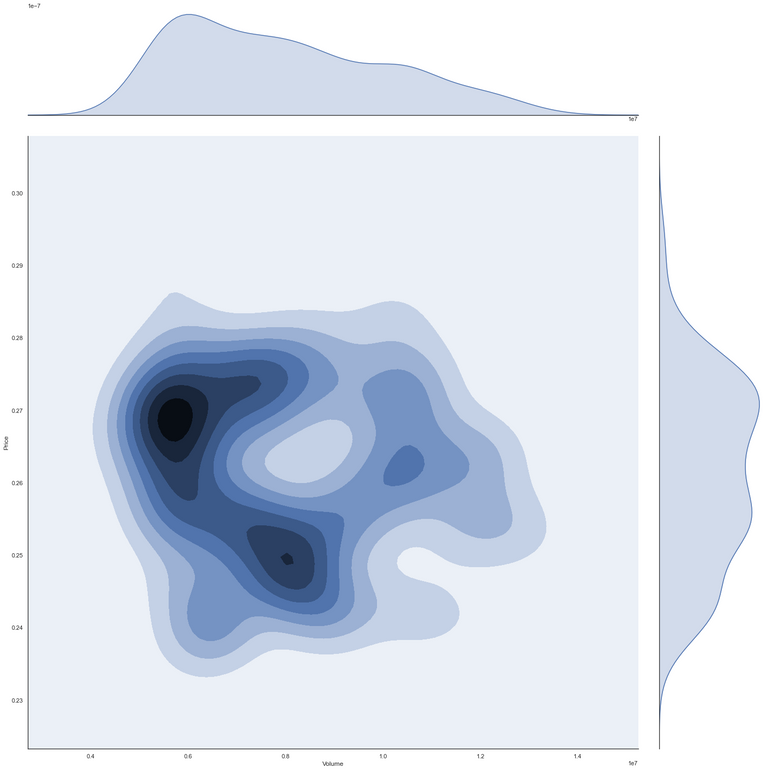
The density plot looks quite interesting. Data is spread all over with the denser left side areas. If the market manages to keep up-trending we should see that graph getting more color on the right side.
Density Plot
Data extracted from Coingecko