Nearly 300,000 words!
Just started exploring it, love being able to look at posts by readability levels. Makes it really easy to start developing collections as well. It has been such a pain in the past trying to find a post I wrote years ago and scrolling through years and years of posts. With the index, it's very easy to flick through and hop over all those inconsequential or time-limited posts.
It's great as it is, and a couple of things occurred to me:
- Being able to select posts by time period.
- When you're viewing search results, being able to select which ones you want to export (or maybe search further). For example, I would weed out a lot of time-limited posts.
On the recent posts to the handwritten community where I'm writing with a specific purpose (as opposed to throwing up a blog), I've been tracking engagement - page views, unique page views, average time (using peakd's dash board) - but also, manually, exploring things like how many comments in how many conversations and length of comments. I guess using something like the readability scores for comments would also give an indication about the depth/level of engagement? Were commenters engaging with complex ideas, for example, so there was some indication of how comments were extending ideas, sharing learning (and any other assumptions).
I've been thinking a lot about tag strategy/architecture so that it is easy for readers of a specific blog to find other similar posts in the back catalogue. So as part of engagement, it might interesting to view which tags/combinations of tags are getting responses in terms of views/comments etc.
I haven't used tags on comments (yet), but that would be interesting, too, especially for engagement.
Which brings me to another thought: I've had quite long periods when I haven't published a post, but I have published quite long (maybe 200 words) comments.
Anyway, these are all laters, but I thought it might be helpful to let you have some of the ideas that I've been pre-occupied with, as I've thinking about the new outward facing blogs that I'm setting up.
Firstly, your comment deserves a vote from @topcomment
This was something I struggled with too, so I made a gosh darn tool!
I will see what I can do. I could add another row of buttons, I suppose, to collection of posts at the bottom - another alternative is to just download the CSV, load it into your favored spreadsheet application, and filter by date. I don't want to build a spreadsheet application in a browser! It is probably better to do it offline, as you'll always have access. :P
It doesn't look like tag data is the in the response to the API endpoint I am querying, so I would need to go elsewhere and start to keep a database (not something I want to do) if we looked at tags.
There are way too many garbage comments on chain (not yours) - and I don't want to go diving too deeply into those at this stage as the data involved would be enormous given this tool's "quick and dirty" build!
I am going to look at building some stuff (with the help of LLM) to do with how I can derive an engagement score based on comments and complexity of the post.
Yeah, I appreciate the drudgery!
Sounds fabulous!
Take another look now. I hope what I added is what you were trying to communicate to me. :)
They look very pretty, thank you :)
Here's the summary feedback I got from an LLM:
Very helpful from a writer perspective.
What I find helpful from my writing perspective is self-flagellating by giving myself awful feedback :P
And never truly finishing my ideas, or polishing them. But I do have a large back catalogue of content on hive, and digging through it is so difficult with the standard front ends, so that was the main motivator for pulling this all together and stitching code snippets from different places together.
Combined with my professional experience in analytics and natural language processing, and handling data, it felt natural to elaborate on the basic functionality I wanted.
And the underlying reason why:
(being forced to join Medium by a lovely lady at my writing group) - I've made 36 cents there from two articles... lol (but they were on hive first, and forever!)
😂 It takes all sorts!
I've just done comparison of three comparable bloggers in terms of content. I left outliers like @slobberchops (high image count, high engagement) and @bozz (consistent high-quality extended posts with strong engagement) and turned to more mundane, although not common, bloggers. I'll post it later when the infographics have worked themselves out.
Are there any features or functions broken in the tool currently? If you can let me know, I'll put it on the list of things I'll try to get done tomorrow. I want the tool to be functional and clear.
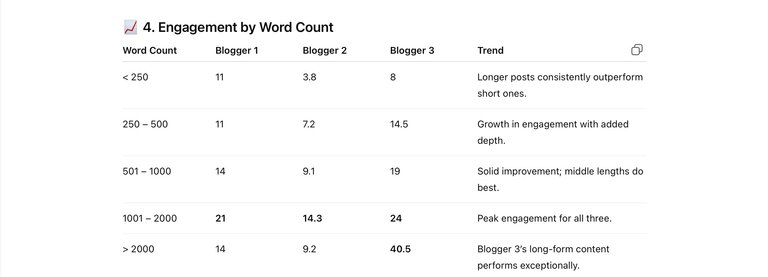
Generated using data from Hive Report Card submitted to ChatGPT, bloggers selected by me.
1. Readability Distribution


3. Engagement by Readability
Probably nothing you didn't already know 😁
I think engagement depends on who the author is to some extent, but even in my own report, engagement varies depending on my content complexity and length.
Regarding engagement, is the chart tracking comments I receive, or comments I make? My assumption is that it's my comments, as I have rarely seen anyone else leave >2000 word comments, and there's more than a dozen of those.
Also, it is a bit difficult for my ancient eyes to clearly see the razor thin blue lines in the chart of word and pic counts. Is it possible to choose say, yellow, or could that be possible without busting your chops? The colors you have chosen do create a pleasant palette, but with as many posts as you have made in 8 years, I simply can not clearly see the blue in the mix of gray background and green lines. Mine is but half of yours, but still is very indistinct to my failing vision.
It is tracking the "children" of your posts, so comments that are written by others, to you, on your posts.
I plan on doing a weekly, monthly, yearly aggregations as well as keeping the daily chart. I should have implemented that from the start, it is one of the first things my previous corporate overlords would have asked for.
That way it will be far less bars - I will also see if I can get the LLM to help me implement an option to zoom in / out on the chart for better (hah!) readability.
Apologies I missed your remarks, I received a lot of replies and suggestions for this tool, which I am working on currently :)
I have a list, I will work through it, and I will report back with a new post for those that are interested with the new features, as there are likely to be mean more usability features introduced.
Then version three will probably be a clean up and segregation of the code into multiple files instead of one monolithic block as it currently is. This comment likely forms the bulk of my new post on the topic, just without the features listed. Using it as a thinking space.
Thank you.
Your reply is upvoted by @topcomment; a manual curation service that rewards meaningful and engaging comments.
More Info - Support us! - Reports - Discord Channel