Bitcoin: The Volume Problem
Cryptofam, we have a problem. It is a problem I keep bringing up because I continue to see talk of a "bull market" and a "rally" either already happening or just on the horizon. I "predicted" before this most recent dip that the market was about to crash back down. You can read those posts: Here, Here, And Here
Yeah, I was right, but there's a reason I could see this and so many others out there for some reason could not. Volume. In my first trading related post entitled, Why This Is Not A Bull Market, At Least Not Yet (Here), I broke down the details of total market cap, total market volume, Bitcoin's market value, and so on. If you haven't read it, do so after finishing this one and it will make much more sense. Let's back up and go over a few things.
Note: For all images, right click + open in new tab to have a better view. Also, this isn’t financial advice.
The Setup
So, there we were bumping up against $11,700 BTC. Technical analysts across the board were calling a bull run, and some like myself, the minority, were constantly trying to warn people not to listen. We were accused of spreading FUD, called morons, etc., BUT we weren't wrong. Suddenly, Bitcoin failed to break resistance and plunged down to the $10k range. Those same bullish people began looking for reasons to justify the "minor correction". Well, again people like myself kept warning everyone. Then, BAM we fall again into the $9k range. Those same people, yet again, begin looking for reasons to justify the fall. They start calling another bull rally based on this and that. Again, they were wrong. As I write this, Bitcoin is falling through $9k. Why is this happening? Well for a few reasons.
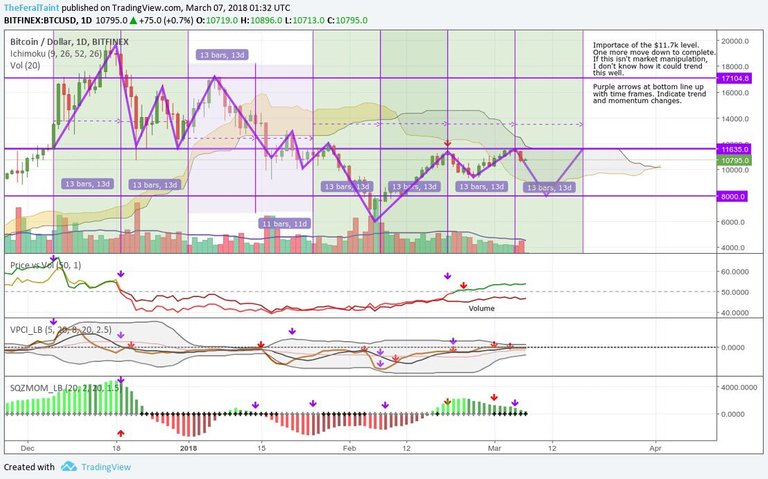
13 Day Cycles
I recently noticed that from $6,000 BTC forward, we had been moving in 13 day cycles up and down. All of these moves matched up with a couple of volume/momentum indicators I use. I started looking back, and I noticed that these Cycles have been going on at least since we broke $11.7k for the first time last year. Below, I've laid out these cycles and their corresponding trend. The obvious next move looking at this chart is to fall to...wait for it.....$8k. Remember how I said my analysis is sometimes "unconventional"? Well yep, but it works sometimes. You can also see how important $11.7 k actually is. All of the constant talk about $10k is pure nonsense. We had trouble moving past it this time because money was just moving from Bitcoin to alt pumps and back. When a little bit of new money finally came in, we broke up with ease. As for this being evidence of potential market manipulation, I am going to be writing a separate article on this later.
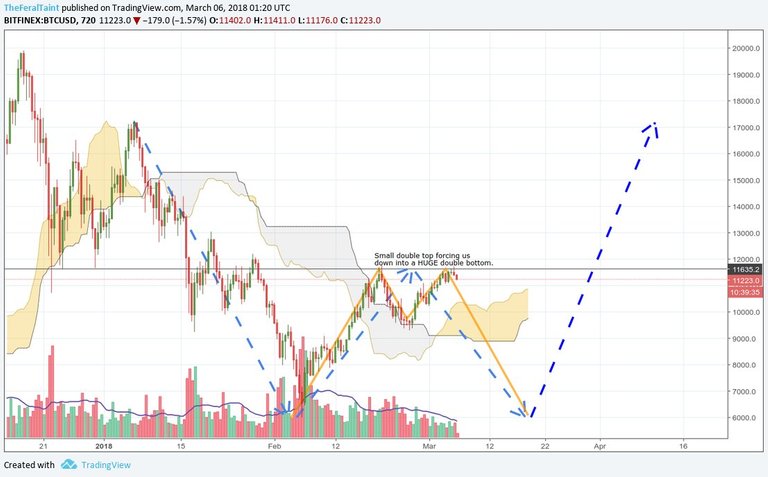
Looking At The Bigger Picture, Literally
The tendency of most, myself included, is to get too bogged down in shorter time frames. Now I never go below an hourly chart, but at one time, I was trading in the 1-15 min time frames. All of that noise makes things difficult to see. When you zoom out, you can clearly see this beauty below. The only issue is that the bottom won't be perfect due to the decrease in volume which we are about to discuss next. Rather than $6000, we shouldn't fall below $8,000, but if the FUD hits, we very well could.
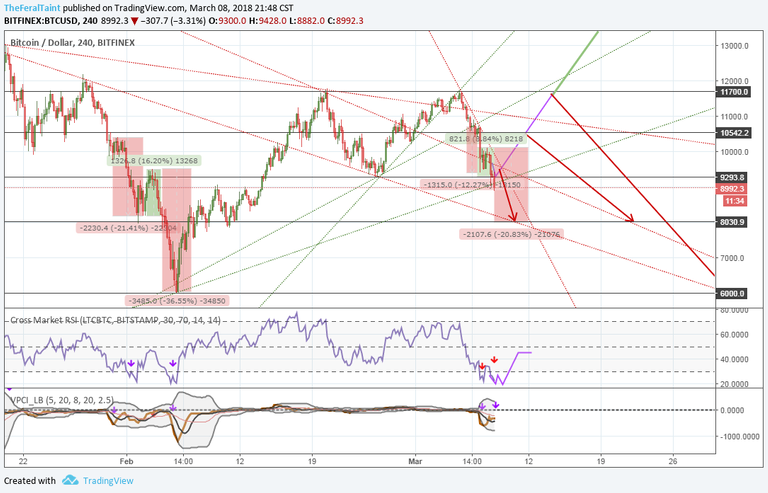
I Really Like Patterns
I use patterns for everything, not just trading crypto. I used patterns to learn music. I used patterns in nursing school to memorize different disease processes. Pattern recognition is part of my clinical skill set in the emergency eoom, and recognizing certain patterns or "glitches in the system" is what helps me detect life threatening conditions quickly. Pretty much, I really like patterns. Well here is a fun pattern. I added an RSI to my indicator setup just because I was curious. It is just added on top of one of my volume/price indicators. It worked out well since the range of that indicator is based on the range of an RSI. I noticed a fun little pattern, and as of writing this, it appears to be playing out. The chart is mostly self explanatory. The purple arrows mark the most recent oversold condition on the RSI and the current oversold condition on the RSI. The formations are almost identical, only that the first one is larger. The same is true on my volume indicator at the bottom. The bands are almost twice as wide on the first oversold condition. Why is that? VOLUME. Volume is lower so the price movement will be lower. For example, you have 20 pennies. You lay them out in a Z shape. Now take away 10 pennies. Make a second Z shape. You can still do it, the Z shape is just half of the size as the first one. This is a pattern repeating itself just on a smaller scale. The same is happening on the chart.
I've marked the drops and increases in price relative to those areas on the RSI in green and red along with percentages in price change. The first larger pattern goes 21-16-37. I then went over and drew the same price movement blocks on the other oversold area where we are now. The pattern is 12-9-21. I'm rounding for simplicity and to account for slight variations. Now for some mind blowing shit: Multiply the first 3 numbers by 0.4 or 40% and subtract that answer from that number. Ex. 21 x 0.4 = 8.4 - 12.6.
Here are the answers: 12.6 - 9.6 - 22.2
This accounts for about a 40% reduction in volume from the previous pattern. Cool right? That puts us at around $8,000 unless something crazy happens. Afterwards, if we continue the pattern, we should see a similar percentage run up to we saw from $6k up. That would put us above $11.7k. Maybe, maybe not.
Pump Up The Volume
Now, for our volume problem. Review the image below and things will make much more sense. The pink area was selected because during this range of price action, $11.7k held as support. It resisted the MASSIVE falls from $20k and $16.5k. Finally, the drop from $17.2k broke us through, but we hovered for a while back and forth before finally falling under and down to the lowest low we had seen a while.
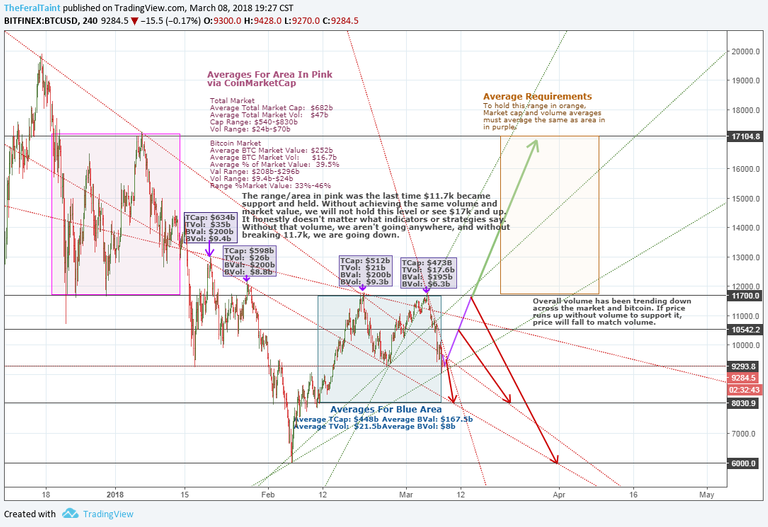
I know there's a lot on this chart to take in, but it is important. The quick version would be to say that volume is trending down and has been. We cannot break to the upside and to all time highs again until volume increases. If you see price drastically increase while volume remains stagnant like it is, that would be from pure market manipulation pushing the price up. It would not be real growth. When we do find support either in the $8k range, or even as low as $6k, we MUST have a volume spike like we did coming up from $6k before. But that volume needs to continue and not drop off. If volume can get over about $40 billion total and over at least $10 billion in the Bitcoin market and stay there on all the way up, when we hit that $11.7k wall, we could break to the upside enough to maintain it. Once there, more money will flow in hopefully and we can move up and test the next few resistance levels. Psychologically speaking, I think if we break and hold this area, that will be a sign of enough strength to push us into a real rally.
Final Thoughts
Well, we are either fucked royally and this drop will hurt the market across the board for a while, OR we will drop, attract new money, and the patterns I've noticed will play out in our favor pushing us above $11.7k. That flip to the upside and finding support there "should" attract investors, and that gives us the volume we need to MEWN--or at least get us up high enough to fail to break the next resistance level. Happy trading.
—TheFeralTaint (CTOM Admin)
FACEBOOK: https://www.facebook.com/CTOMMod/
GROUP: https://www.facebook.com/groups/CTOM1
TELEGRAM: CTOM
TWITTER: @TheFerralTaint
CORRECTION:
FACEBOOK: https://www.facebook.com/CTOMMod/
GROUP: https://www.facebook.com/groups/CTOM1
TELEGRAM: @theferaltaint
TWITTER: @TheFeralTaint