what I learnt from last failure (which cost me 2000 USD in SL!) is to follow the divergence from bigger time frames in to lower time frames.
let me explain:
we see regular negative div in Weekly chart of BTC;
then we have to go to the daily time frame to see its impact;
there you may see a hidden div in the opposite direction. DO NOT judge the div by its timeframe. not necessarily the larger time frame can impose itself to lower one.
anyway, I modified one of my support lines (the up trending black one) and I drew some channels:
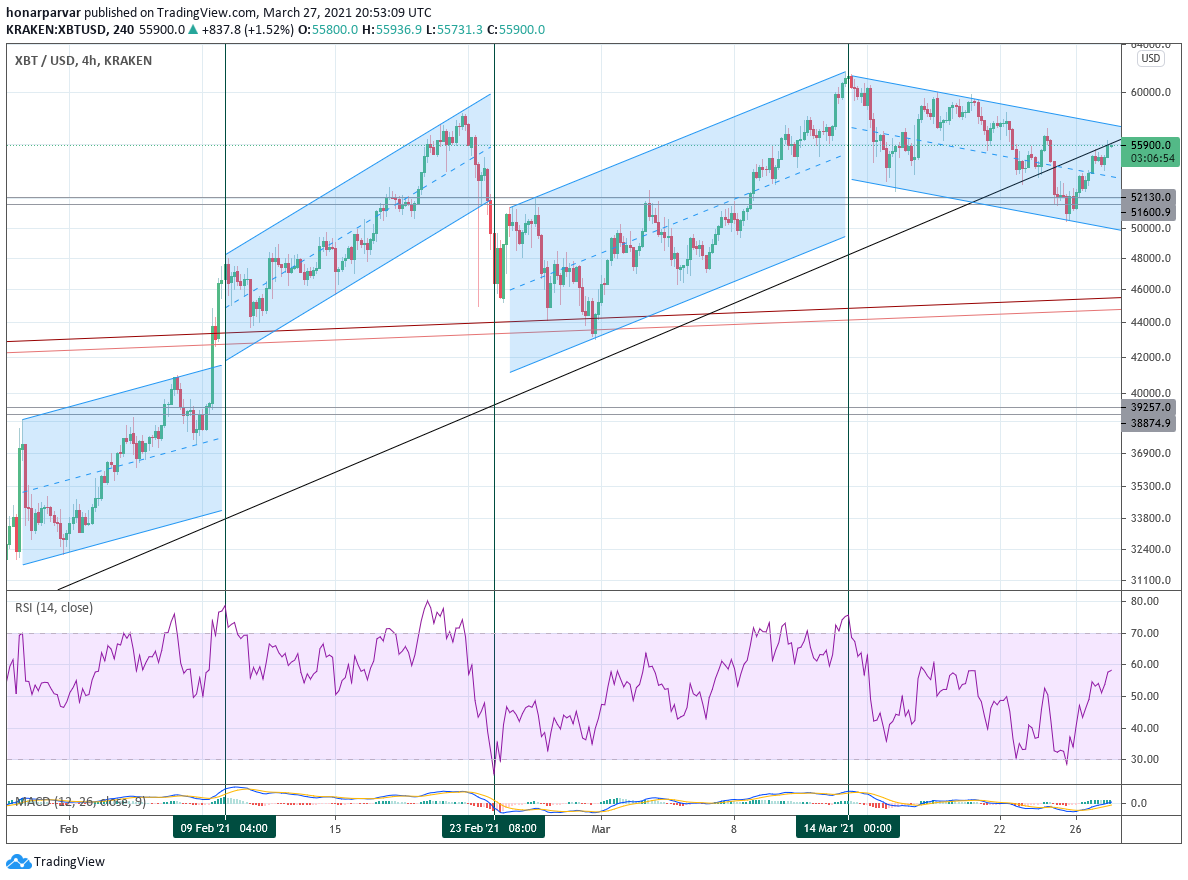
the point is: a channel shift always happen when the RSI is at an extremum point; SO WE ARE NOT YET TOPPED and I shouldn't trigger the SELL position.
next chart:
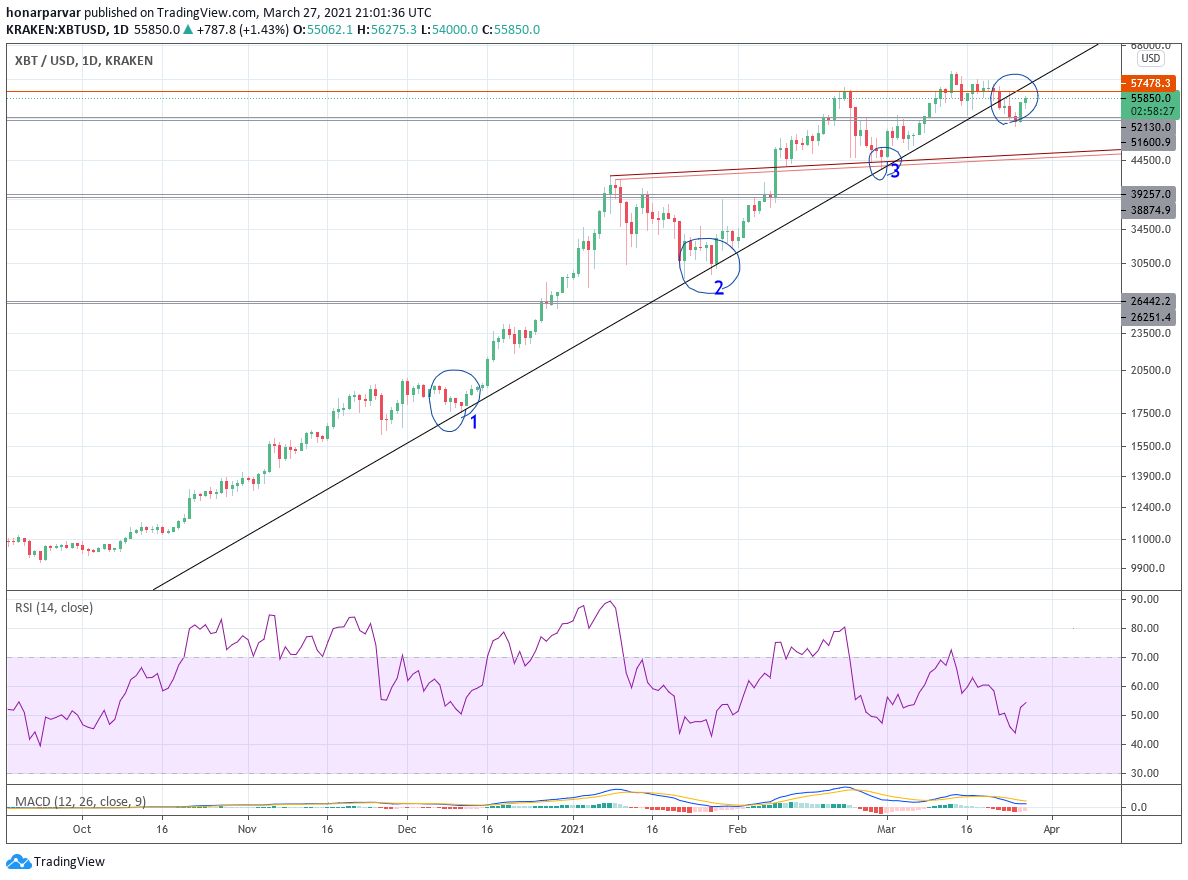
this shows the pullback is not yet filled (with the modified uptrend support)
how the line modified: the point 2 replaced by 3. so we have a more valid candle breaking through the support.
AND
if the price action doesn't exceed the orange line (close of previous top, before ATH) then we can have head and shoulder.
these are mistakes I have made.
now we have to wait for the chart to see how it reacts. I stay aside for now.