BTC/USD settled slightly above $4,000 for the first time since March 20.
Bitcoin has continued to trend higher within an upside channel.
Bitcoin is in the middle of a long bear to a bull transition.
Bitcoin Price Analysis: BTC/USD 4-hour chart
Looking at the 4-hour chart, Bitcoin has continued to trend higher while forming higher highs and higher lows within an upside channel. The initial resistance rests at $4,037, which happens to be Wednesday’s high. The next resistance is formed by the upper line of the rising channel roughly at $4,189.38, which is the high formed in February.
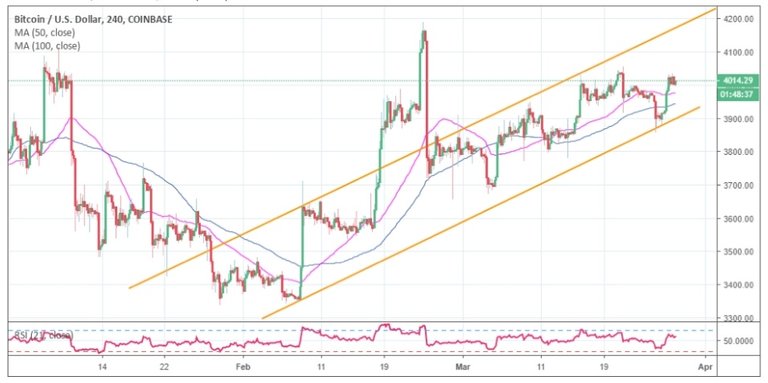
The 4-hour RSI suggests a downside correction
The Relative Strength Index (RSI) on the 4-hour chart is currently changing direction south. A move that hints that bulls are losing their grip and bears could take over. In spite of the higher correction throughout March, the indicator has not been able to rise to the levels of February 19 when Bitcoin achieved highs of $4,189.38.
At press time, the RSI is seen at 56 after being rejected from 64.7. Bitcoin buyers have a task to ensure that the price does not slide below $4,000 otherwise, chances of Bitcoin retesting lower support areas at $3,900 and $3,800 are still quite high. Both the 100 SMA and the 50 SMA currently at $3,974.35 and $3,946.86 in that order will also work as support lines. The channel support is a key level that traders must take into account in the event Bitcoin reverses the trend. Meanwhile, pushing Bitcoin above this week’s high at $4,037 could be a key ingredient in sustaining growth above $4,056.84 (previous week high).
Bitcoin’s long-term outlook is strongly bullish
According to the popular analyst and Bitcoin bull, MagicPoopCannon Bitcoin is in the middle of a long bear to a bull transition. The daily chart indicates that BTC/USD is in a zone that is predominantly resistant.
The 150-day moving average on the same daily chart was initially working as key support during the first stages on a bullish market. However, at present, it has become an indicator of overhead resistance (in the last stages of the extended bear market).
The chart also shows the formation of a falling wedge pattern that initially formed as a bearish channel. Thus, it means we can expect a bullish breakout however gentle from the pattern. It is vital to note that BTC/USD sideways trading could take center stage in its core support range between $3,200 and $4,500.
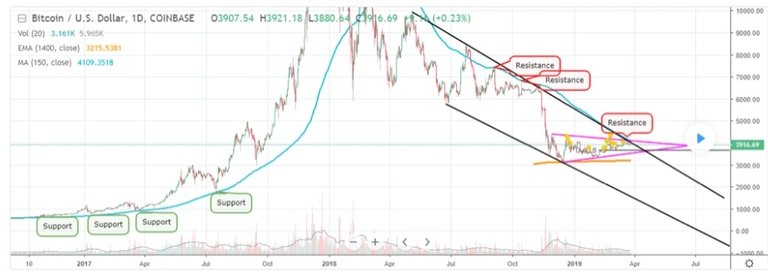
Another pattern that is key to the long-term outlook is the formation of a triangle pattern as seen on the chart. The triangle (in pink) has been information since December 2018 suggesting a continued downtrend. However, the risk to the south is minimal and if it happens and Bitcoin
Posted using Partiko Android
Source
Plagiarism is the copying & pasting of others work without giving credit to the original author or artist. Plagiarized posts are considered spam.
Spam is discouraged by the community, and may result in action from the cheetah bot.
More information and tips on sharing content.
If you believe this comment is in error, please contact us in #disputes on Discord
Hi! I am a robot. I just upvoted you! I found similar content that readers might be interested in:
https://coingape.com/bitcoin-price-analysis-btc-usd-strongly-bullish/