
SUMMARY
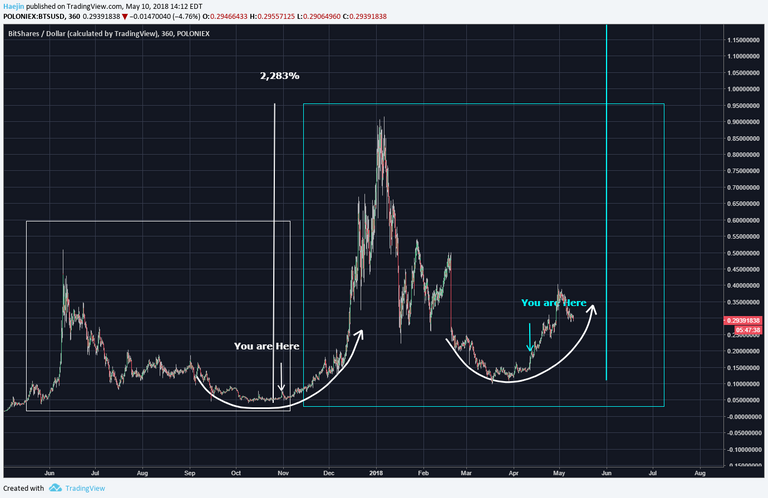
Fractals are very effective analogous tools that help enable better future price pathway projections. Fractals are also related to cycles and everything moves in cycles, the solar system to the turn of galaxies and even price fractals are cycle derived. Now, take a look at the below chart. The fractals boxed. Do you see also how the cycle from last year is also potentially playing out again?
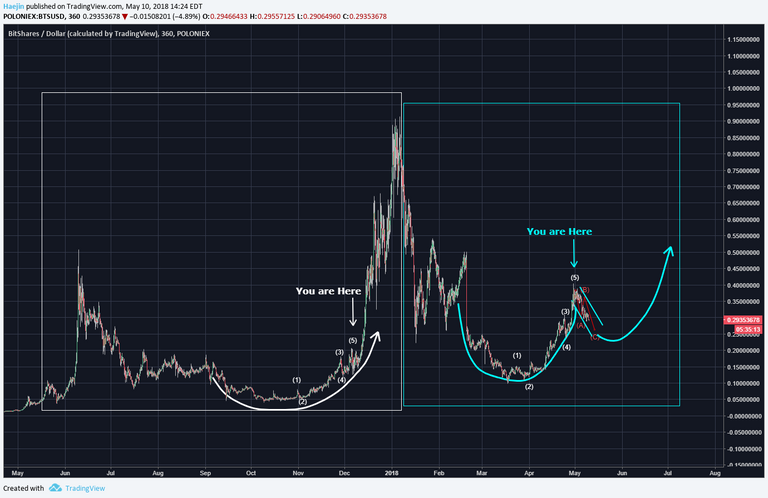
Here is the updated chart where I've moved up the "Your are Here" marker. Note how the white and blue fractals both have five waves up in the right wall of the rounded price formation. I believe the blue fractal is working on the hand portion of a Cup & Handle pattern. The key here is how far the red ABC will retrace. I've so far marked it to the 0.38 Fib level but it could be a bit deeper. Whould that change the analysis and projection, no.
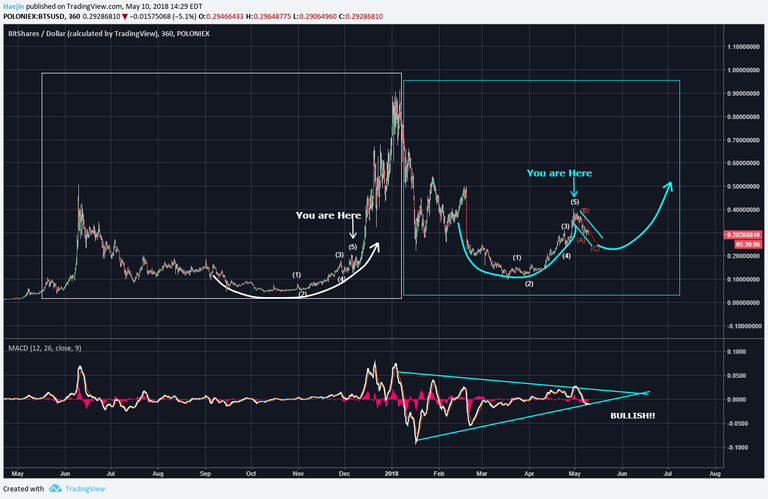
This is what really has me excited for many of the Altcoins....the MACD! It's traversing and obeying the contracting lines of a symmetrical triangle. As it gets closer to the Apex; it'll have to explode. Do you think it'll be up or down?
Legal Disclaimer: I am not a financial advisor nor is any content in this article presented as financial advice. The information provided in this blog post and any other posts that I make and any accompanying material is for informational purposes only. It should not be considered financial or investment advice of any kind. One should consult with a financial or investment professional to determine what may be best for your individual needs. Plain English: This is only my opinion, make of it what you wish. What does this mean? It means it's not advice nor recommendation to either buy or sell anything! It's only meant for use as informative or entertainment purposes.
Please consider reviewing these Tutorials on:
Elliott Wave Counting Tutorial #1
Elliott Wave Counting Tutorial #2
Elliott Wave Counting Tutorial #3
Laddering and Buy/Sell Setups.
Laddering Example with EOS
Tutorial on the use of Fibonacci & Elliott Waves
@haejin's Trading Nuggets
Essay: Is Technical Analysis a Quantum Event?
Follow me on Twitter for Real Time Alerts!!
Follow me on StockTwits for UpDates!!
--
--


thanks man
am gonna buy immediately
thats y haejin post these so we the army can buy and pump the price
Great article! But here's an upcoming alternation coin/platform with path breaking tech!
https://steemit.com/masternode/@debasis/why-artax-team-ahead-in-the-masternode-pos-cryptocurrency-game-ecp-tech
Down into negative territory sarcasm
What are @haejins MACD settings ? Mine are on default and they look different from his.
Excellent update @haejin ! Very exciting times, hopefully BTS will explode before we know it!!
Do you think BTS is likely to hit the price points you listed on your last post about BTS; that is, around the $2.30-$3.68 area?
@haejin
This is just a smaller piece of the bigger picture. He thinks that after this correction the market will rally through late june/early july $0.90 -$1.10is, then have a medium 50%ish correction for a couple months, then have another big push that takes us through to the end of the year. That would be when the $2.30-3.68 comes in. At least that is my interpretation of his bts posts.
Petty.
Coins mentioned in post:
Hello! I recently on Steemitt. I followed you, I hope you will follow me, too. Let's develop Steemit together! I'm glad to meet new interesting people
exactly same post and content .... this is 4th time i think
For you maybe, for me not !
It's an update ya jack wagon.