Author
Note
- This is a dissertation submitted to Graduate School of Science and Technology, Computer Science and Electrical Engineering in Kumamoto University, Japan, on September 2020 in partial fulfillment of the requirements for the degree of Doctor of Philosophy but was not published thus the copyright remained with me "Fajar Purnama" the main author where I have the authority to repost anywhere and I claimed full responsibility detached from Kumamoto University. Except for contents marked with copyright (©), I hereby declare to license it as customized CC-BY-SA where you are also allowed to sell my contents but with a condition that you must mention that the free and open version is available here. In summary, the mention must contain the keyword "free" and "open" and the location such as the link to this content.
- The presentation is available at Slide Share.
- The source code is available at Github.
Declaration of Authorship
I, Fajar PURNAMA , declare that this thesis titled, “Development of a Lossy Online Mouse Tracking Method for Capturing User Interaction with Web Browser Content” and the work presented in it are my own. This thesis is based on few of my publications and I hereby confirmed that I have permission to reuse them:
- For my journal paper titled "Implementation of real-time online mouse tracking on overseas quiz session" (Purnama et al., 2020b), the copyright was transferred to Springer Science+Business Media, LLC, part of Springer Nature but the authors and I have been granted full permission to reuse the accepted version of the journal paper.
- For my journal paper titled "Using real-time online preprocessed mouse tracking for lower storage and transmission costs" (Purnama and Usagawa, 2020), is open access under creative commons (CC-BY) where anyone can reuse the whole material.
- For my proceeding paper titled "Rsync and Rdiff implementation on Moodle’s backup and restore feature for course synchronization over the network" (Purnama, Usagawa, et al. 2016), the copyright was transferred to IEEE but the authors and I does not need formal permission to reuse the accepted version of the proceeding paper.
- For my technical report titled "Incremental Synchronization Implementation on Survey using Hand Carry Server Raspberry Pi" (PURNAMA and USAGAWA 2017), the copyright was transferred to IEICE but the authors and I have been granted full permission to reuse the published version of the report paper (IEICE, 2015).
- For my proceeding paper titled "Demonstration on Extending The Pageview Feature to Page Section Based: Towards Identifying Reading Patterns of Users" (Purnama, Fungai, and Usagawa 2016), the copyright was not transferred, thus the copyright remains with the authors.
- More detailed information are available in Appendix B.
Abstract
Though people are confined inside their houses due to COVID-19, they are forced to continue their activities online. The demand for tools to monitor these activities increases for example, making sure students reads materials, and examiners does not cheat during online examinations. Unfortunately, conventional web logs cannot monitor those kinds of activities. One monitor tool is mouse tracking that tracks the actions of the mouse cursor that includes clicks, movements, and scrolls, which covers the majority of online users’ interaction to the browser contents. Though mouse tracking is promising, very few implemented this tool because (1) previous mouse tracking tools requires desktop installations which is bothersome to the users and (2) the rumors that mouse tracking generates big data such as the saying a swipe from left to right generates a megabyte of data. This thesis tackles those problem by building a mouse tracking server application that is easily installable and does not require users to install any additional applications other than the web browser. The application was implemented in an overseas quiz session between National University of Mongolia and Kumamoto University where the amount of data generated was also investigated. This thesis also contributes to a lossy online mouse tracking method that can greatly reduce the amount of data generated. Finally, some visualization of the mouse tracking data are shown and possible application such as online examination cheating prevention and force reading of term of service are discussed.
Acknowledgements
My first gratitude would be to my supervisor Prof. Tsuyoshi Usagawa for taking care of me for five years starting from my Master’s program until the end of my Doctoral program. His deeds are almost immeasurable because without him, Kumamoto University, and The Ministry of Education, Culture, Sports, Science and Technology Japan, my currently best five years of my life may not be possible. I would like to thank my reviewers Prof. Kohichi Ogata, Prof. Kenichi Sugitani, Prof. Masahiko Nishimoto, and Prof. Masayoshi Aritsugi for their time in reviewing this thesis. I greatly thank my friend Alvin Fungai as the co-founder for this topic where without him, the topic of this thesis would have been different and I may be late in finishing this thesis because I have tried doing other topics and found to be much more difficult or just does not suit me. The critical development phase of this research was thanks to the Computer Algorithm class by Prof. Masayoshi Aritsugi and all of the participating members that included Hendarmawan, Hamidullah Sokout, Alhafiz Akbar Maulana, and Sari Dewi where in those moments that I decided this topic as my Doctoral thesis. The implementation and data were thanks to Dr. Otgontsetseg Sukhbaatar, Prof. Lodoiravsal Choimaa, and the students in School of Engineering and Applied Sciences, National University of Mongolia where without them, this topic may not make it to two international journal publication and may prevent the completion of this thesis. Lastly, I would like to thank my mother Linawati, father Teddy Junianto, and Ni Nyoman Sri Indrawati for their daily support.
1 Introduction
1.1 Background
Thanks to the development of information communication technology (ICT), humanity lives in convenience. It is no longer necessary to spend much effort to seek information. Whereas in the past, people needs to travel to libraries to seek books, buy newspapers to get the latest news, gather in a community to hear the latest rumors, or even start a pilgrimage to find a master. Nowadays, most information are available in the Internet. With ownerships of portable computer devices that can connect to the Internet from anywhere becoming mainstream, anyone can search for their desired information (Dentzel, 2013).
The Internet is not only an open massive source of information where anyone can publish, but also a tool for distant activities. People can interact with each other without meeting through text, voice, or video messages regardless the time and place. More people do not go to shop but order items through online shopping. In some countries like Indonesia, they develop an application that can order variety of services online (Azzuhri et al., 2018) such as meal delivery service, calling house cleaners, calling therapist, etc.
Due to the recent COVID-19 pandemic that occurred early February 2020, most regions are in a lockdown where people are to stay away from each other (mostly asked to stay at home) to prevent the spread of infection. Even school closes, most governments around the world have temporarily closed educational institutions in an attempt to contain the spread of the COVID-19 pandemic (UNESCO, 2020). All forms of activities are recommended to be done online which includes educational activities where courses are switched from face to face to online. The basic of online course that is known today is materials provided online, online text discussion forum, a feature to submit assignments online, online quiz session, (Linawati, Wirastuti, and Sukadarmika, 2017) and the features to analyze and evaluate students' performance. For interactivity, people prefer to join live streaming videos, webinars, online game sessions, interactive online programming, etc.
Unfortunately, conventional web analytic does not measure up to how teachers examine or analyze students during face to face private tutors. Teachers normally able to examine students' attention, emotion, and motivation during studying in real-time, but conventional web analytic does not provide such features for online education. This reason is especially true for a very crucial educational activity which is examination. Security is very tight for face to face examinations to prevent dishonest behavior but this is not true for online examinations today. This is why most educational institute implements blended (Paturusi, Chisaki, and Usagawa, 2012) learning which is a mixed face to face course and online course than implementing full online course. This applies to anything online, not only with education, for example during shopping, shop owners are able to identify the interest of their customers face to face and act accordingly. The simplest example people can see whether someone is skimming or pay close attention during reading when face to face. In online reading, people normally cannot know whether the viewer is actually reading the materials or not. An example crucial demand is reading detection of agreements or terms of services. Most people scrolls down and accept the terms of services without actually reading them.
The lack of data for online analytic can actually be solved by eye tracking, mouse tracking, and all other online monitoring techniques in real-time. Although these techniques were introduced in the early 20th century, they are still rarely implemented. One of the main reasons is the huge data generated by these techniques which is too much for most administrators and analyzers to handle (Leiva and Huang, 2015). This connects to the next reason that the previous applications only suit academia and does not suit wide implementation. For eye tracking is that the hardware are intrusive where users usually have to wear googles. Though non-intrusive ones exists but they are most likely expensive. Mouse tracking are non-intrusive and no cost because in default they are available in every computer where no additional hardware is needed. However, the previous application are only suited in laboratory where they are installed offline in each computer and not online. This thesis tackles that problem.
1.2 Problem
- There are almost no application to monitor crucial online activities such examinations.
- Although there are rumors of huge data generated by mouse tracking, there are almost no facts and investigations.
- The rumors already discourage mouse tracking application development for public development and today's most mouse tracking application are only suitable for academia and laboratories.
- The huge data generated are inline to the resource required for implementation, thus methods for reducing data generation are necessary.
1.3 Objective
- Create an online mouse tracking application that is easily implementable.
- Investigate the data generated and resource usage of the online mouse tracking application.
- Implement methods to reduce the data generated and resource usage of the online mouse tracking application.
- Use mouse tracking data to capture users' interaction with the web browser content and design a monitoring tool for crucial online activities which are examinations and passage reading.
1.4 Hypothesis
This thesis proposes a new preprocessing based on demand method specifically for online mouse tracking. It is a method that allows the implementer to determine the data they need before implementation. Amongst those data, the geometrical data (x and y mouse coordinates) are the largest one generated. Most of the time, implementer do not need all the data. Therefore, the data generation along with resource usage can be reduced if they choose the region of interest beforehand. In summary, by summarizing the coordinates into areas, the data generated can be reduced which will also reduce the resource usage.
1.5 Contribution
- Created an open source real-time online mouse tracking application that can be implemented on any website and browser.
- Investigated the data generated and resource usage of the real-time online mouse tracking application.
- A novel preprocessing based on demand method specifically for mouse tracking that reduces the data generation and resource usage.
- Implemented the mouse tracking application online and obtained mouse tracking data.
- Visualized the mouse tracking data and derive information which are usually underivable from conventional web logs and educational data.
- Designed a possible software implementation for monitoring online reading and examination.
1.6 Benefit and Significance
- Mouse tracking is one of the missing key for anything that are implemented fully online.
- Anyone can benefit the open source real-time online mouse tracking application in this thesis to implement or further develop online mouse tracking.
- The mouse tracking data generation and resource usage investigation can help companies and other parties to plan before implementing online mouse tracking.
- The methods presented to reduce mouse tracking data generation and resource usage gives opportunity for people in limited connectivity area to utilize online mouse tracking.
1.7 Thesis Structure
Other than the introduction, this thesis contains four more chapters. The second chapter is online mouse tracking implementation and investigation where this chapter discusses the implementation of online mouse tracking in any website and browser, and the amount of data generated. The third chapter is online mouse tracking resource usage reduction methods where known methods, real-time implementation, and the novel method of preprocessing based on demand is discussed. The fourth chapter is the depth levels of web logs and educational data which emphasizes mouse tracking logs as deeper level data than conventional educational data logs. The last chapter is conclusion and future work.
2 Online Mouse Tracking Implementation and Investigation
2.1 System Overview
2.1.1 Mouse Tracking in Web Development
Mouse tracking is a method to record the mouse activities of the users. Mainly, it records the clicks, movements, and scrolls location illustrated in Figure 2.1. Mouse tracking can be developed on the desktop level or the application level. On the desktop level, mouse tracking tracks every mouse activities that occur on the desktop, while on the application level, mouse tracking only tracks activities in the application and will stop tracking when the mouse cursor leaves the application. In this thesis case, the application is the web where it is related to the browsers and websites. There are many programming languages such as C to develop desktop mouse tracking while to develop web based mouse tracking, web programming language such as JavaScript (JS) is used.
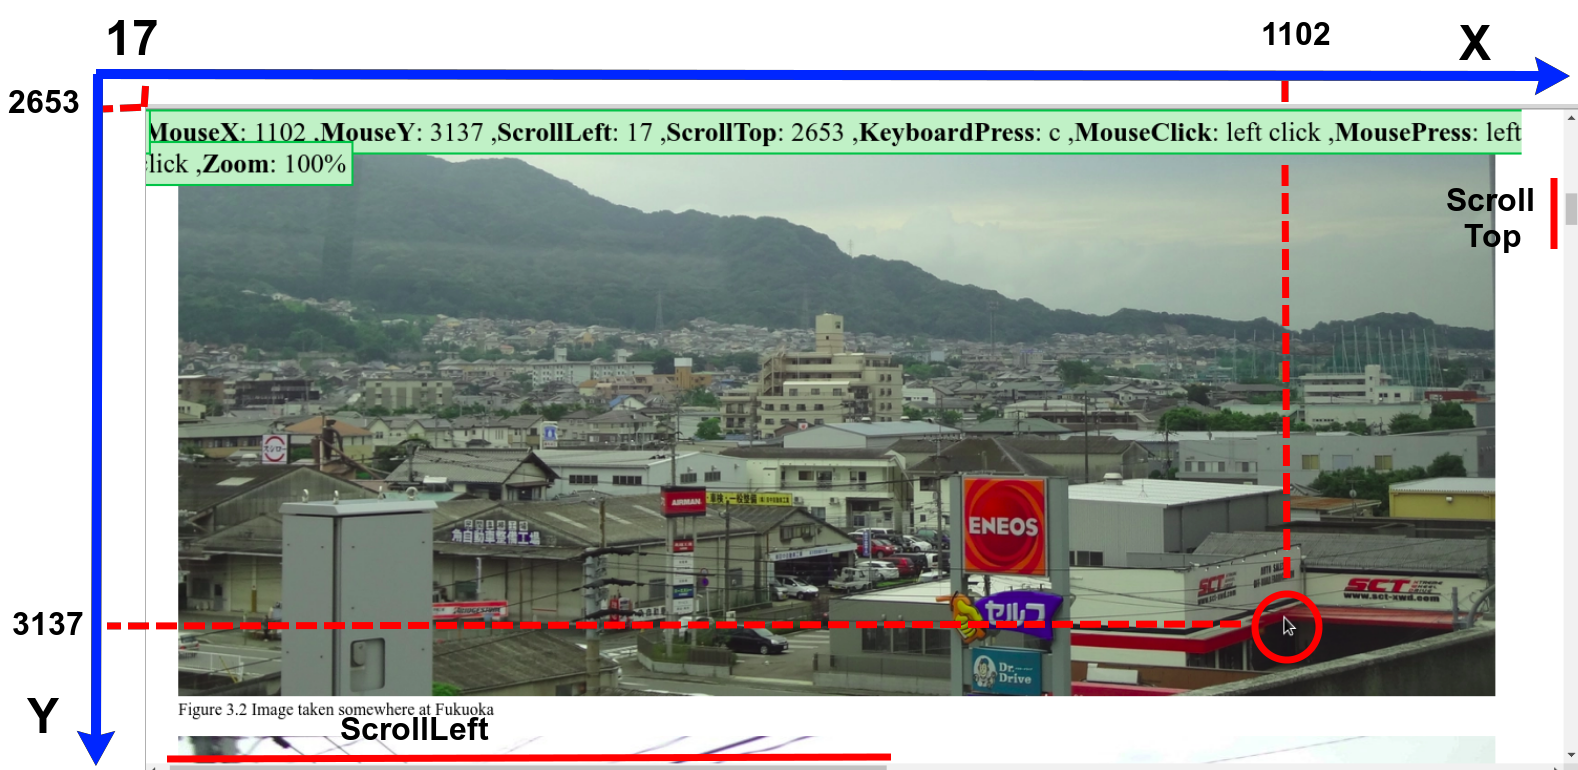
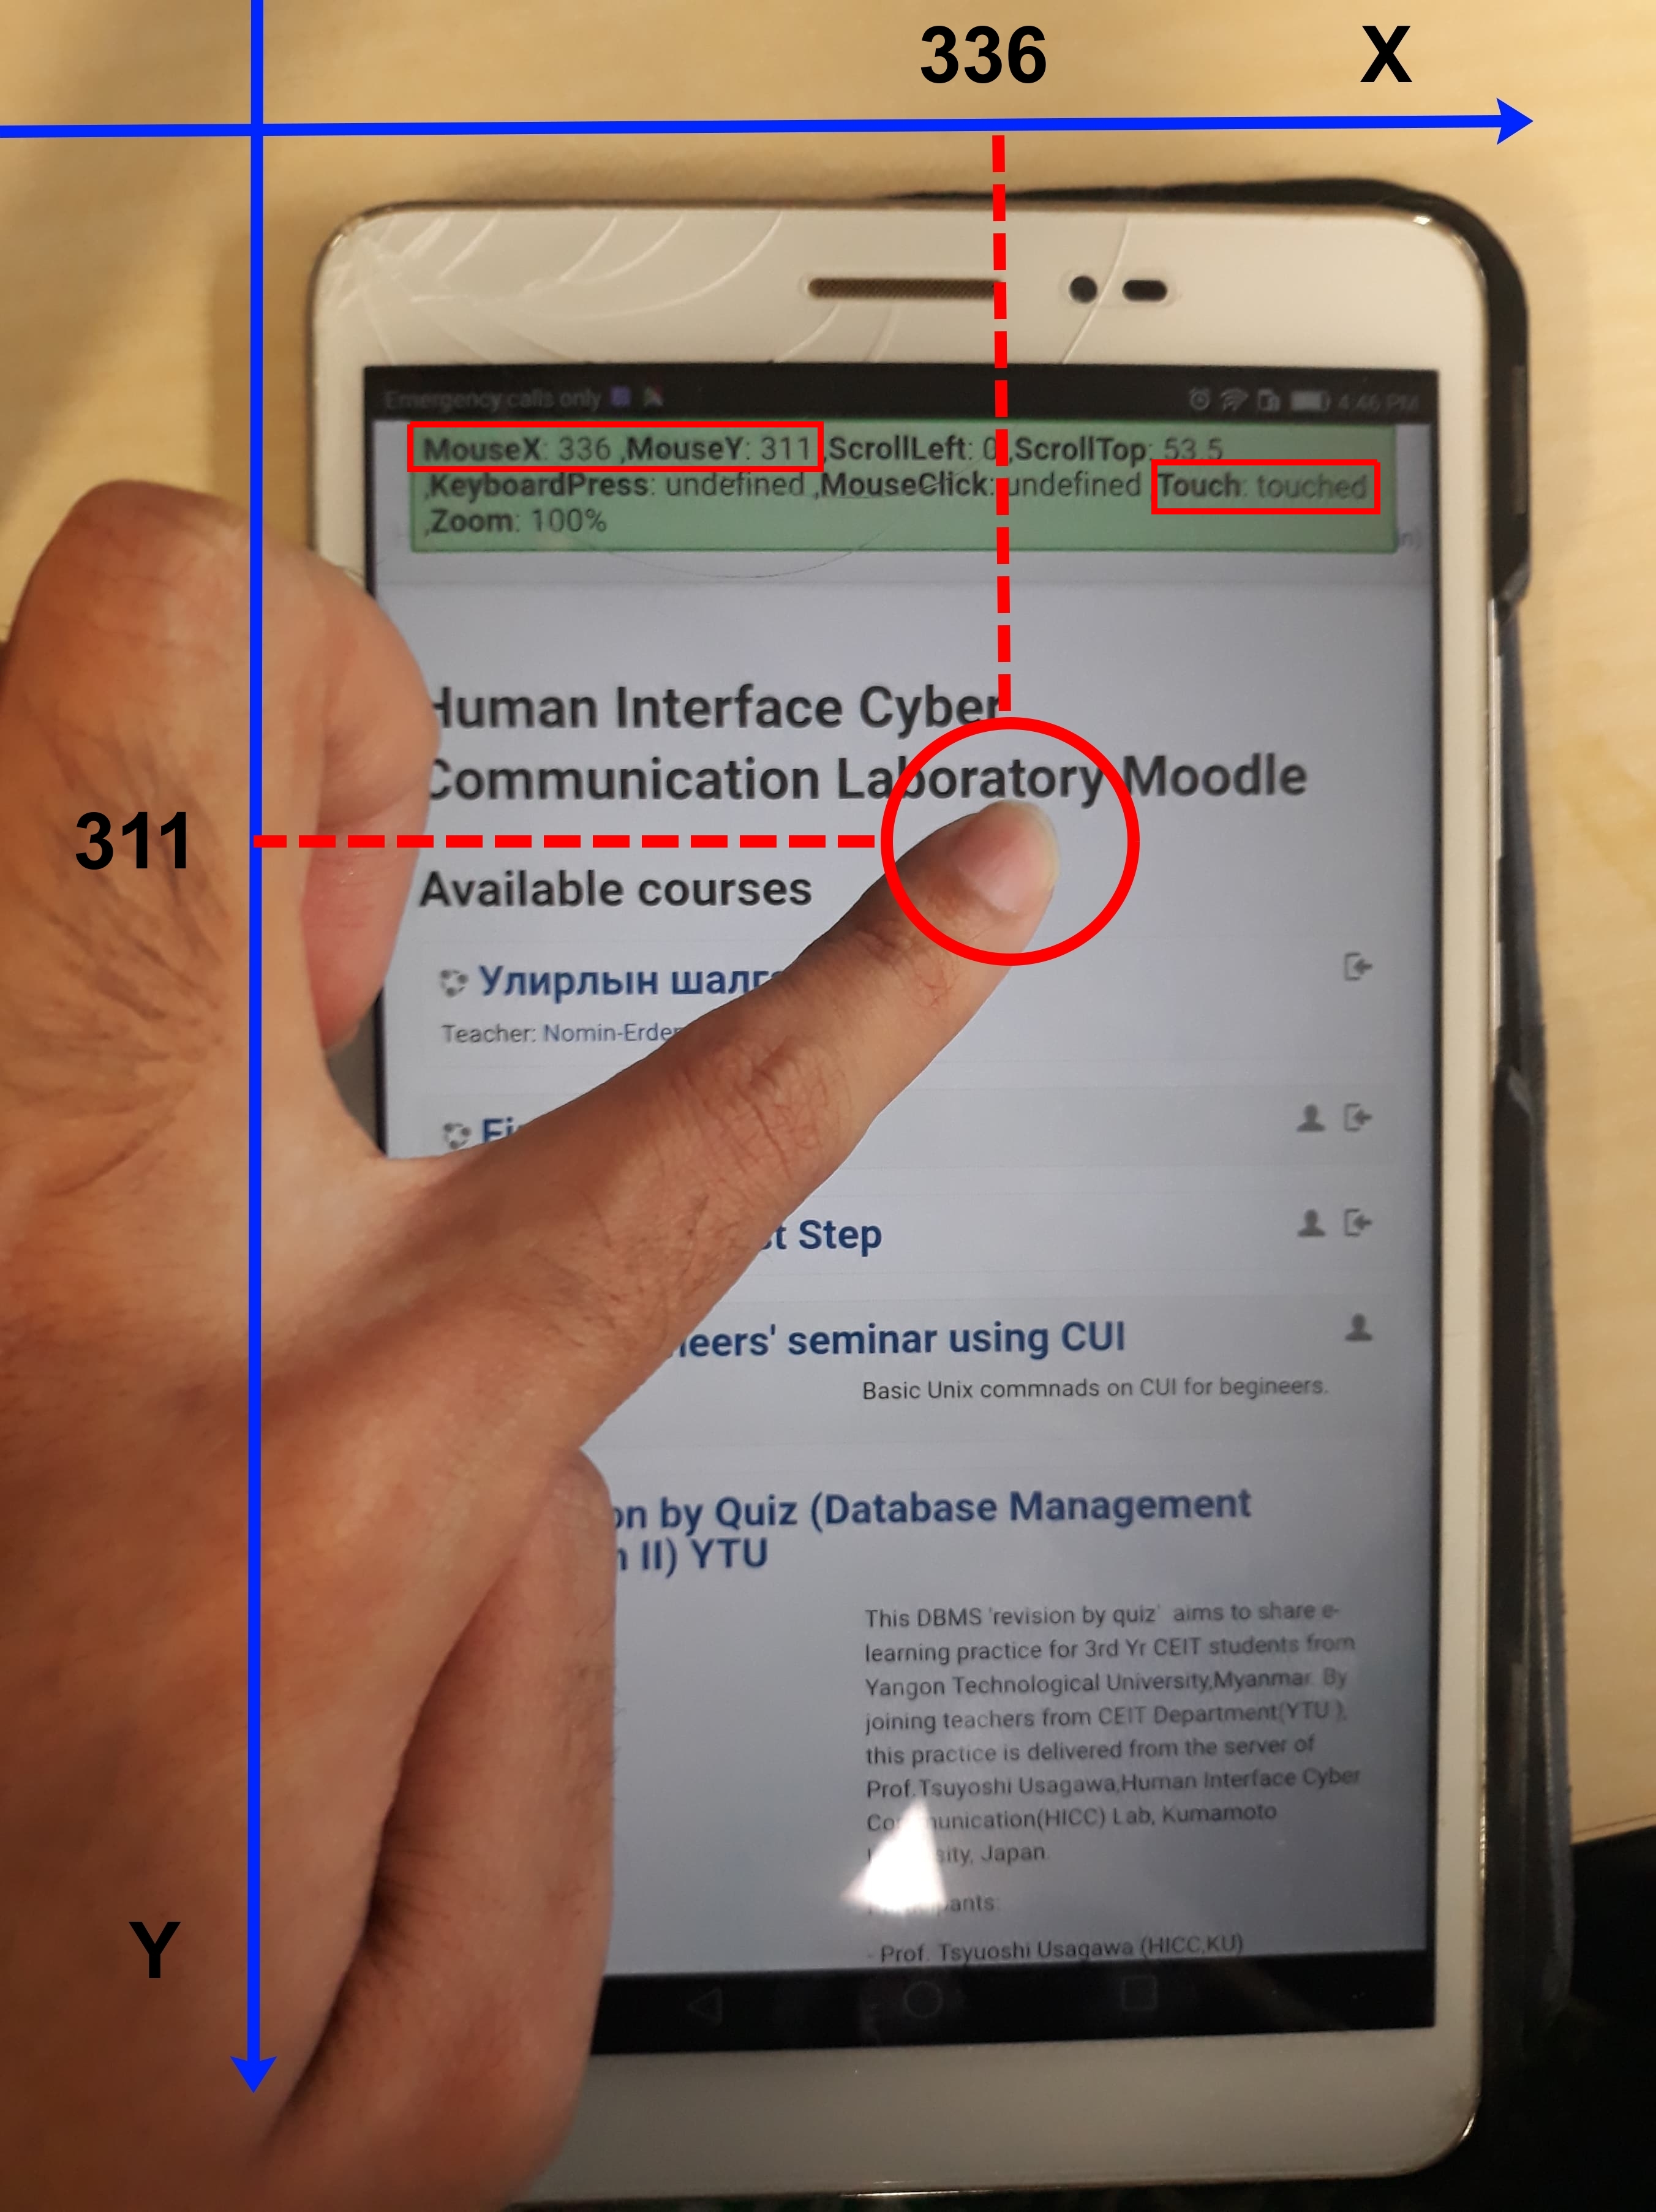
Figure 2.1 Mouse tracking illustration where the top image is from personal computer (PC) and bottom image is from smartphone tablet © (Purnama et al., 2020b). Both the image shows geometrical data (x and y coordinate) of the occurred mouse, scroll, and touch event, also which mouse button is clicked, how much percentage of zoom applied, and whether a keyboard is pressed.
The core of mouse tracking in web development is Domain Object Model (DOM) which is an Application Programming Interface (API) for Hypertext Markup Language (HTML) and Cross Markup Language (XML). It defines the logical structure of documents and the way a document is accessed and manipulated. Supposed a simple HTML page with the codes on Table 2.1, the DOM structure can be represented on Figure 2.2. With the Document Object Model, programmers can build documents, navigate their structure, and add, modify, or delete elements and content. Anything found in an HTML or XML document can be accessed, changed, deleted, or added using the Document Object Model, with a few exceptions. DOM is designed to be used with any programming language. Currently, it provides language bindings for Java and ECMAScript (an industry-standard scripting language based on JS and JScript) (Wood et al., 1998).
Table 2.1 A web page code in simple HTML that contains html, head, title, body, p, and footer tags (Purnama and Usagawa, 2020)
<html>
    <head>
        <title>Simple Webpage</title>
    </head>
    <body>
        <p>Hello World!</p>
    </body>
    <footer>
        <p>CC</p>
    </footer>
</html>
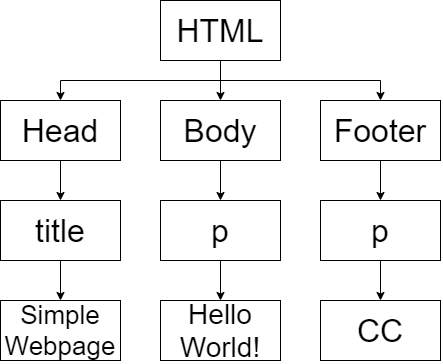
Figure 2.2 DOM representation of Table 2.1 (Purnama and Usagawa, 2020). The html tag is the parent with head, body, and footer tag as the children. Head has a child tag title, body has a child tag p, and footer has a child tag p.
The implementation of mouse tracking is based on DOM events, specifically mouse, touch, and User Interface (UI) events which are actions that occur as a result of the user's mouse actions or as a result of state change of the user interface or elements of a DOM tree (Pixley et al., 2000). In this thesis jQuery is used to access the DOM API and receive information that are related to mouse, touch, and UI events. The following list shows the mouse events utilized in this thesis:
- Mousedown: when either one of the mouse buttons are pressed (usually left, middle, or right button)
- Mouseup: when either pressed mouse buttons are released
- Mousemove: when the mouse cursor moves
- Mouseleave: when the mouse leaves an element (we only indicate when temporary leaving a webpage)
- Mouseenter: when the mouse enters an element (we only indicate when temporary entering a webpage)
- Scroll: when the webpage scrolls
- Touchstart: when a computer device screen is touching
- Touchend: when a touch from touchstart is removed
- Touchmove: when a touch is moving
- Touchcancel: when a touch is interrupted
- Resize: when the webpage is zoomed in or out
There are many DOM events that are not implemented by the application in this thesis. However, they maybe implemented in the future if they are found to be useful. But for now, the following DOM events other than mouse events are worth considering and are implemented:
- Beforeunload: when the webpage almost closes
- Resize: when the webpage is zoomed in or out
- keypress: when a keyboard is pressed
- cut: when the user attempts to cut a content
- copy: when the user attempts to copy a content
- paste: when the user attempts to paste a content
- dblclick: when a double click is performed
- auxiliarymenu: when a right click menu is called
After implementing the DOM events, the information is processed by adding important labels. The first labels are time information such as the date of the received information and duration by calculating the difference between the current and previous received events. The second labels are the place information such as the category, page, post, course, course content, or if those information are not available then the default information is the Uniform Resource Locator (URL). More in-dept place information are the areas or sections of the page, and the deepest of them all are the coordinates of the page. The third label is the identity label if available and permitted such as the name, email address, ip address, and location of the user.
2.1.2 Online Mouse Tracking System
The author developed an online mouse tracking application implementable on any website where the code is open source on GitHub (Purnama, 2019). It is written in HTML, Cascading Style Sheets (CSS), JS, jQuery, and PHP. The mouse tracking code can either be implemented on client side shown on Figure 2.3 or server side shown on Figure 2.4. The difference is that the client side can capture anything including all the web page that the user visits while the server side can only capture the events that happen on the server's website.
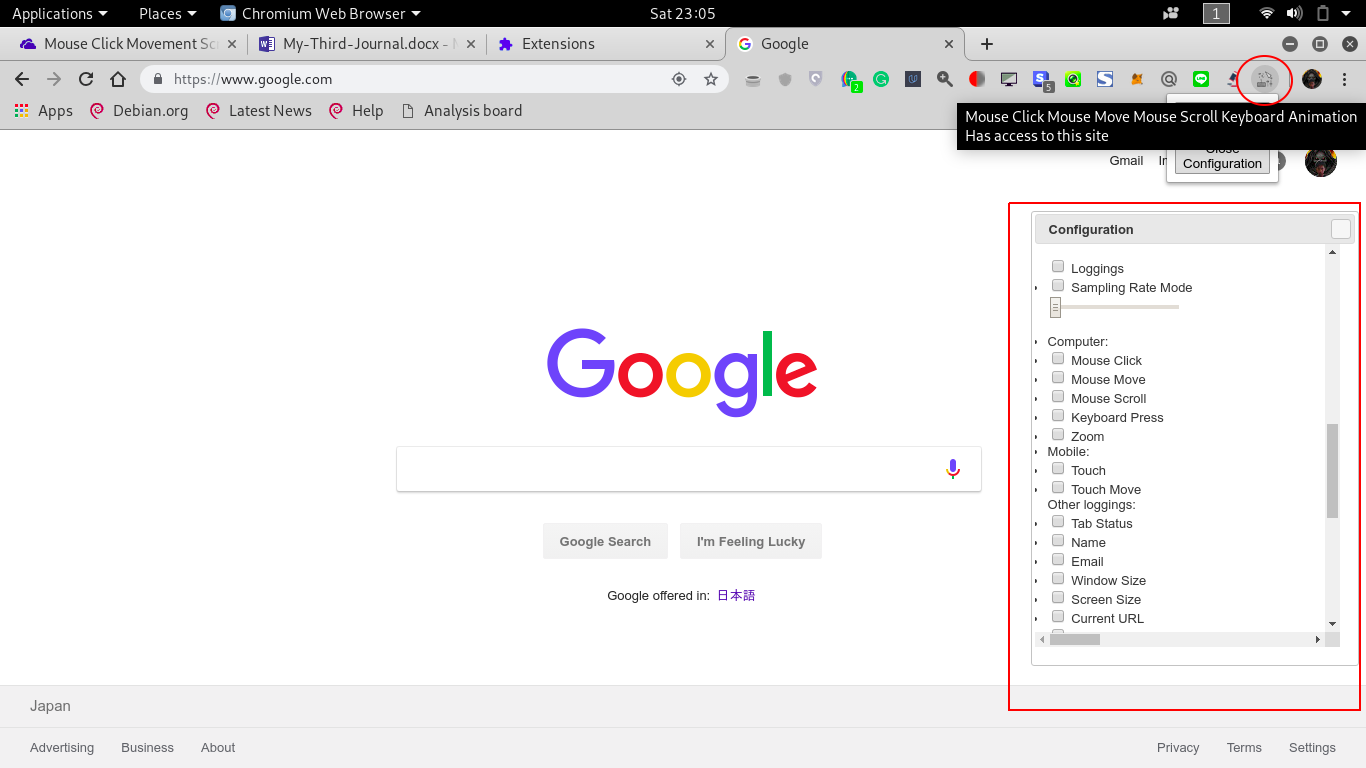
Figure 2.3 Mouse Tracking Chrome extension © (Purnama et al., 2020b). The mouse tracking extension is visible on the extension bar. The user can open the configuration window by clicking the icon and configuration. the events (clicks, moves, scrolls) to record.
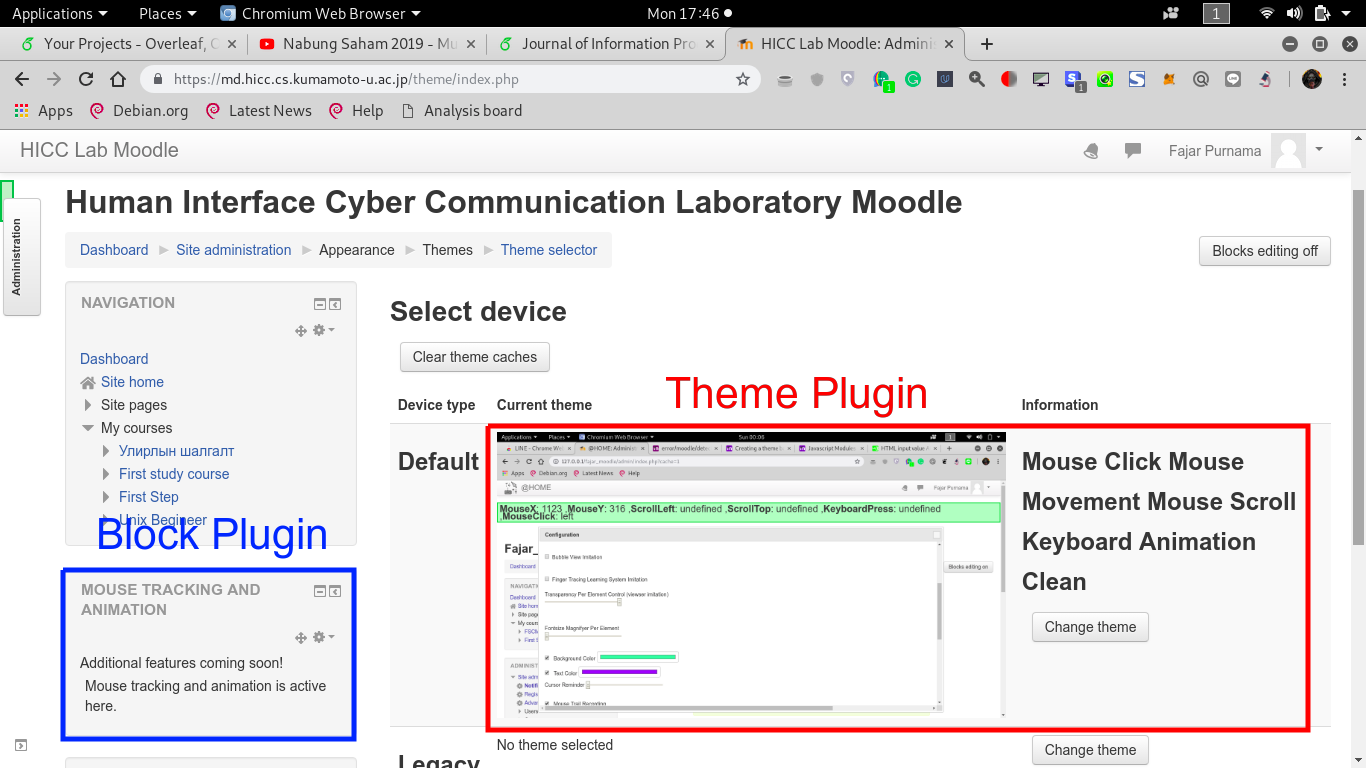
Figure 2.4 Mouse Tracking Plugin on Moodle © (Purnama et al., 2020b). The figure shows examples of mouse tracking implemented as a block plugin (in blue) and theme plugin (in red).
Figure 2.5 shows a more detailed server side implementation. The mouse, touch, and UI DOM events in the previous subsection are written in JS and jQuery and are placed on the representation side which is the website along with the HTML and CSS. The order the online mouse tracking in Figure 2.5 are:
- The browser attempts to visit the website by requesting HTML, CSS, and JS. If the mouse tracking is written as a server application, then the code is in the JS section, otherwise it is directly installed on the client. The code is written in jQuery.
- The HTML, CSS, and JS are sent to the client.
- The browser renders the page by processing the HTML and CSS.
- JS and jQuery are often categorized as client side programming language. They run on the browser's background where in this case the mouse tracking is running on the background.
- What differentiates offline and online mouse tracking is the location of where the mouse tracking log is stored. Offline mouse tracking stores the logs on the client while online mouse tracking stores the logs on online server. When storing mouse tracking log online, the client side sends the log using Hypertext Transport Protocol (HTTP) post method.
- The server processes the received log usually using server side programming language such as PHP.
- The log can be stored as a file, in a database, or in any form of storage.
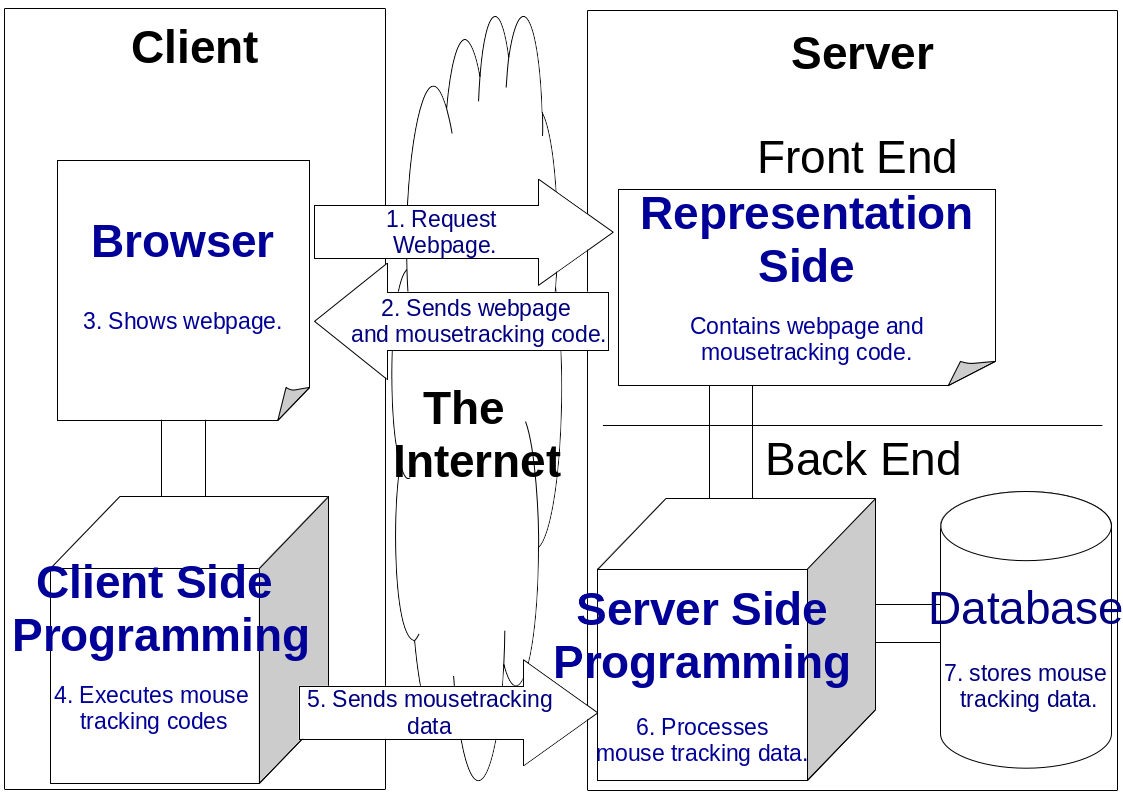
Figure 2.5 Online Mouse Tracking Framework © (Purnama et al., 2020b). The Framework is divided into two sides where one side is the client and the other side is the server. The client and the server are connected via the Internet. The server contains the front end, which is usually the representation side of the website, and back end where background processing and data storing occurs. There is a browser on the client equipped with client-side programming. The arrow presents the direction of the processes and the number presents the order of the processes.
For the client side does not require high performance hardware even Raspberry Pi works. As for the operating system, any operating system will do for as long as it has a browser that can run JavaScript. The application developed in this thesis supports both offline and online log storage and can either be in form of a file or stored in a database application. For the client application, this thesis provides a browser extension. Although that it requires installation in each client, all browser activities including visiting other websites are tracked. The author bundled the mouse tracking browser extension codes to make the installation easier where the client only needed to download and install.
For the server application, the advantage is that client does not need to install additional application, just browse the website and mouse tracking runs automatically but the disadvantage is that it cannot track outside of the website however it can still tell whether users' are leaving the page or not. For the server hardware depends on the amount of users that the administrators want to handle and as for the hardware specification used in this thesis is discussed on the next section. For the software, a standard web server is enough such as a server equipped with Apache2, PHP, and MySQL. For the installation, the author made it easy that all that are needed are to download the codes and install. In this thesis, the mouse tracking server application was implemented on an Learning Management System (LMS) called Moodle which is used to handle online courses. The mouse tracking codes are rearranged as a Moodle plugin where the author made a block and theme plugin for the Moodle shown on Figure 2.4. For usage, online choose one form of the plugin, either block or theme. The installation is also easy shown on Figure 2.6 where the process are only download, upload the plugin to Moodle, and install.
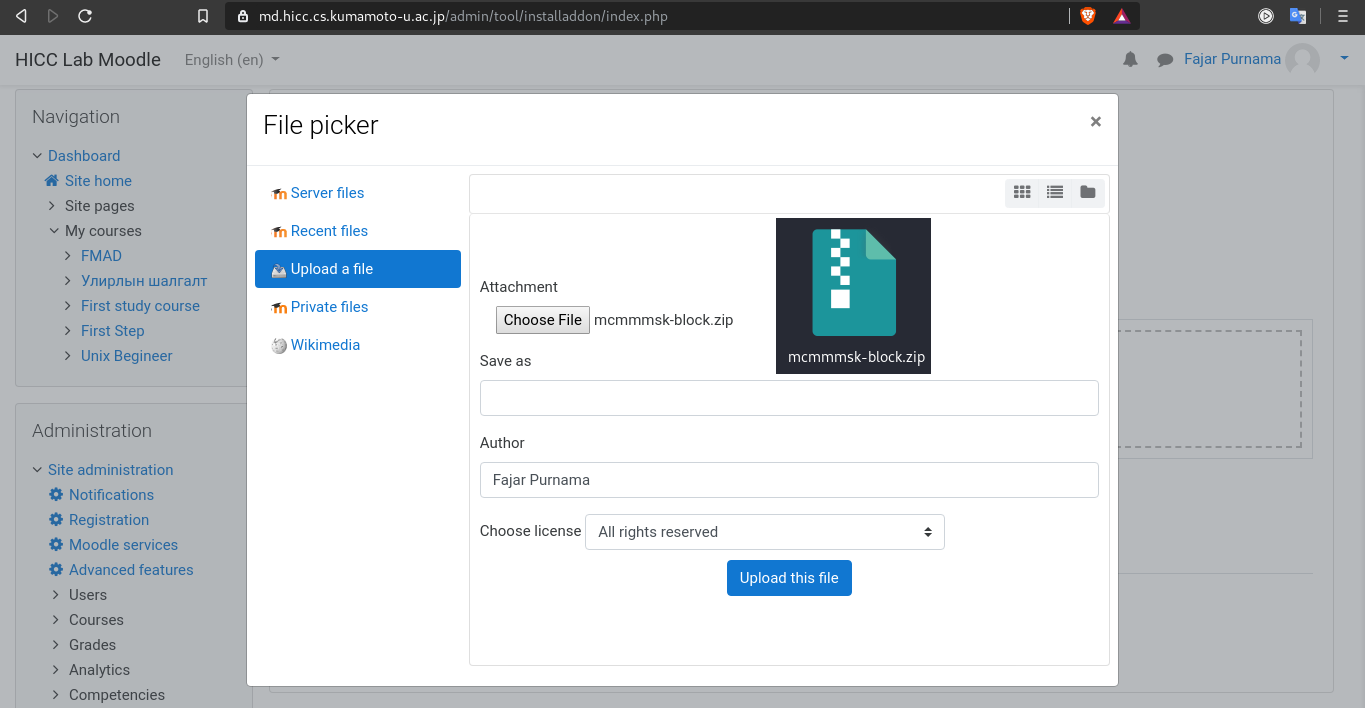
Figure 2.6 Screenshot and illustration of installing mouse tracking Moodle plugin. The page shows Moodle plugin installation page and the .zip image symbol represents the mouse tracking Moodle plugin in .zip format.
2.1.3 Privacy Policies
Privacy policies should be disclosed to the users during any form of data gathering. In the European Union (EU) is more strict that cookie policies should be separated from the privacy policies. By disclosing privacy policies, not only being in compliance with the laws and regulations, but build trusts with the users as well (PrivacyPolicies.com, 2020).
Based on how mouse tracking is executed which more details are illustrated in Figure 2.5, users actually have full control over the mouse tracking process and they can stop the process anytime but they are usually unaware because the mouse tracking runs in the background. They would have to thoroughly inspect the background area to see the running mouse tracking and most users do not attempt to perform this task because they do not feel bothered by the process. This is the reason why mouse tracking is considered non-intrusive.
Another reason why most users do not attempt to inspect the background area to see the running mouse tracking is because this requires technical skills that most users do not possess. Therefore, they are usually not aware that their data regarding to mouse, touch, and UI activities are recorded. To be in compliance with the privacy policy in general public websites, mouse tracking data gathered should be disclosed. The method is to pop up a mouse tracking configuration menu and before that, a notification menu asking permission to the user whether they allow the recording or not illustrated on Figure 2.7. If they allow then the options on the configuration menu should be marked and if they do not allow then the the options should be unmarked and no mouse tracking runs. In the educational sector depends on the academy/college/school/university and the lecturer/professor/teacher. Most of the time, the students are forced into compliance in having their activities recorded because of the demand to handle crucial educational activities such as preventing dishonest behaviors during exams.
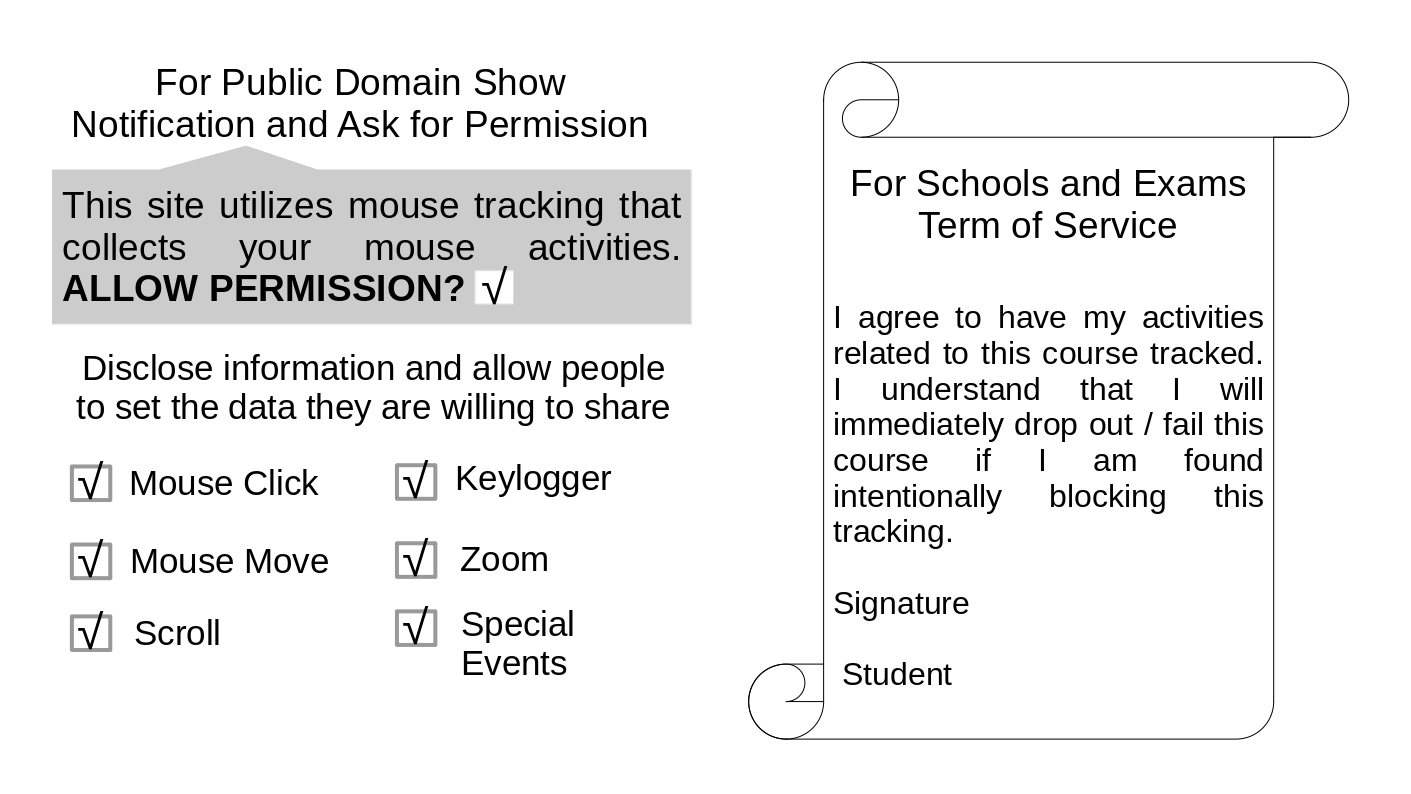
Figure 2.7 The left image shows public privacy policy compliance illustration and the right image shows an agreement example between student and teacher about the recording of mouse tracking data for crucial educational activities.
2.2 Network Data Transmitted by One Click
Leiva and Huang, 2015 stated that a mouse swipe from left to right can generate hundreds of cursor coordinates and a mouse activity over a minute can generate 1 MB (megabyte) of data. Huang, White, and Dumais, 2011 conducted a massive scale mouse tracking on Microsoft’s Bing search engine but in the middle of the experiment, they have to reduce the sampling rate because the data size was simply too much. Those two references are the only scientific record found that complains about the problem of huge data generated by mouse tracking. This shows that data generated and the resource usage are not officially investigated. Therefore, an implementation followed by investigation were conducted by Purnama et al., 2020b.
2.2.1 Peer to Peer Experiment
The one click Peer-to-Peer (P2P) experiment is an experiment that measures the amount of data transmitted from the client to server when the user performs one click shown on Figure 2.8. This experiment greatly helps the investigation because the result can be used to predict the data cost mathematically. However, the result is dependent on the application, as time passes people may find ways to reduce the data.
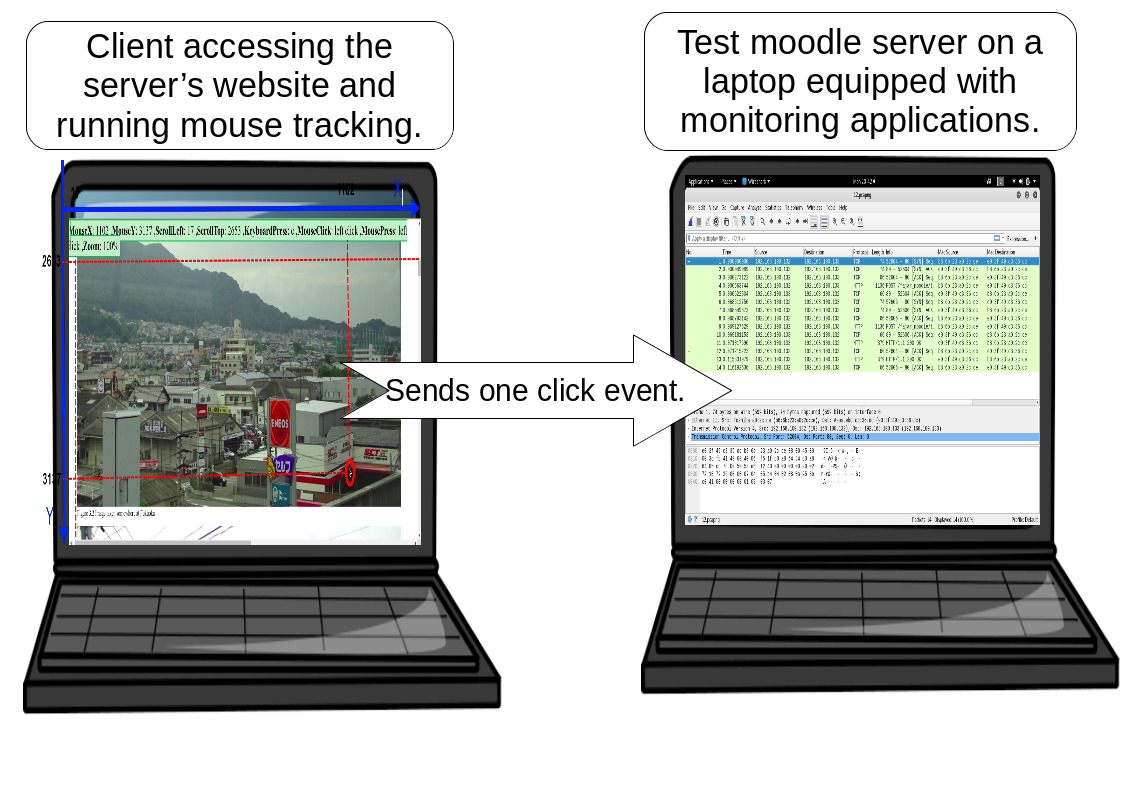
Figure 2.8 P2P real-time mouse tracking experiment © (Purnama et al., 2020b). The right laptop has a Moodle server installed with mouse tracking codes, while the left laptop has Ubuntu Desktop OS installed. The role of the latter is to access the Moodle server on the right laptop using a browser and perform one click. The right laptop received the click event and stored it on the database while measuring the network cost of the click event.
The online mouse tracking application was installed on the author’s Moodle server. The resource costs were then measured. The data rate of the network was measured using a tool called Wireshark. The server is an Ubuntu 18.04 Long Term Service (LTS) server equipped with an Intel(R) Core(TM) i7-6800K Central Processing Unit (CPU) @ 3.40 Giga Hertz (GHz) (with SSE4.2) CPU, 32 Giga Byte (GB) of DDR4 Random Access Memory (RAM), 10 Tera Byte (TB) of hard drive, and an allocated 2 Mega Byte per second (MBps) network.
2.2.2 Data Generation Estimation for Implementation Plan
The result on Table 2.2 showed that one click generates around 3-4 kilo Byte (kB) of transmission data. In other words, the mouse tracking application generates around 3-4 kB when one event occurs. The size depends on the metadata where in this case the size greatly increases when date and URL are included because they contain many characters.
Table 2.2 The data generated of one click posted to the server © (Purnama et al., 2020b). The rows before the last row are the types of information, and the last row shows the data rate of the submitted post (Purnama et al., 2020a).
| NO | ✓ | ✓ | ✓ | ✓ | ✓ | ✓ | ✓ | ✓ | ✓ | ✓ | ✓ | ✓ |
|---|---|---|---|---|---|---|---|---|---|---|---|---|
| ID | ✓ | ✓ | ✓ | ✓ | ✓ | ✓ | ✓ | ✓ | ✓ | ✓ | ✓ | ✓ |
| Name | ✓ | ✓ | ✓ | ✓ | ✓ | ✓ | ✓ | ✓ | ✓ | ✓ | ✓ | ✓ |
| ✓ | ✓ | ✓ | ✓ | ✓ | ✓ | ✓ | ✓ | ✓ | ✓ | ✓ | ✓ | |
| X | ✓ | ✓ | ✓ | ✓ | ✓ | ✓ | ✓ | ✓ | ✓ | ✓ | ✓ | ✓ |
| Y | ✓ | ✓ | ✓ | ✓ | ✓ | ✓ | ✓ | ✓ | ✓ | ✓ | ✓ | ✓ |
| leftclick | ✓ | ✓ | ✓ | ✓ | ✓ | ✓ | ✓ | ✓ | ✓ | ✓ | ✓ | ✓ |
| rightclick | ✓ | ✓ | ✓ | ✓ | ✓ | ✓ | ✓ | ✓ | ✓ | ✓ | ✓ | ✓ |
| middleclick | ✓ | ✓ | ✓ | ✓ | ✓ | ✓ | ✓ | ✓ | ✓ | ✓ | ✓ | ✓ |
| keyboardtype | ✓ | ✓ | ✓ | ✓ | ✓ | ✓ | ✓ | ✓ | ✓ | ✓ | ✓ | |
| scrollx | ✓ | ✓ | ✓ | ✓ | ✓ | ✓ | ✓ | ✓ | ✓ | ✓ | ||
| scrolly | ✓ | ✓ | ✓ | ✓ | ✓ | ✓ | ✓ | ✓ | ✓ | ✓ | ||
| zoom | ✓ | ✓ | ✓ | ✓ | ✓ | ✓ | ✓ | ✓ | ✓ | |||
| touch | ✓ | ✓ | ✓ | ✓ | ✓ | ✓ | ✓ | ✓ | ||||
| touchmove | ✓ | ✓ | ✓ | ✓ | ✓ | ✓ | ✓ | |||||
| tab | ✓ | ✓ | ✓ | ✓ | ✓ | ✓ | ||||||
| duration | ✓ | ✓ | ✓ | ✓ | ✓ | |||||||
| date | ✓ | ✓ | ✓ | ✓ | ||||||||
| content url | ✓ | ✓ | ✓ | |||||||||
| windowsheight | ✓ | ✓ | ||||||||||
| windowswidth | ✓ | ✓ | ||||||||||
| screenheight | ✓ | |||||||||||
| screenwidth | ✓ | |||||||||||
| data rate (kB) | 3.11 | 3.14 | 3.14 | 3.2 | 3.2 | 3.22 | 3.25 | 3.29 | 3.43 | 3.56 | 3.64 | 3.72 |
If the administrator can estimate the amount of users and the average amount of events generated by users, then the administrator can estimate the amount of data to be generated. Rheem, Verma, and Becker, 2018 states that a very high activity is around 70 events per second. Based on Figure 2.9, expect a worst case scenario that a user generates a data rate of 210-280 kilo Byte per second (kBps).
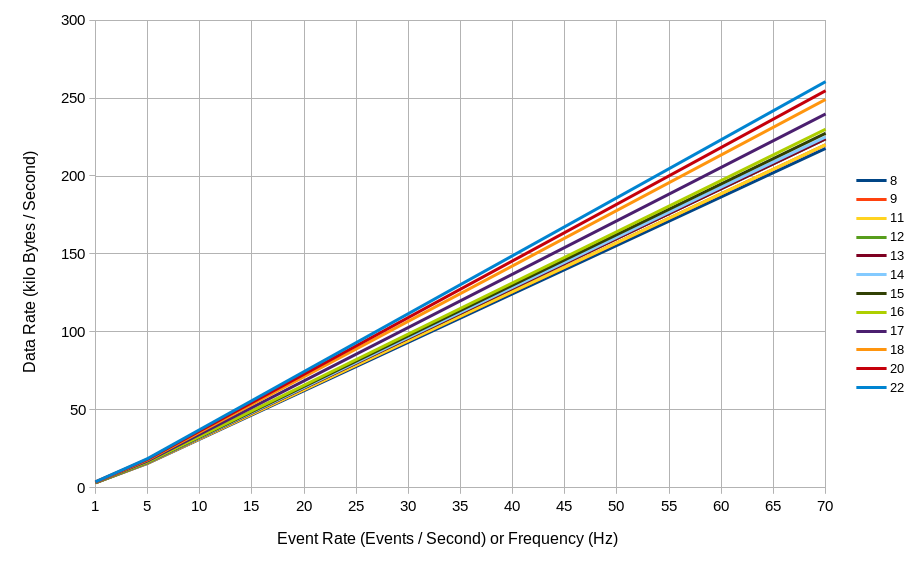
Figure 2.9 A plot of data rate generated by a user based on the events generated per second © (Purnama et al., 2020b). The horizontal axis represents the events per second or frequency in Hertz (Hz) and the vertical axis represents the data rate in kilobytes per second. The different colored lines represent the number of variables included (refer to Table 2.2).
2.3 Overseas Online Mouse Tracking Implementation
2.3.1 Quiz Details
An online quiz session was conducted on the 3rd of January 2019 between approximately 12:00 and 14:30 Japan standard time. There were 2 sessions, with each session lasting approximately an hour and including 20 and 21 students (41 total students participating) from the School of Engineering and Applied Sciences, National University of Mongolia accessing the Moodle server at the Human Interface and Cyber Communication Laboratory, Kumamoto University. The map illustration is shown on Figure 2.10.
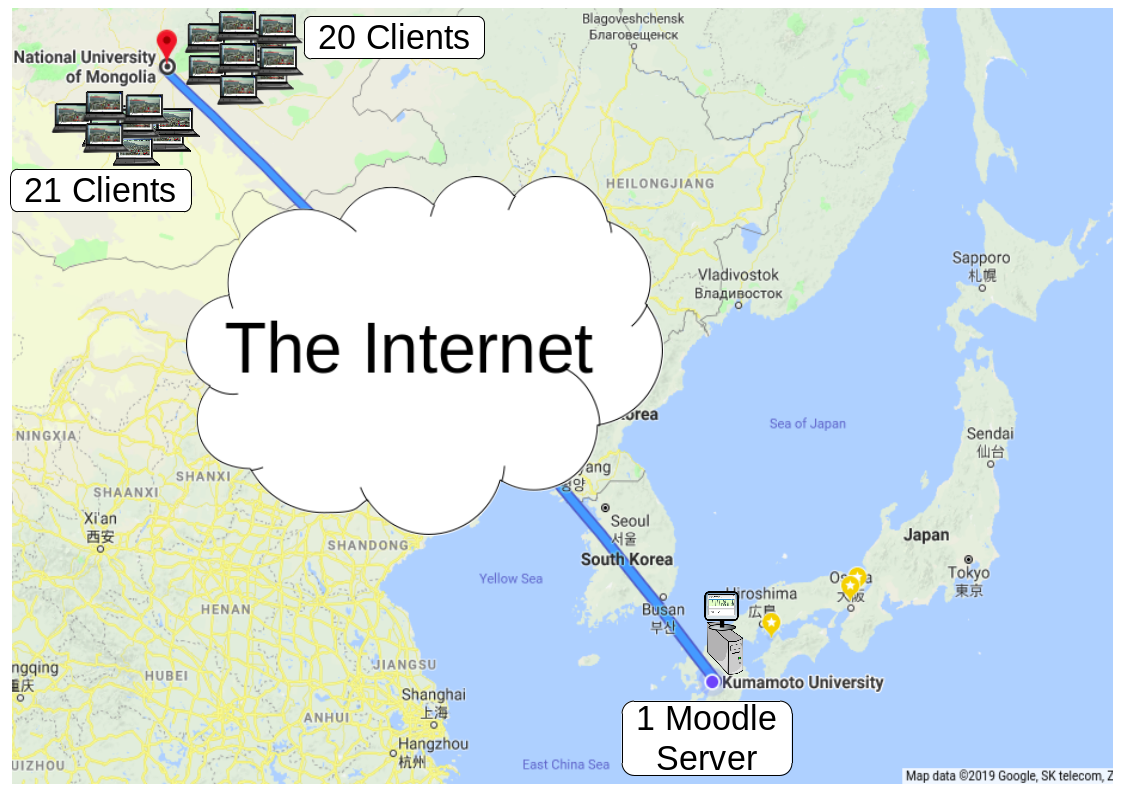
Figure 2.10 Overseas real-time online mouse tracking implementation © (Purnama et al., 2020b). Forty-one clients from the National University of Mongolia, separated into two groups, accessed the Moodle server at Kumamoto University in turns through the Internet and participated in a ten-question quiz session while mouse and keyboard activities were recorded. The Moodle server also measured the resource costs.
The quiz is a part of a mid-term exam of Microprocessor and Interfacing Techniques course for sophomore and junior year students in Department of Electronics and Communication Engineering, National University of Mongolia. The quiz is on https://md.hicc.cs.kumamoto-u.ac.jp. Figure 2.11 shows a screenshot of the Moodle log file and Figure 2.12 shows a screenshot of students grade of the quiz session. The detailed anonymous log files are published in Mendeley Data (Purnama et al., 2020a). The internet protocol (IP) address of the students for example “119.40.99.53” can be tracked by geo-location that it originates from Mongolia and “https://md.hicc.cs.kumamoto-u.ac.jp” which can be nslookup as “133.95.104.1” originates from Japan.
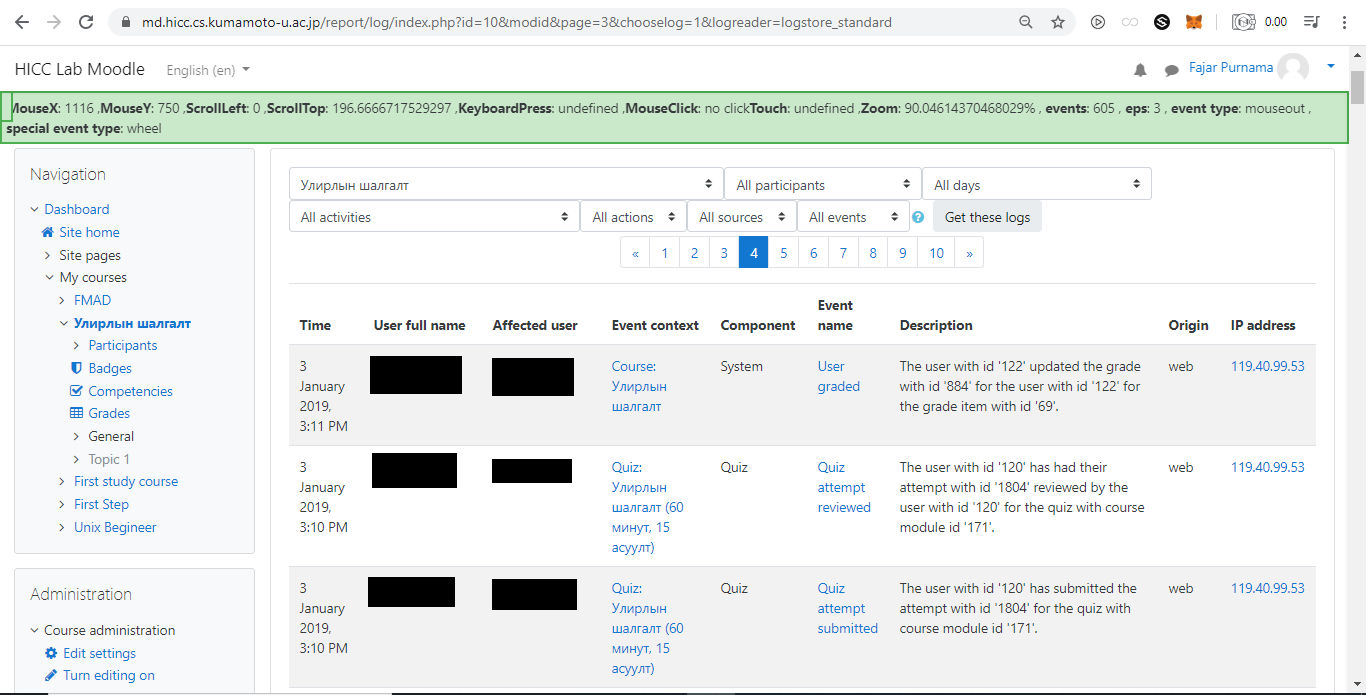
Figure 2.11 Screenshot of moodle log of students from National University of Mongolia who attempted a quiz session on a Moodle server at Kumamoto University © (Purnama et al., 2020b).
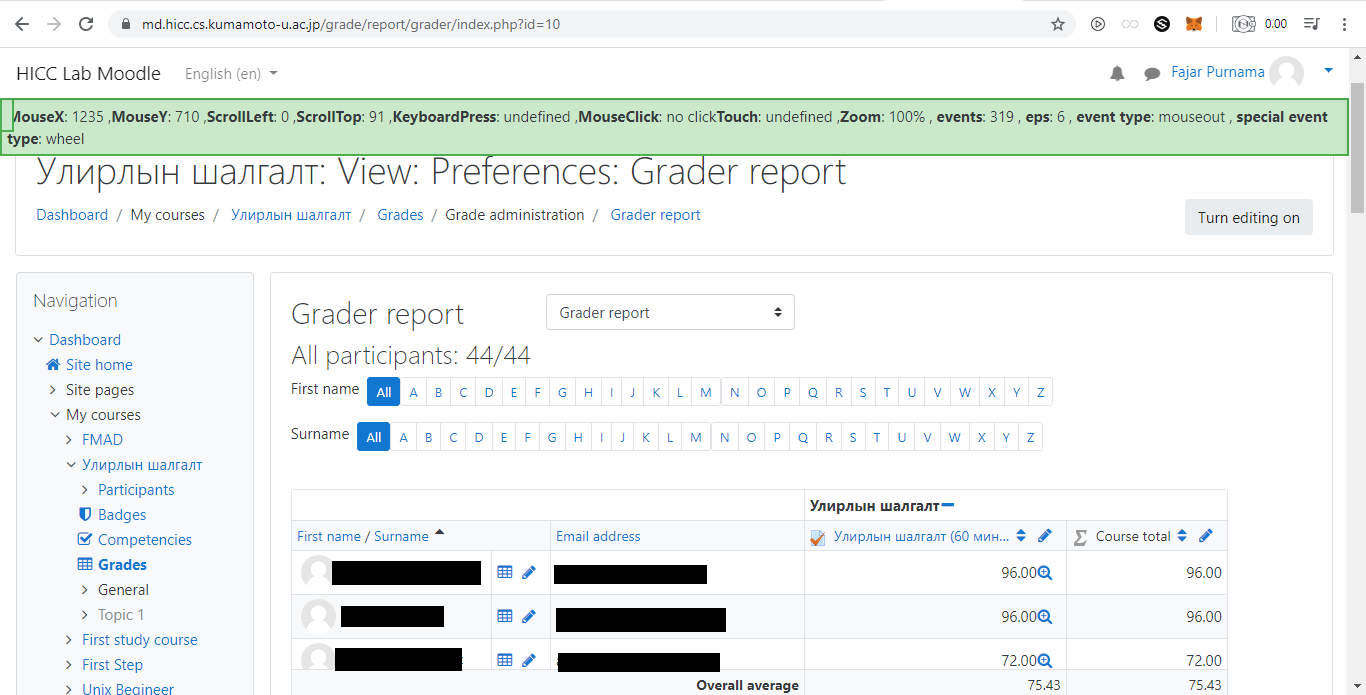
Figure 2.12 Screenshot of moodle grade of students from National University of Mongolia who attempted a quiz session on a Moodle server at Kumamoto University © (Purnama et al., 2020b).
2.3.2 Amount of Data Generated
The screenshot of mouse tracking log can be seen in Figure 2.13. Based on the data shared in Mendeley (Purnama et al., 2020a), the majority of the events are mouse movements and scrolls. That is because each change that occurred in either on the mouse cursor or scroll positions are captured. Rapid mouse movements or scrolls will generate large amount of data and how much depends on the capabilities of the computer. Theoretically, if the mouse cursor travels a distance of 1000 pixels than the number of mouse movement events generated are 1000, and if the scroll distance from top to bottom is 1000 pixels than the number of scroll events generated are 1000. In short, the capturing of geometrical data which is the x and y coordinates of the mouse cursor and scroll is the cause of the huge data generation. Also, the affect is multiplied to the amount of labels attached such as the user's identity that did the events, the place, and the time of the event occurrences. Just removing the URL label can save a lot of data space.
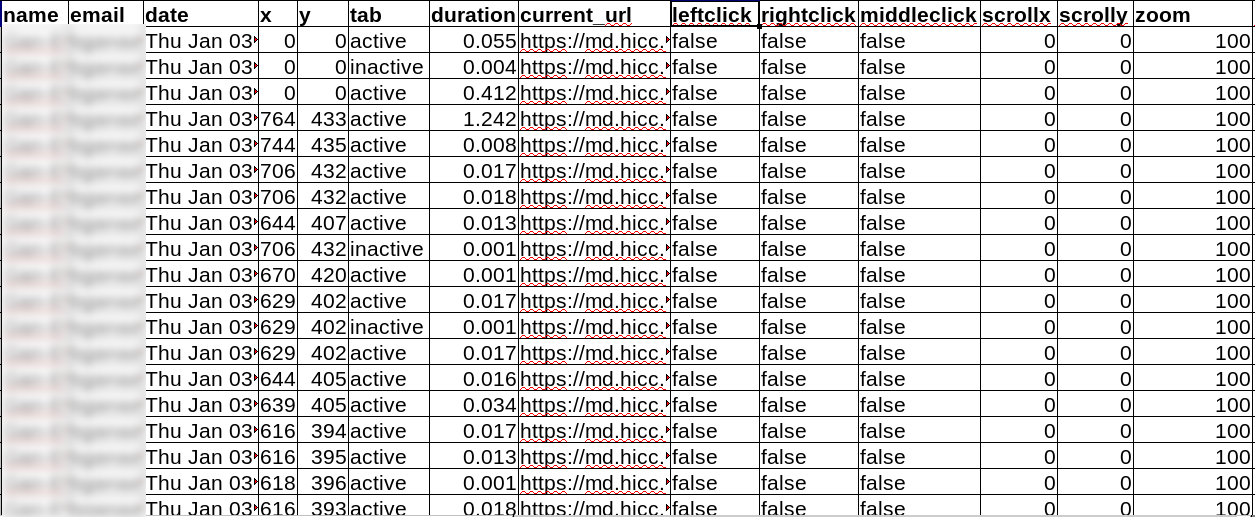
Figure 2.13 Screenshot of mouse tracking data of students from National University of Mongolia who attempted a quiz session on a Moodle server at Kumamoto University © (Purnama et al., 2020b).
During the quiz session, Figure 2.14 shows that a student is capable of generating a total over 20000 events which is over 80 Mega Byte (MB) transmission data. This means that student had to upload 80 MB of data at the end of the student's mouse tracking session in each page. According to Ookla, 2020 the global average network speed is 9.3 MBps downlink and 3.9 MBps uplink. This means there exist countries with the average network speed below that. Although nowadays are common for university size institutions to have network speed over 100 MBps, those resources are usually already allocated for many things. For example, the author's laboratory was only given 2 MBps network speed, meaning the mouse tracking session can flood the network. This explains why administrators are reluctant in implementing online mouse tracking. Imagine how much data can be generated if online mouse tracking is implemented by the whole university daily and full time.
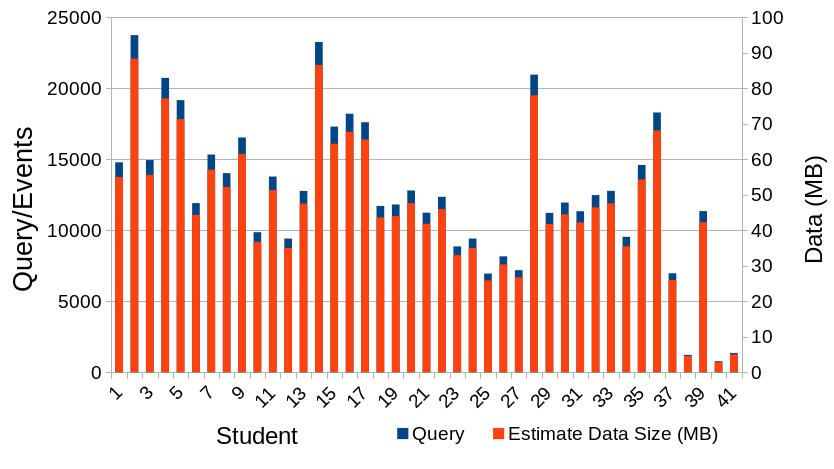
Figure 2.14 Total query/rows/events generated by each students during mouse tracking implementation between National University of Mongolia and Kumamoto University and its estimated total data transmission size © (Purnama et al., 2020b). The horizontal axis represents individual students, primary vertical axis is the query/rows/events, and secondary vertical axis is the estimated data transmission size.
The amount of mouse tracking data compared to page view and other conventional web analytic were almost incomparable. Table 2.3 shows that the moodle log and grade of the quiz session were only a few kilobytes while mouse tracking log is already over a hundred megabytes. In that table is also shown other logs that required long duration and many users to reach the amount of data that mouse tracking log has. While a few hard drive storage are enough to store conventional web and educational logs, many more hard drive storage are needed to store mouse tracking logs.
Table 2.3 Comparison of mouse tracking data size to daily pageview, Moodle log and grades, Nasa server log 1995, Open University learning analytics dataset, and HarvardX Person-Course 2013 © (Purnama et al., 2020b).
| Log File | Duration | Students | Size |
|---|---|---|---|
| Daily Pageview City Archive | 2 Month | - | 13 kB |
| Moodle Log and Grades | 3h 30min | 41 | 191 kB |
| Mouse Tracking | 3h 30min | 41 | 122 MB |
| Nasa Server Log 1995 | 23 days | - | 153 MB |
| Open University Learning Analytics | 1 Year | 32593 | 442 MB |
| HarvardX Person-Course 2013 | 1 Year | 301609 | 33.8 MB |