3 Online Mouse Tracking Resource Saving Methods
It is unfortunate that the online mouse tracking resource usages are too much for regular people to implement daily and full time except for special occasions only such as examinations. The ones who can implement online mouse tracking daily and full time are big institutions such as Amazon and Google. Therefore, on this chapter is discussed the novel method of this thesis to reduce the resource usage of online mouse tracking.
3.1 Existing Methods
Existing methods to reduce mouse tracking data transmission are common sense and popular methods where most of them were discussed by Purnama et al., 2020b. They are:
- Redundant data reduction which is mostly about reducing meta data such as shorting date format, shorting URL, avoiding duplicate or repetitive data, and exclude information deemed unnecessary.
- Sampling rate reduction which is adding delay to the event capturing. The default is to capture immediately such as every time the mouse cursor and scroll moves even if they are only by one pixel point while with sampling rate reduction, there are pauses in the capturing process for example every 50 milliseconds, 1 seconds, 2 seconds, etc. where the longer the interval the more the data reduction but at the cost of data resolution.
- Adaptive sampling where the application does not capture if the mouse cursor and scroll are idle, unlike usual eye tracking where the eye gazes are capture every certain interval even though the gaze's position does not change.
- Compression methods which were researched by Leiva and Huang, 2015 and Martín-Albo et al., 2016.
3.2 Real-Time Online Mouse Tracking
The conventional data transmission method is to transmit the data as a single package at the end of each mouse tracking session. Based on Figure 2.14, this conventional transmission method floods the 2 MBps network. The author anticipated this and implemented real-time transmission (Purnama et al., 2020b) method avoiding often 2 MBps flood which was reduced to data rate of average around 100 kBps. Although the average data rate is 100 kBps, Figure 3.1 shows many spikes where the difference between average and maximum is large which indicates that there were moments of high activities. The highest spike is around 800 kBps. The spikes are not only pointing upward but pointing downward as well which indicates that there are also moments of low activities. Overall, the standard deviation is high where there were times when activities were high and activities were low, thus precise data usage can be difficult to predict.
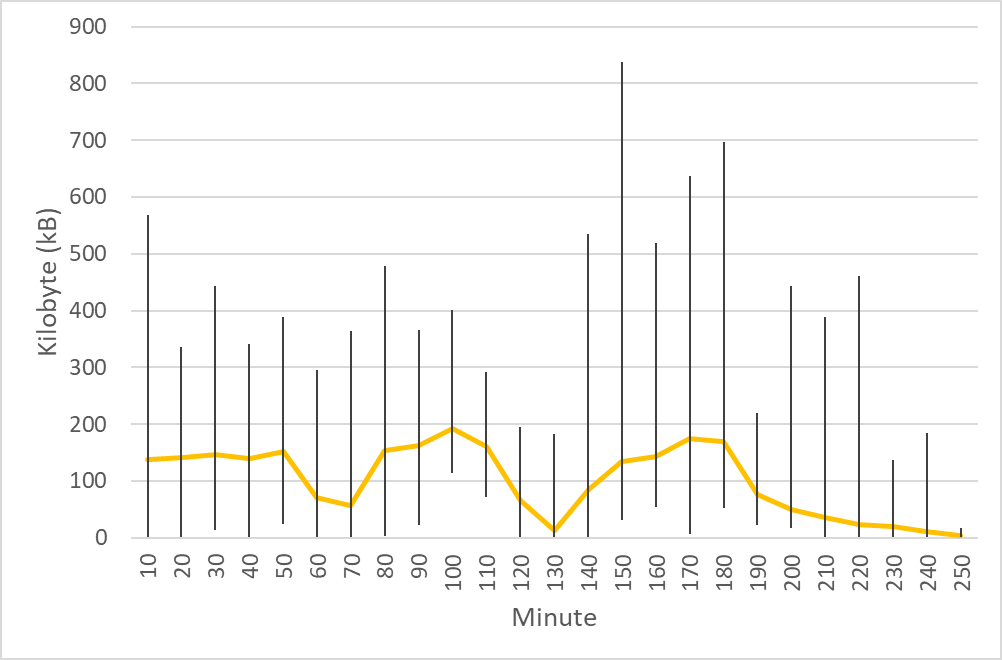
Figure 3.1 Data rate during mouse tracking implementation between National University of Mongolia and Kumamoto University. The horizontal axis represents 10 minute interval time and the vertical axis represents the data rate in kilobytes per second. The yellow horizontal line shows the average and the vertical lines shows the minimum and maximum during their respective interval © (Purnama et al., 2020b).
The difference between offline mouse tracking, online mouse tracking, and real-time online mouse tracking can be described on Figure 3.2. While offline mouse tracking stores the data in each of the users' computers, online mouse tracking transmits the data to the server. While conventional online mouse tracking stacks the data until the end of every session before transmitting as a single package, real-time online mouse tracking transmits the data immediately after an event occurs every time. Real-time online mouse tracking helps in reducing the probability of bottleneck as illustrated on Figure 3.3. This helps to balance the transmission load.
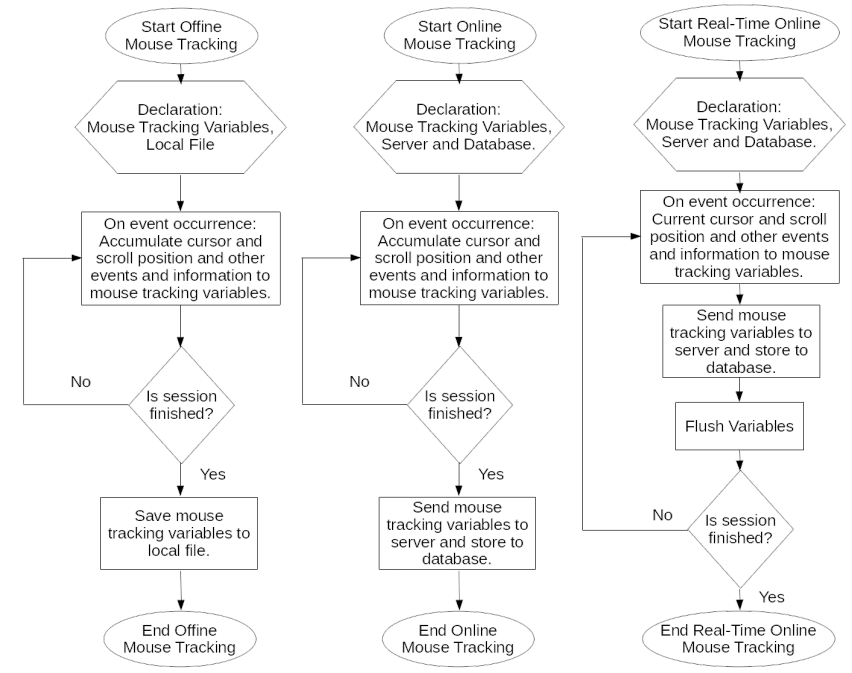
Figure 3.2 Flowchart of mouse tracking © (Purnama et al., 2020b): offline (left), online (middle), real-time and online (right).
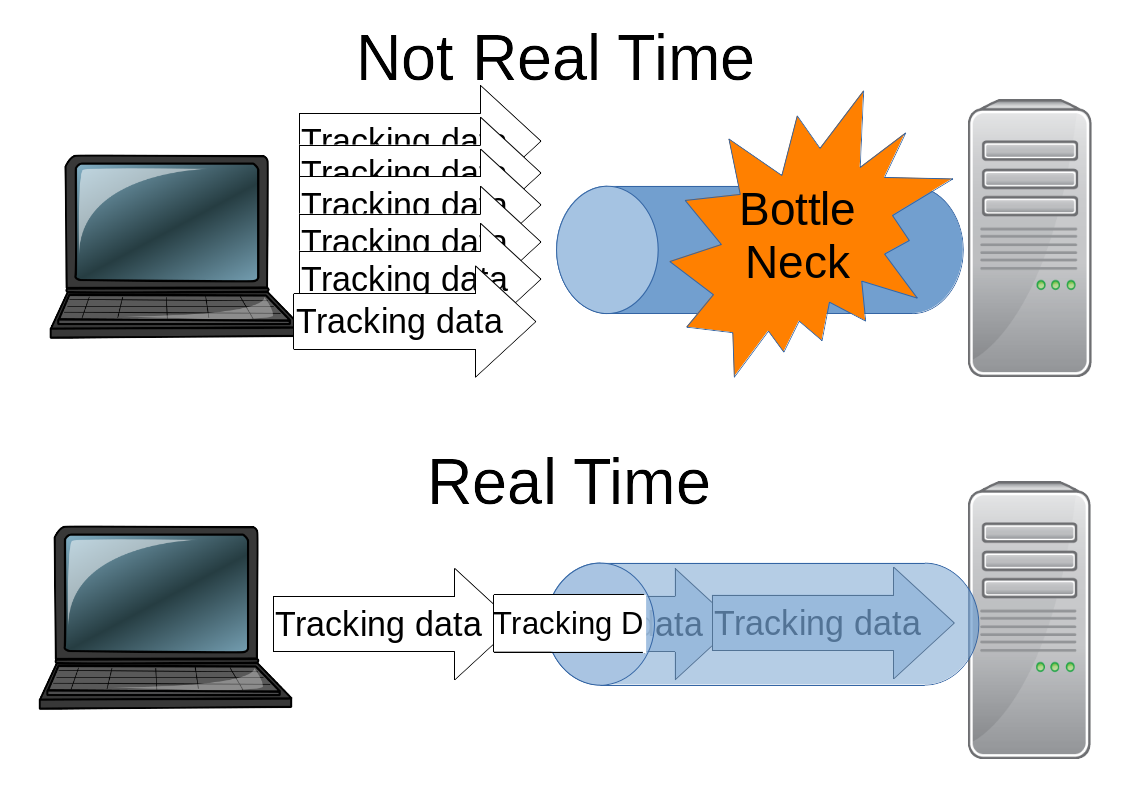
Figure 3.3 Illustration of bottleneck network in regular online mouse tracking and real-time online mouse tracking as a solution © (Purnama et al., 2020b).
3.3 Lossy Online Mouse Tracking
3.3.1 Three Mouse Tracking Preprocessing and Transmission Method
In the end of Chapter 2, it is known that the capturing of geometrical data which are the x and y coordinates of the occurred events and the time stamping of each events are the largest contribution to the data size. If the geometrical data can be reduced then the data size can be reduced as well. Based on many example mouse tracking data analysis, there are three possible cases illustrated on Figure 3.4:
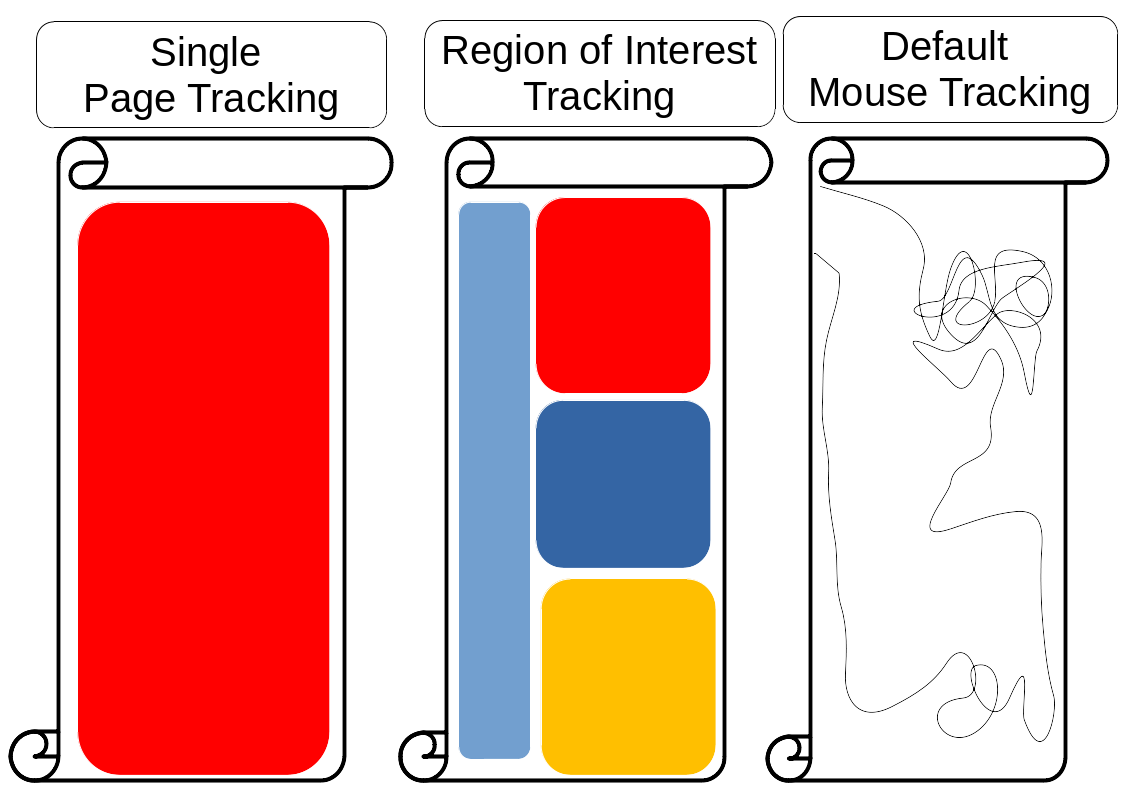
Figure 3.4 Whole page vs region of interest vs default mouse tracking illustration. The left scroll illustrates summarized event amount that summarizes the number of events occurring on the whole page; the middle scroll illustrates ROI tracking that summarizes the number of events occurring in defined areas, and the right scroll illustrates default mouse tracking that records every event and the precise point where it occurs, forming a trajectory.
- Default mouse tracking which is using all of the geometrical data when and where every events that occurred at each coordinate. An example of data visualization that can be generated by default mouse tracking is mouse trajectories and if the time is recorded as well, a video replay of the mouse trajectory can be generated.
- Summarized event amount which is not using any geometrical data where only the event amounts are captured not knowing when and where they occurred. Currently only the amounts of duration, mouse clicks, mouse movements, mouse scrolls, zooms, and keyboard typed of each session are captured, sacrificing the position and time information of these occurred events.
- Region of interest (ROI) mouse tracking which is using only selected geometrical data where the coordinates are summarized into selected areas. In other words, the mouse tracking is no longer able to identify the coordinates but only get the activity heatmap of the area. Currently the amounts of duration, mouse clicks, mouse movements, mouse scrolls, zooms, and keyboard typed of each session are captured on header, footer, navigation menu, and each of the quiz question area, sacrificing the exact coordinate information of each events. This method is actually a continuation based on previous work by Purnama et al., 2016 and Purnama, Fungai, and Usagawa, 2016.
By knowing the geometrical data that the analysers wants, the storage and transmission cost can be reduced by applying preprocessing and modifying the transmission method based on Figure 3.5. The default one is the real-time online mouse tracking where the event information is immediately sent to the server at the moment it occurred. For the summarized event amount, only the amounts of events are recorded excluding the place and time of occurrence. It is discouraged to update the event amount in real-time because that will cost data on the network. Instead, it is best to utilize the conventional transmission method where the final event amount value is sent only once at the end of each session (refer to Figure 3.2 online mouse tracking transmission not in real-time). Unfortunately, there are still some potential problems to this conventional transmission method implementation where if the user ends the session in haste, the time may not be enough to retrieve the mouse tracking from the client to the server and potentially losing the data. For ROI mouse tracking, the amount of events are accumulated when the mouse cursor is still within a specific area. When the mouse cursor moves to a new area, the event amount information of the previous area is sent to the server, and the process repeats. There is still a limit in determining and labelling web page areas. Usually, it is done manually by the analyzers but this way is very labor and time consuming. It is possible to determine and label areas automatically using offset DOM event, but not in a smart way where it depends on the layout of the web page. After the areas are determined for the ROI mouse tracking, the transmission method is a hybrid of conventional and real-time where the mouse cursor enters an area and accumulates the event amounts, then the result is transmitted after the mouse cursor leaves the area, and the process repeats upon entering a new area.
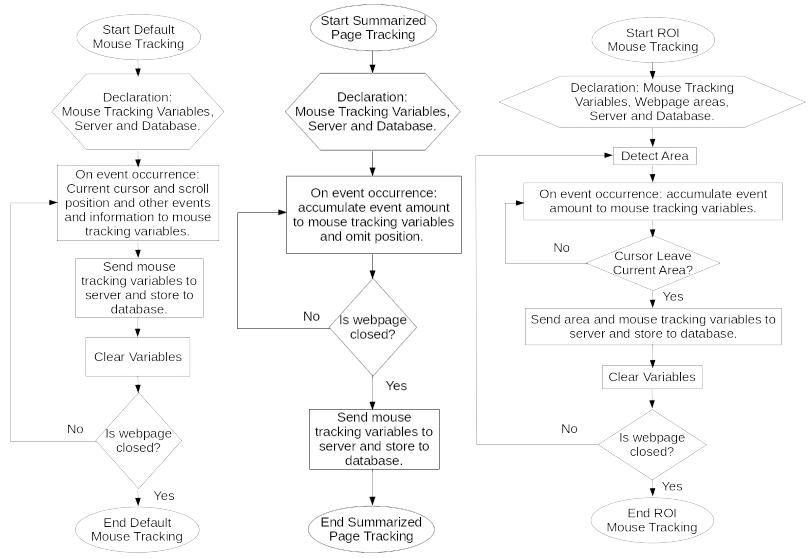
Figure 3.5 Three Types of Mouse Tracking Flowchart. The left flowchart is default mouse tracking, the middle flowchart is summarized event amount, and the right flowchart is region of interest mouse tracking (Purnama and Usagawa, 2020).
3.3.2 Three Mouse Tracking Preprocessing and Transmission Simulations
Since the author did not have another mouse tracking experiment opportunity, a simulation is conducted based on the previous mouse tracking experiment on Figure 3.6. It is possible to replay the scenario because the date of each events during the mouse tracking session was captured. However, there was a limit at that time that half of the students are using different time zone format which was difficult to simulate and half of the students are excluded leaving only 23 students.
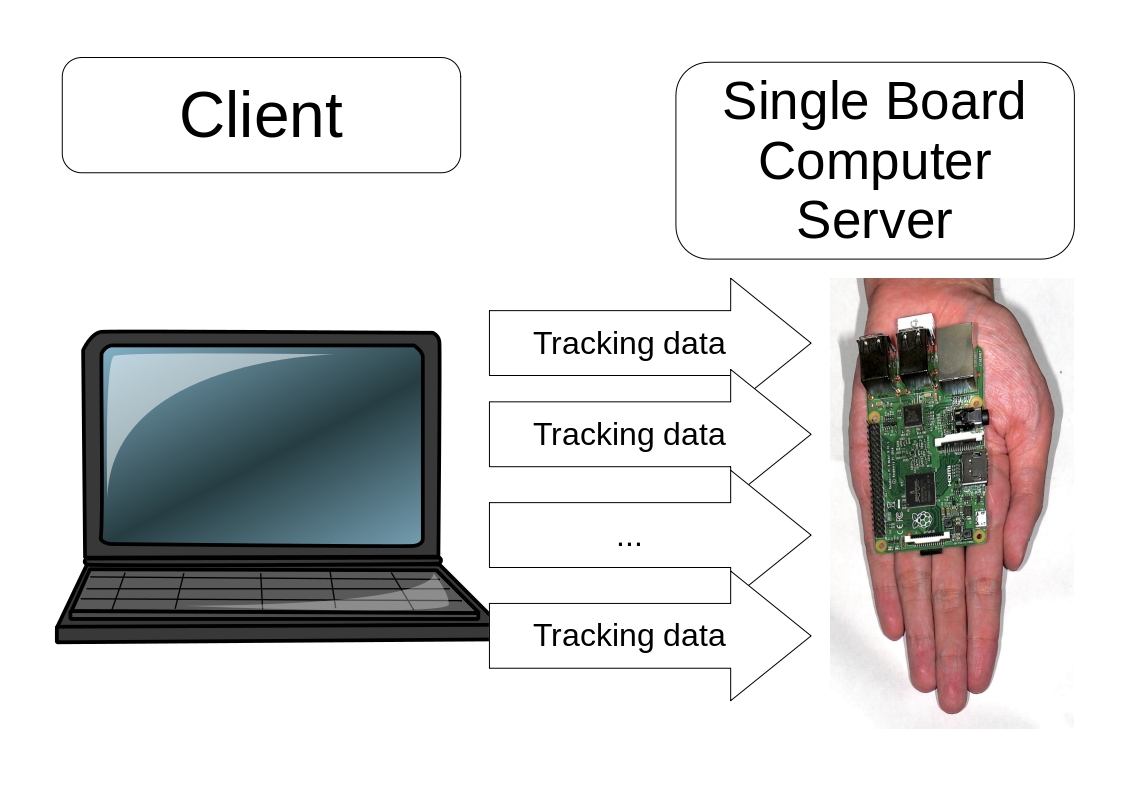
Figure 3.6 In Purnama and Usagawa, 2020 the simulation is based on Figure 2.10. In this thesis, the server is changed to single board computer Raspberry Pi 3. The reason is to support regions with limited connectivity in Figure 3.7.
Additionally in this thesis, the author simulate the mouse tracking on a single board computer Raspberry Pi 3 to sympathize with those that are in limited connectivity region where the method of mouse tracking quiz session is locally illustrated in Figure 3.7. Also, it is interesting to see how much the Raspberry Pi 3 can handle mouse tracking simulation in terms of CPU and RAM.
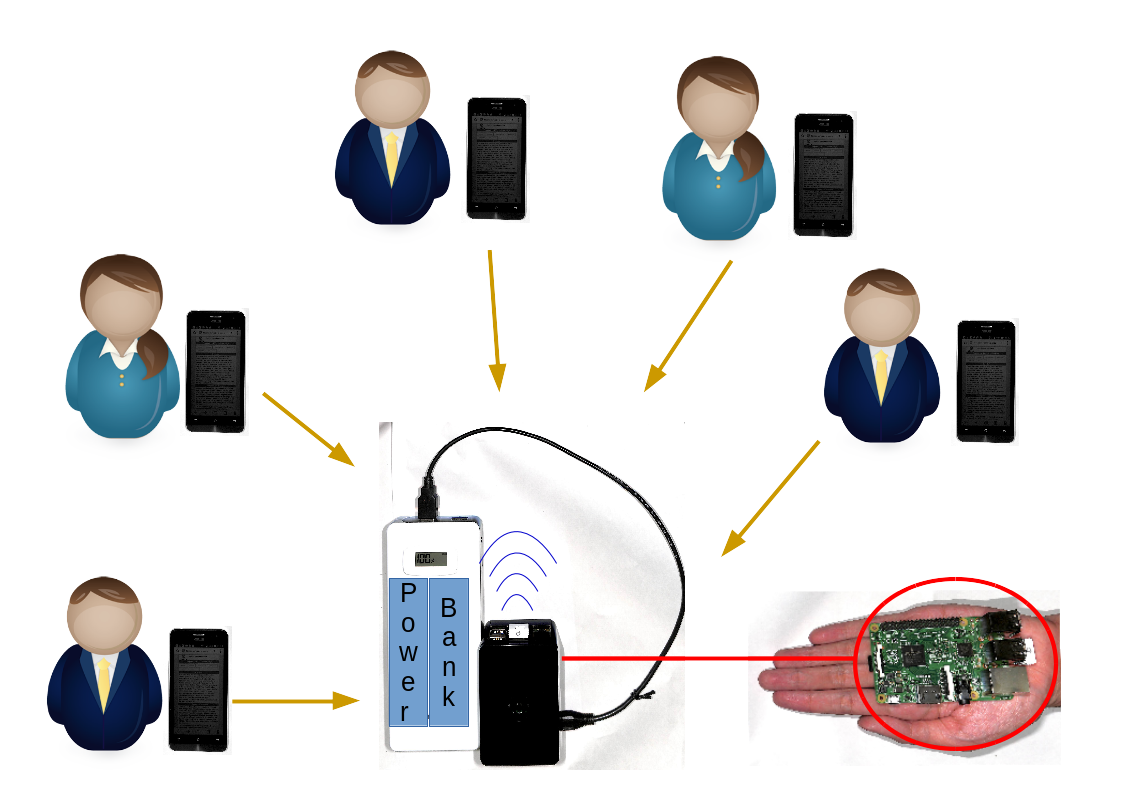
Figure 3.7 Even though the ownership of computer and mobile devices increase drastically, the pace of Internet penetration may not be as fast. Those who are in limited connectivity region may not be able to enjoy online quizzes, let alone mouse tracking. Therefore Purnama et al., 2017 offers a hand carry server solution where the students' computer devices can connect to the teachers' single board computer server that runs quiz and mouse and touch tracking.
Five mouse tracking simulations are performed on a quiz page with a size or dimension of 1920x1080 pixels:
- Default mouse tracking simulation without changes in the original mouse tracking data.
- ROI mouse tracking where the coordinates are summarized into certain areas for each users. The summarising is based on the flow of time domain where a query based on the summarized coordinates is generated every time a user leaves an area and not a total summary of each area where more information can be found on Appendix A:
- ROI mouse tracking 1 where the coordinates are summarized into 50 areas which consists of header, title, quiz navigation, navigation, administration, footer, each quiz flags, each quiz questions, each quiz answers, and blank areas.
- ROI mouse tracking 2 where the coordinates are summarized into 35 areas where the quiz questions and answers each are summarized or combined.
- ROI mouse tracking 3 where the coordinates are summarized into 20 areas where the each quiz flags are summarized or combined to their respective quiz areas.
- Summarize amount of events mouse tracking simulation where the data is transformed by summarizing the event amounts of each users into a query and sent the queries based on the end session time of each users.
3.3.3 Three Mouse Tracking Preprocessing and Transmission Results
The result is that a great reduction in data size is achieved by sacrificing some geometrical data for ROI mouse tracking and all geometrical data for summarized event amount shown on Table 3.1. Surprisingly on the user side, the script total execution time on the browser was also reduced shown on Figure 3.8. The transmission cost was also reduced shown by the reduced data rate on Figure 3.9 which is also in parallel to the server's CPU and RAM usage.
| Type | Queries | Data Size |
|---|---|---|
| Default Mouse Tracking | 286510 | ∼100 MB |
| ROI Mouse Tracking 1 | 28048 | ∼7.7 MB |
| ROI Mouse Tracking 2 | 19061 | ∼5.3 MB |
| ROI Mouse Tracking 3 | 17880 | ∼4.9 MB |
| Summarized Event Amount | 23 | ∼16 kB |
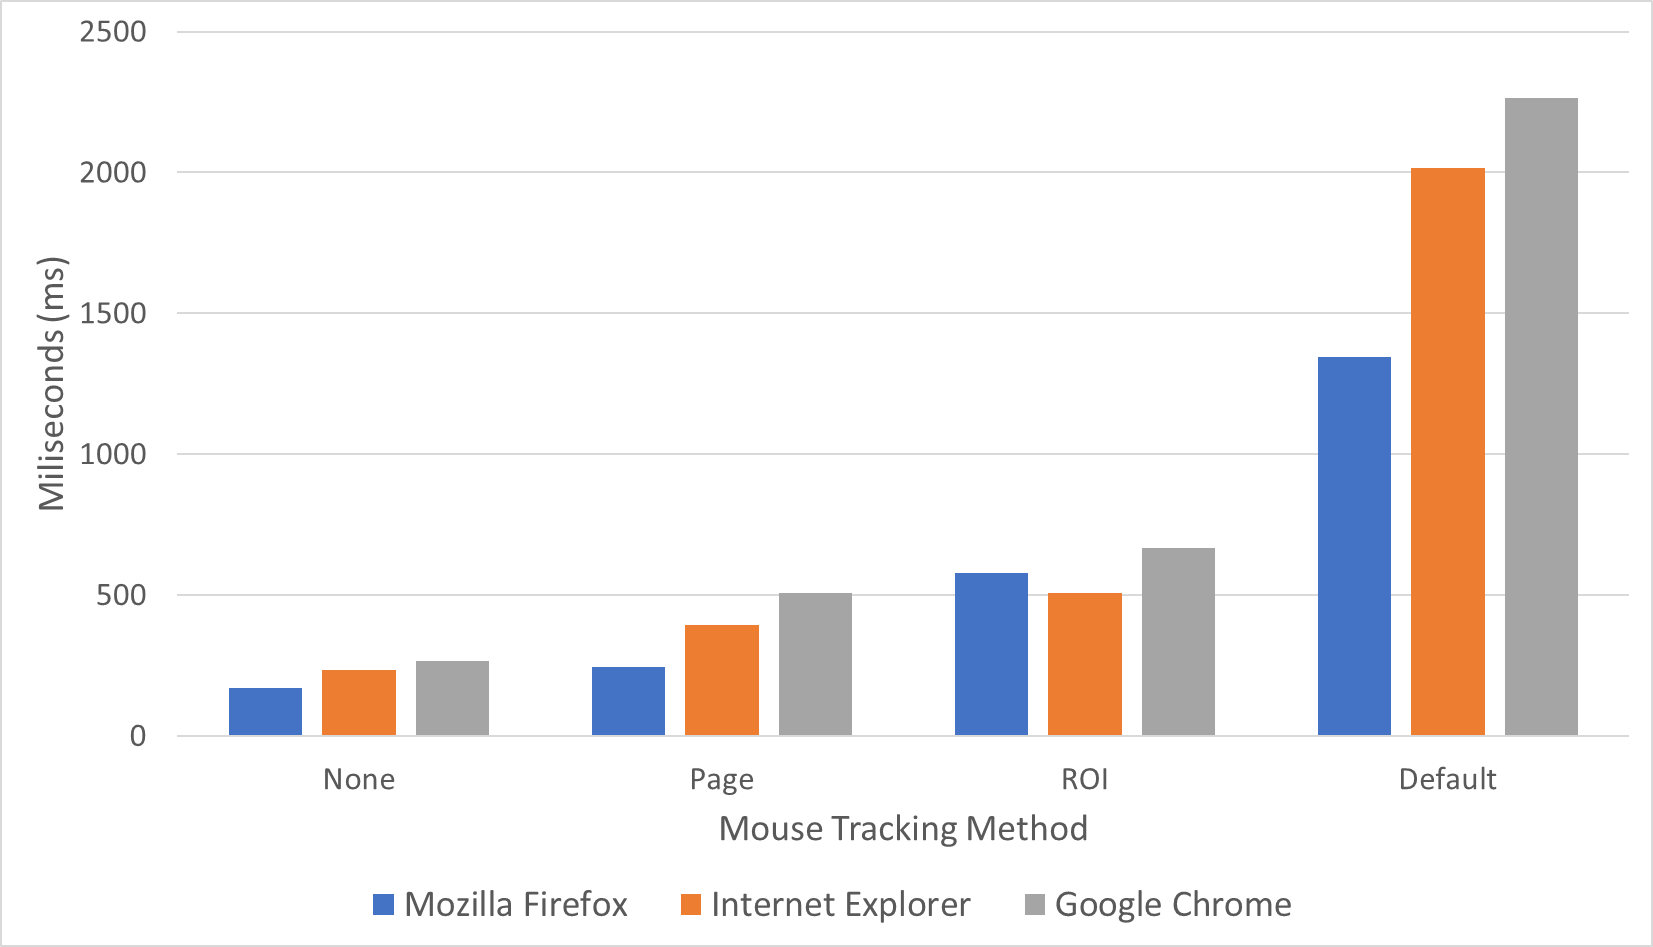
Figure 3.8 The total script running time of three mouse tracking demo session by the author. The horizontal axis is the mouse tracking method. The data in order are from Mozila Firefox, Microsoft Edge, and Google Chrome. The vertical axis is the total running time in milliseconds. Among the three browsers Mozilla Firefox performs faster than Microsoft Edge and Internet Explore performs faster than Google Chrome for this work u, 2020.
The Raspberry Pi's CPU is not strong enough to handle the default mouse tracking simulation of around 20 users where the CPU often reach 100% usage. Even the RAM usage is abnormally high over hundreds of MB. However, it is able to handle ROI mouse tracking and summarized event amount method. This shows how useful the data reduction method are.
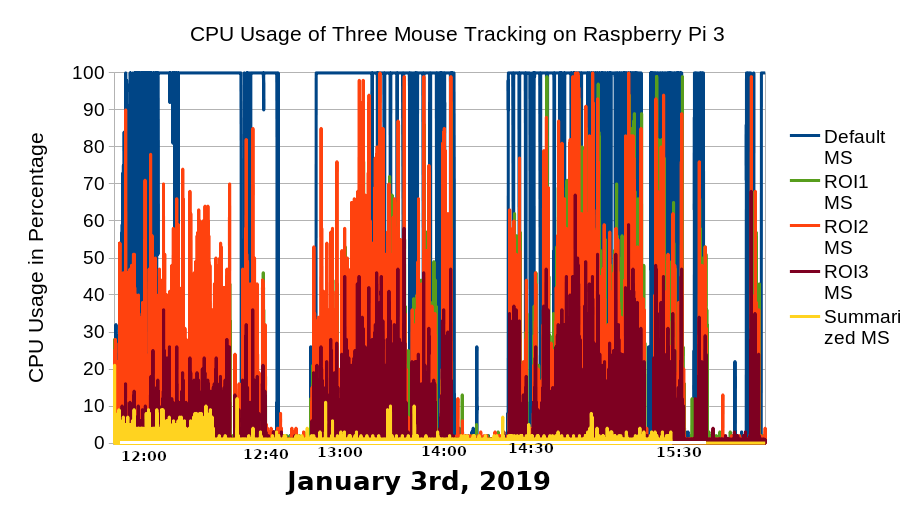
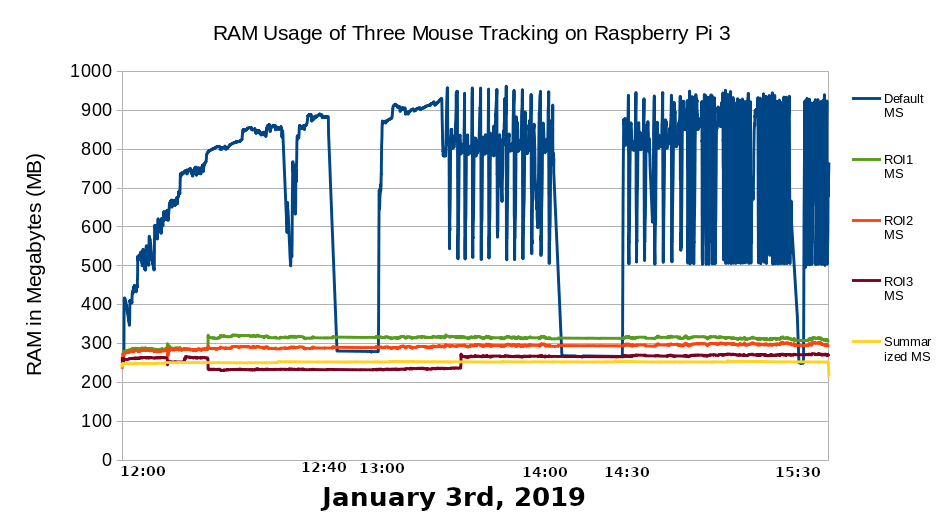
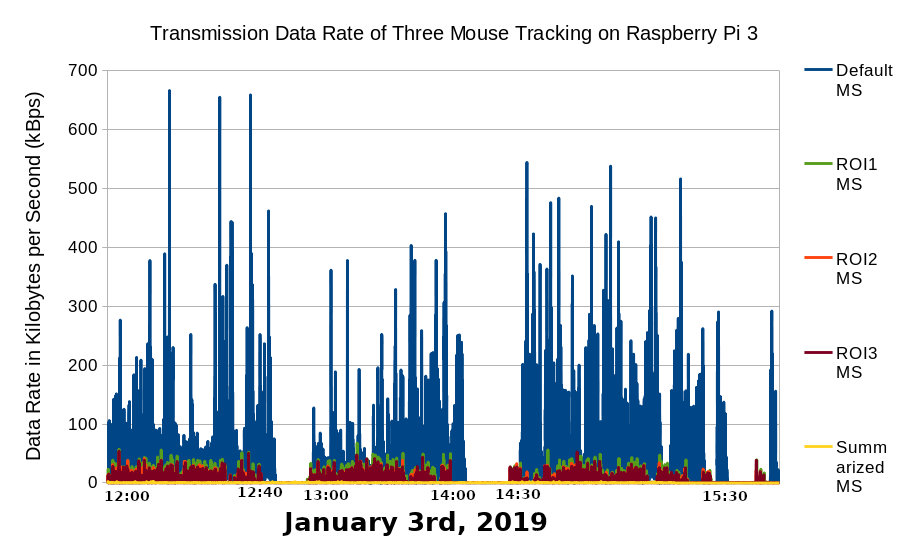
Figure 3.9 CPU and RAM usage and data rate comparison between default mouse tracking, summarized event amount, and ROI mouse tracking.
Among the three mouse tracking method, the summarized event amount method is the maximum resource reduction because all the geometrical and time data are excluded or simply only consist of one area. Theoretically, the amount of query is reduced to one per mouse tracking session. For the ROI mouse tracking, does not necessary always result in large resource reduction like the result in this thesis. Theoretically, it depends on the area division of the web page. The smaller the division, the larger the area, the larger the resource reduction, and vice versa. By performing more division, the areas become smaller, the resource usage becomes larger, and eventually the area will become as small is coordinates if areas are kept being divided which will become the same as default mouse tracking.
3.3.4 Synchronization for Hand Carry Server Quiz
The teacher may decide to conduct the quiz locally using hand carry server illustrated in Figure 3.7 for various limited connectivity reasons such as expensive or unstable Internet connection. If the log data is only for the teacher to use, then all is well, but if it is for institutional use, the teacher may have to synchronize the data to the institution's server. It will be wise to use incremental synchronization method illustrated on Figure 3.10 to reduce data especially for large data like mouse tracking log.
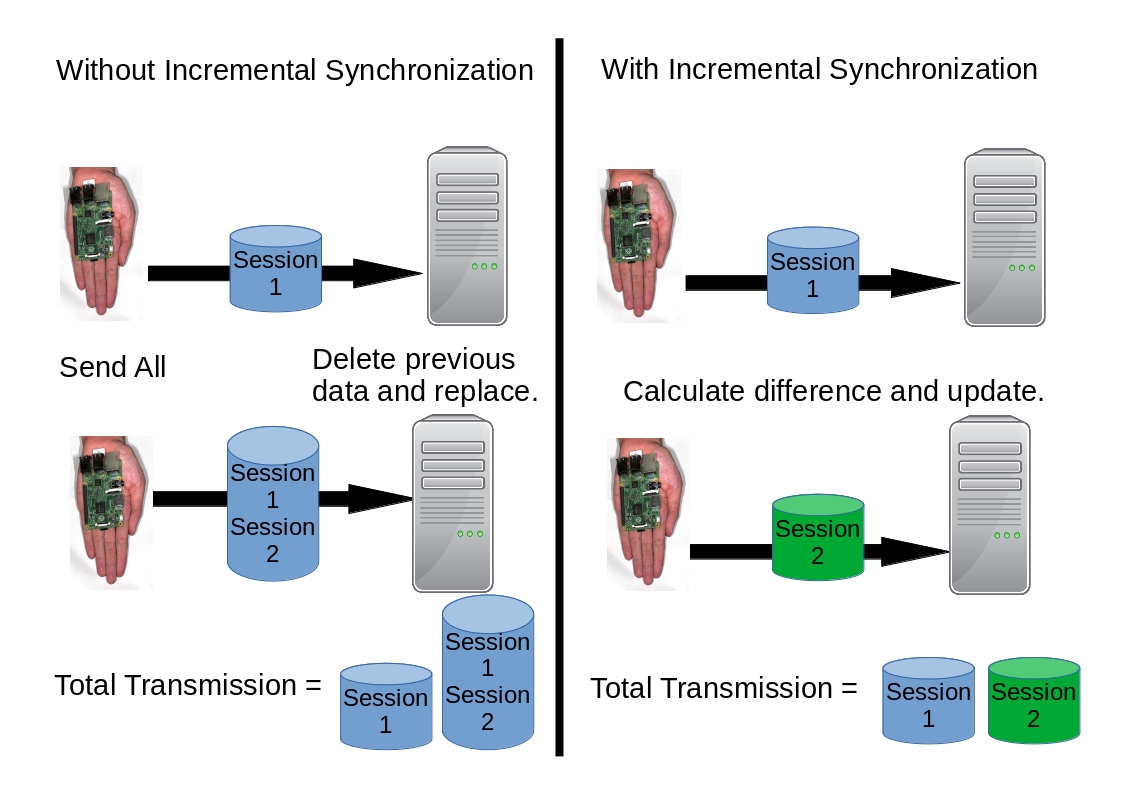
Figure 3.10 Suppose there are two quiz sessions like the one in this thesis. The teacher have to synchronize the data two times which are after the first session and after the second session. Although the human mind knows that it is better to update, the computer today still does not operate that way. Even the default copying in most people desktop still functions as copying the whole data and replacing the old shown on the left. Today, a separate application must be used to perform incremental synchronization shown on the right that is able to calculate the difference between the old and new data © (Purnama, 2017).
There are two ways to perform incremental synchronization. The first one is to store the data in Structured Query Language (SQL) which is mostly used in database applications. SQL stores the data in form of table and to update is just sending new rows from the teacher's database to the institution's database. Most log data are in unidirectional incremental/addition fashion which is why SQL is mostly used. However, if the update is more than just incremental such as correction where there are deletion and modification than it is more complicated for SQL to handle (Purnama, Usagawa, Ijtihadie, et al., 2016). The most popular algorithm to handle this update is the rsync algorithm illustrated on Figure 3.11. Example use case are when teacher forgot to exclude private data when privacy is a concern and accidentally upload to the server. In this case, the teacher would want to remove the private data in each query where rsync can save resource cost. Though, this is less likely to occur. A more realistic case is a teacher needed to update their quiz contents from the server where the update is made of addition, deletion, and relocation.
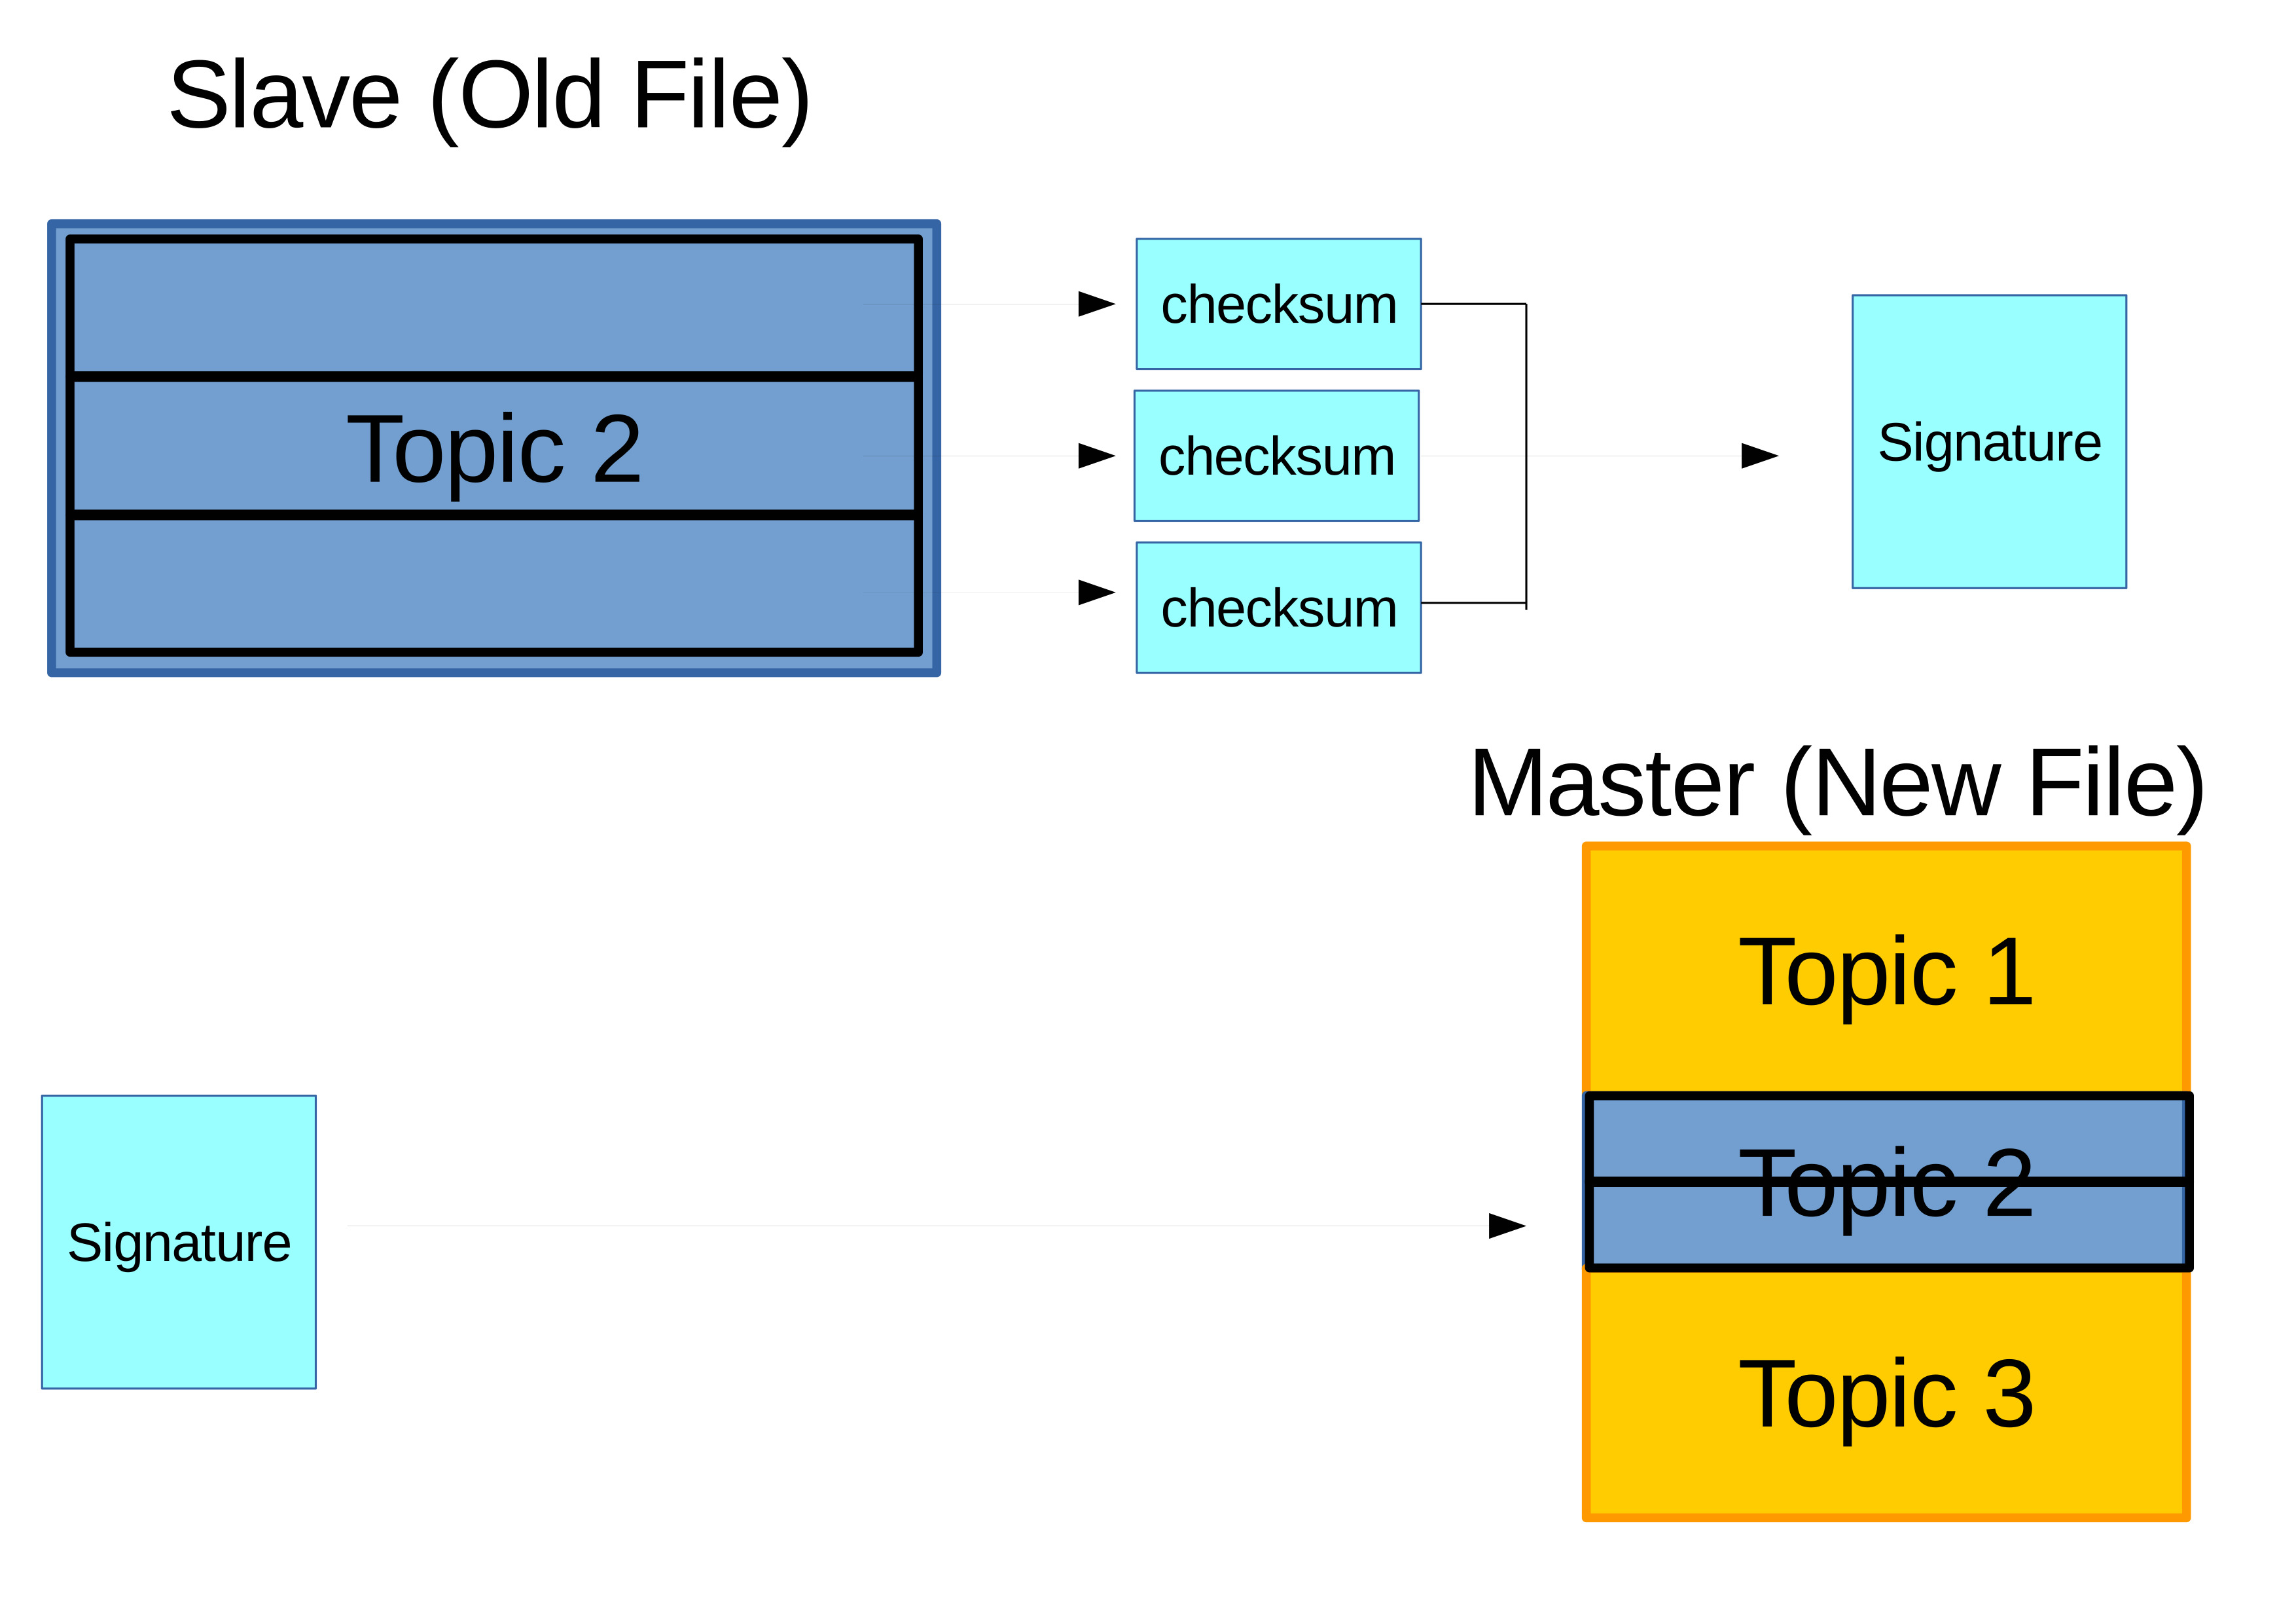
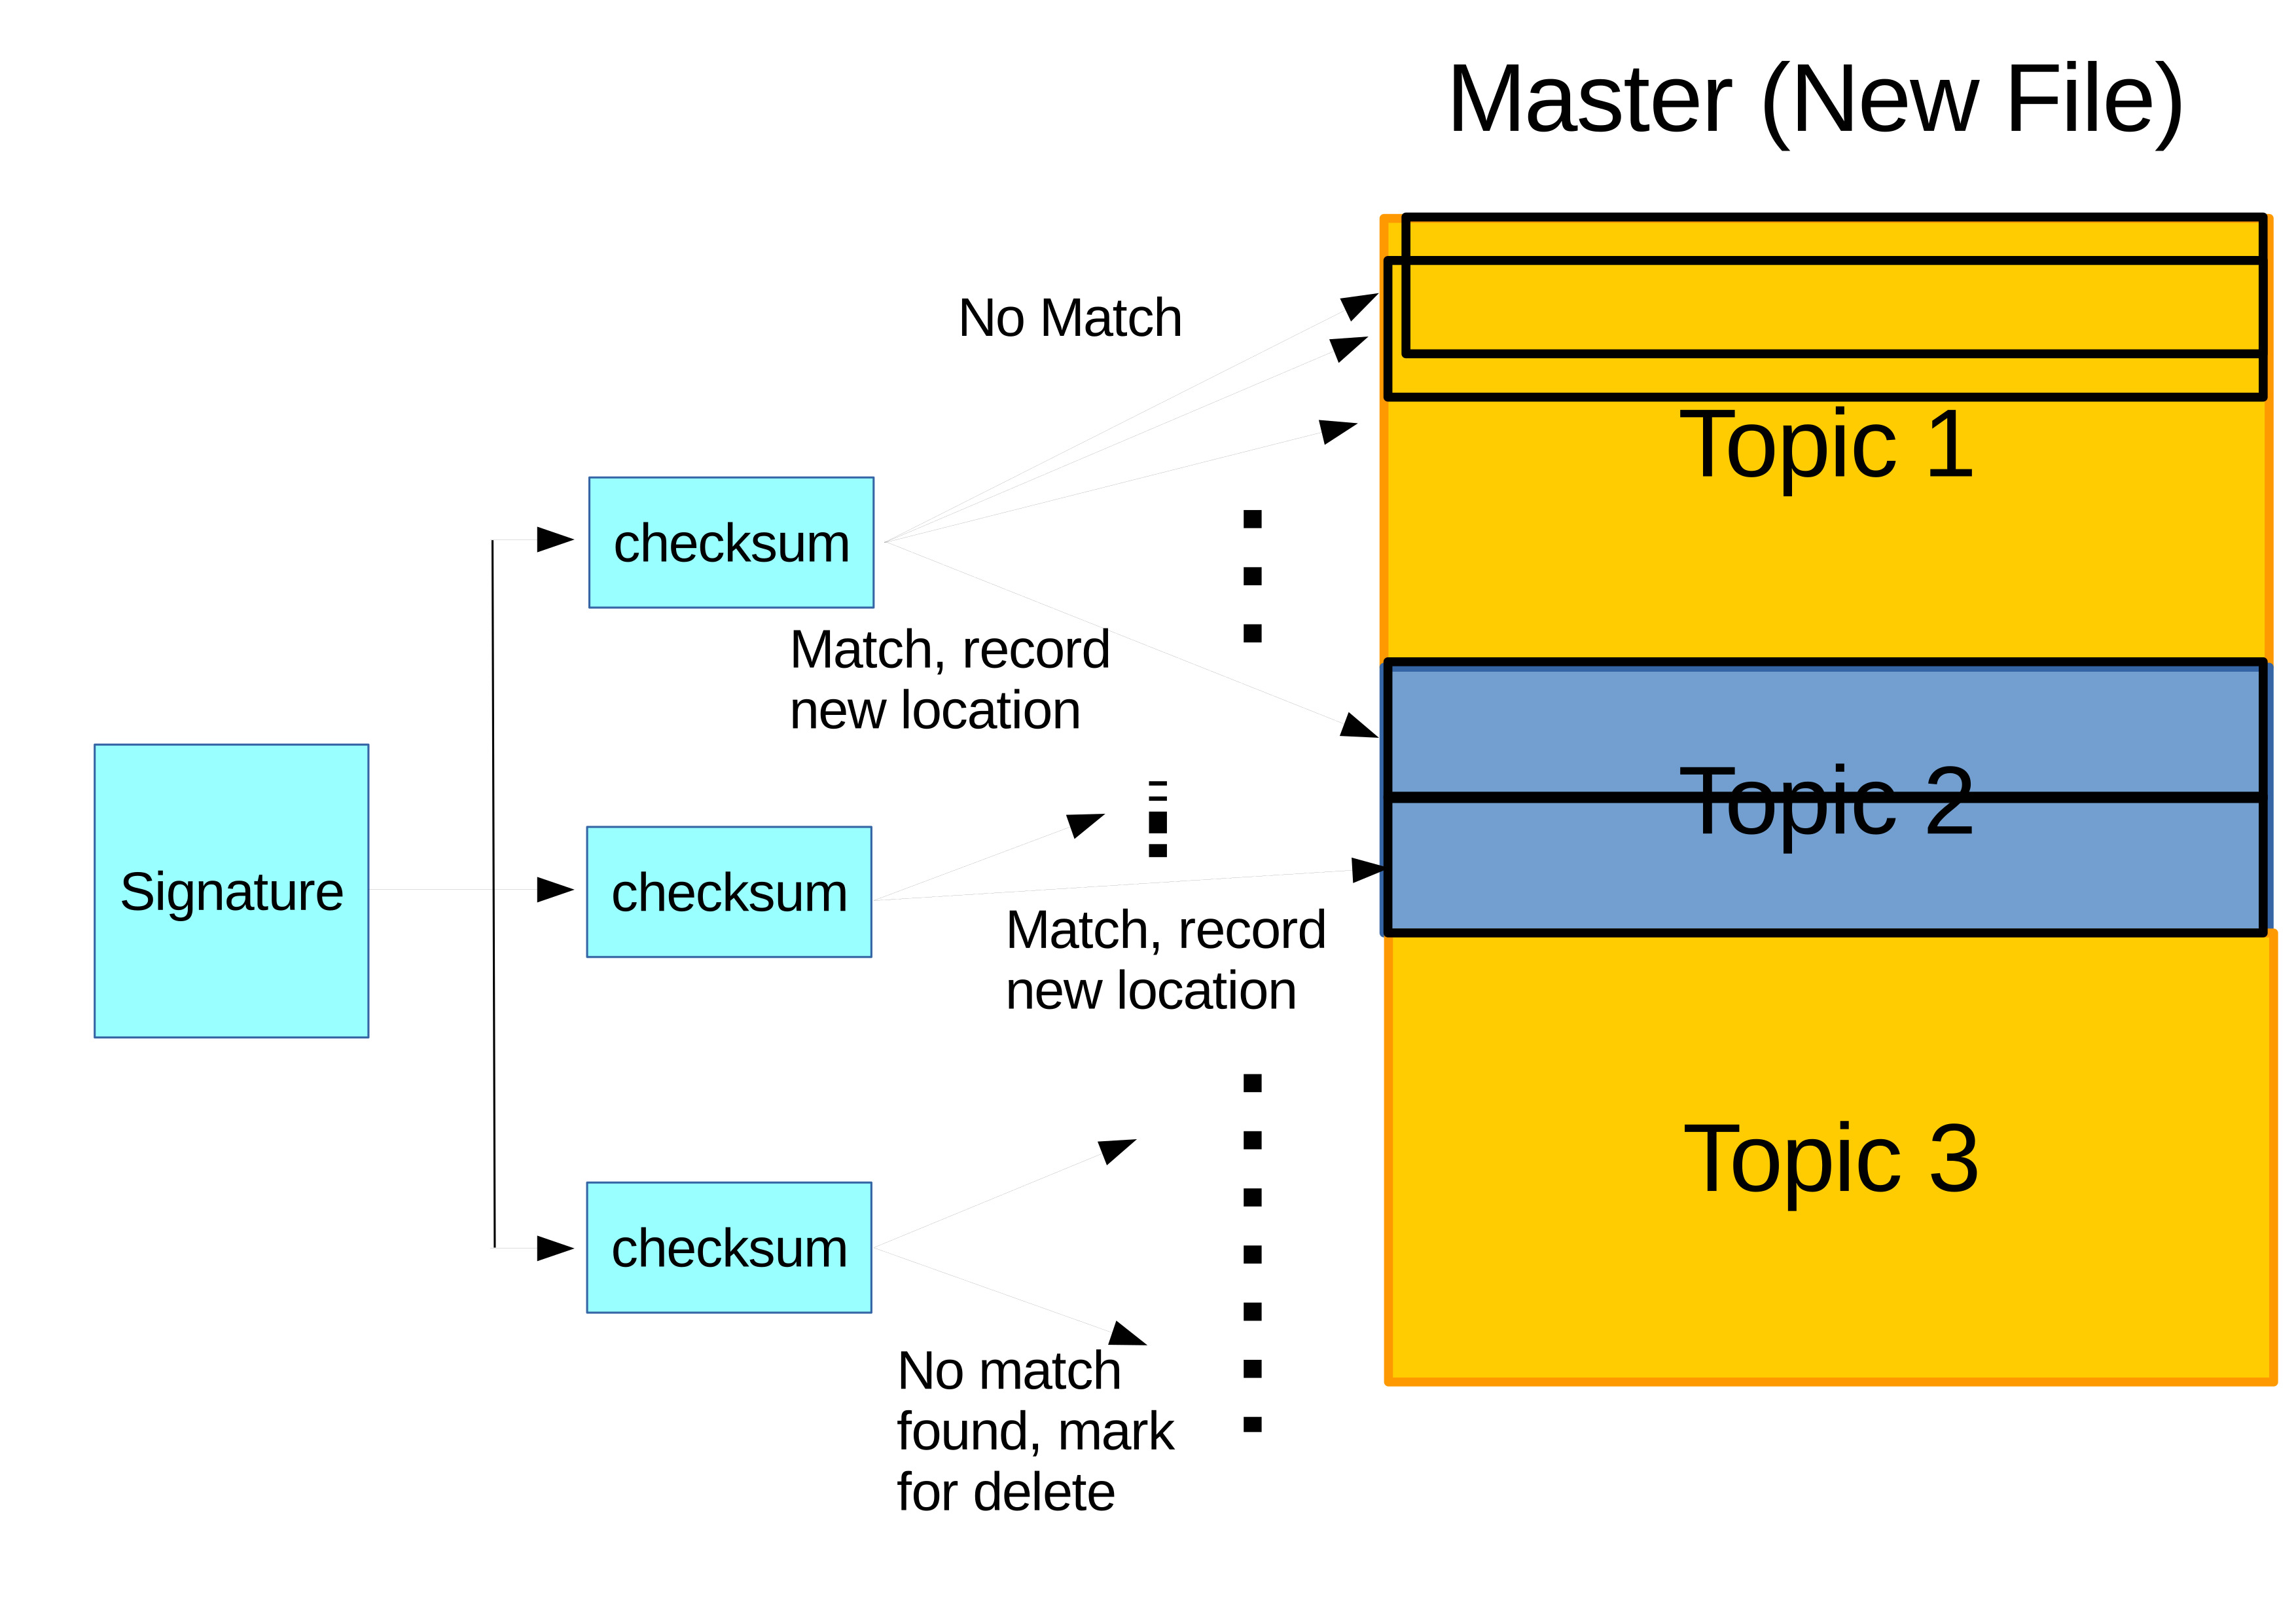
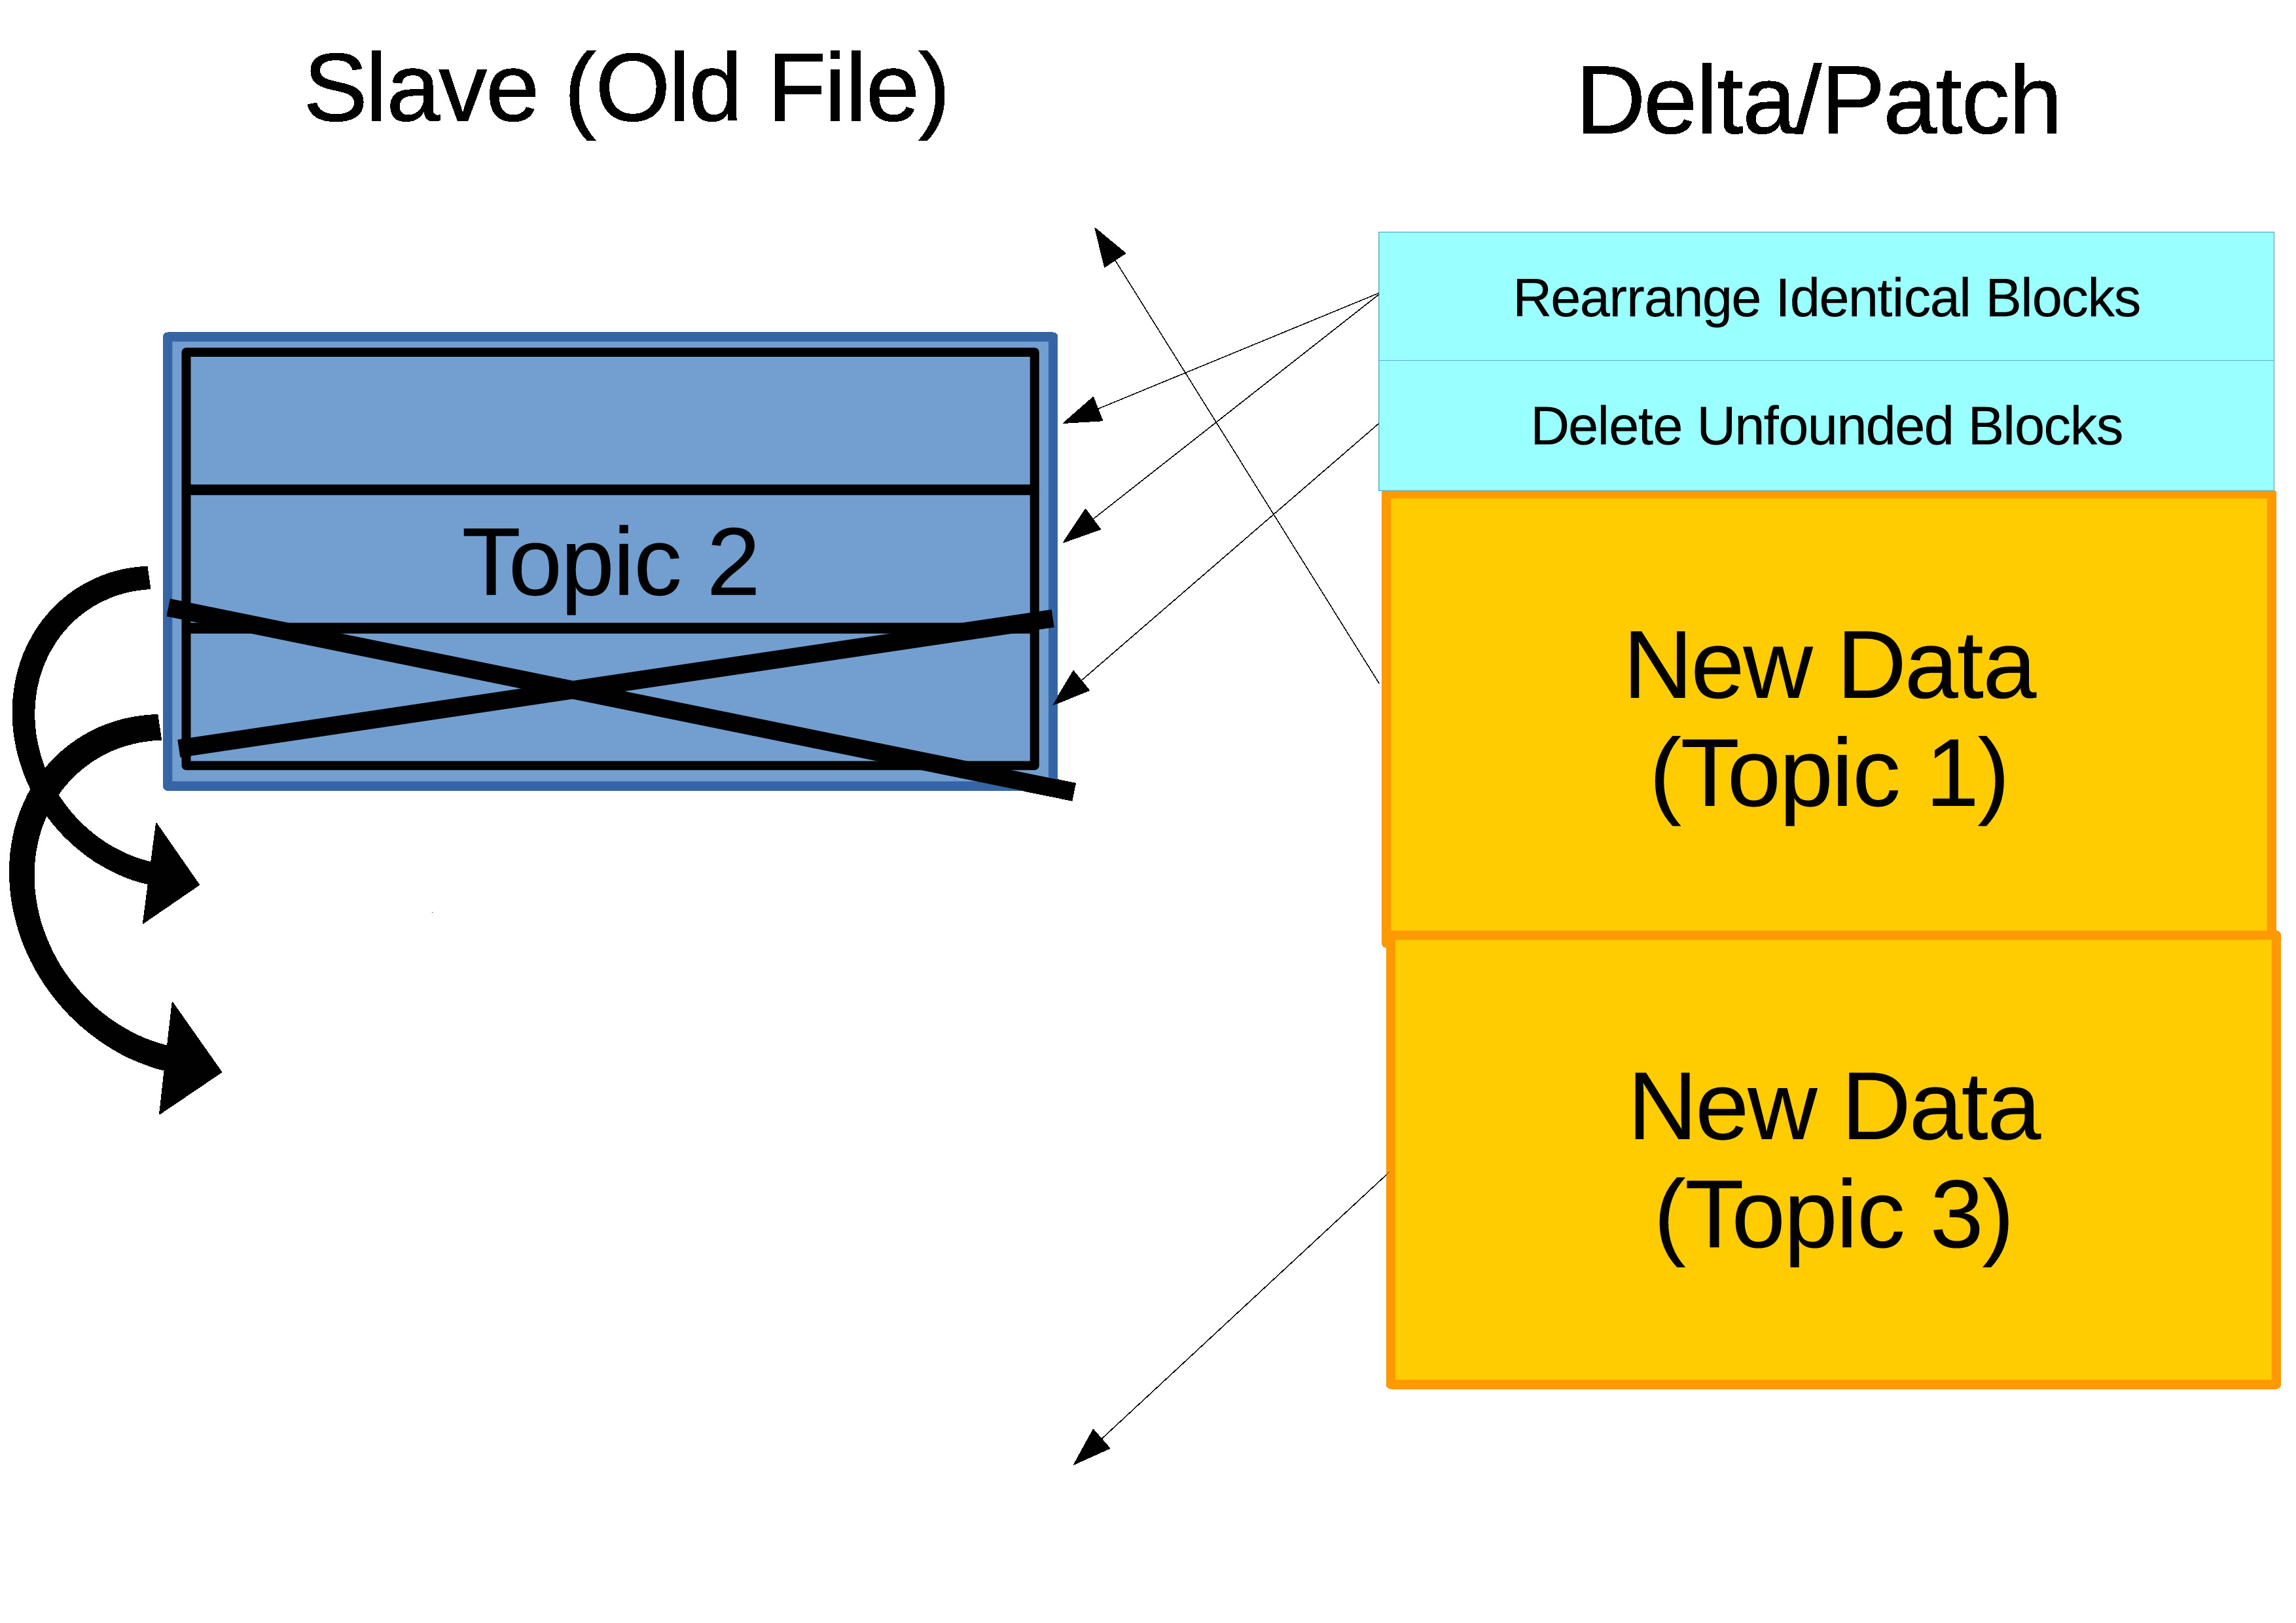
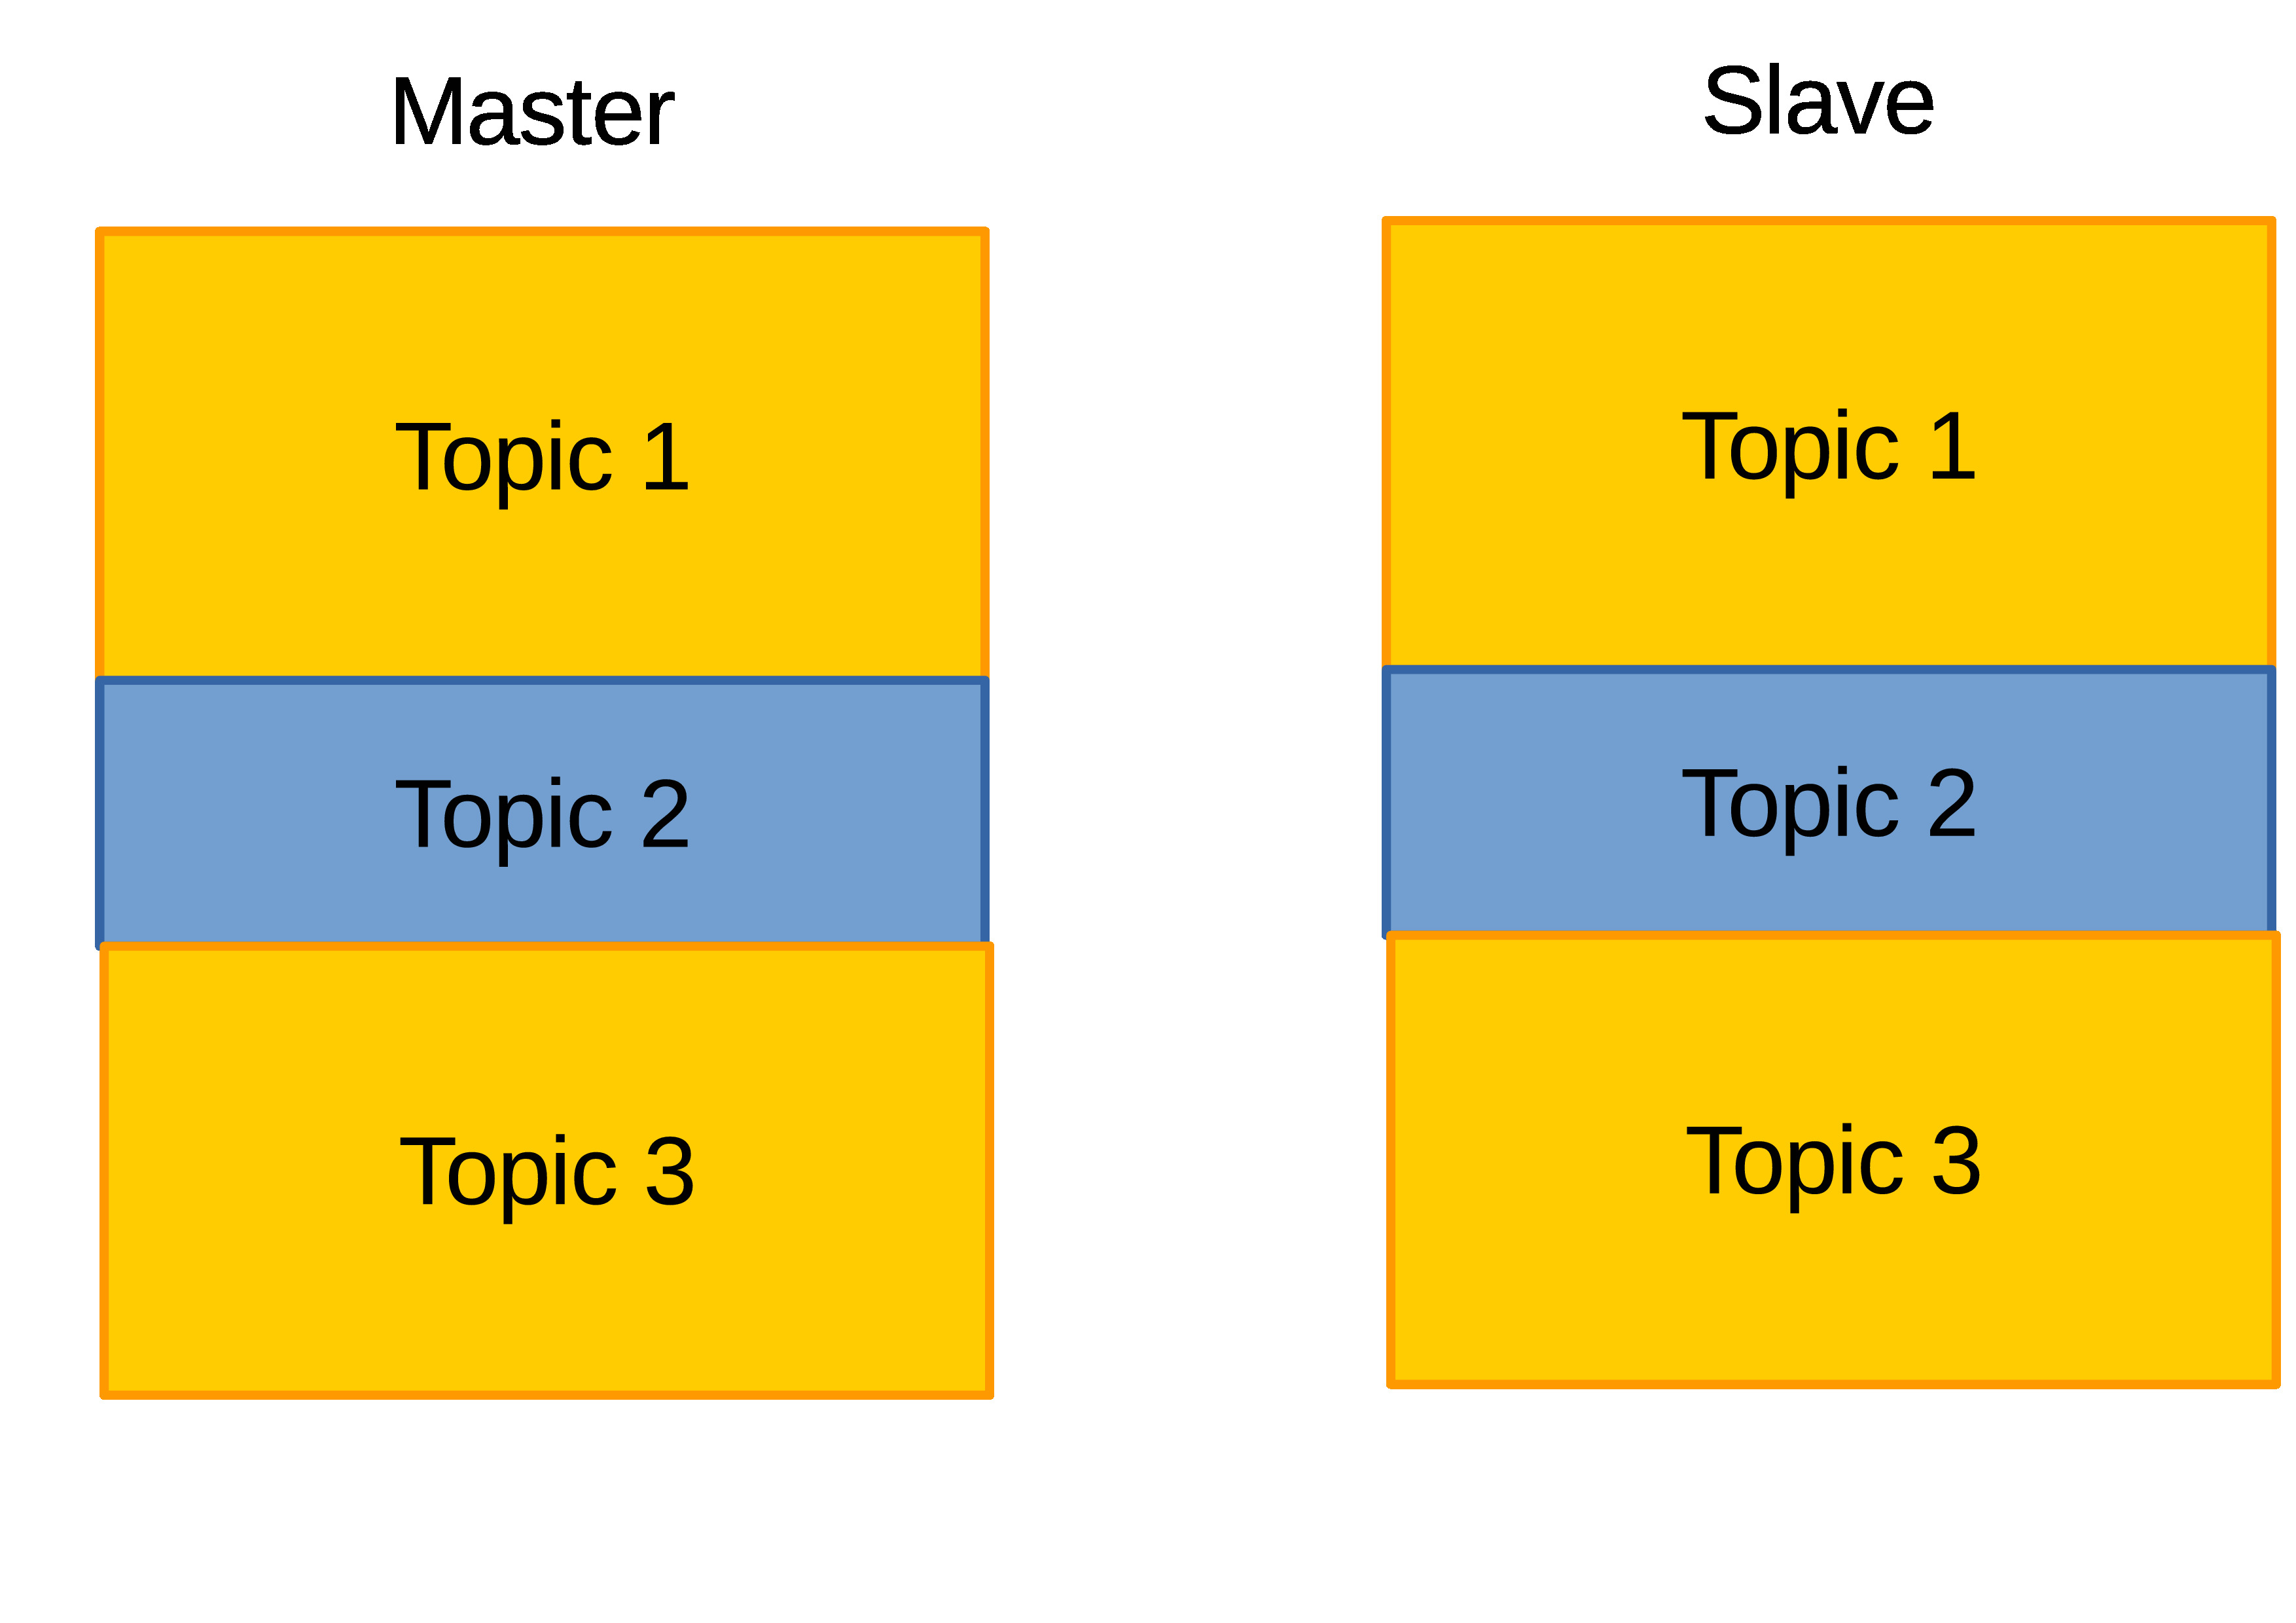
Figure 3.11 A detailed illustration of the rsync algorithm procedure where the steps in summary are splitting the data into blocks, scan for blocks relocation, and scan for blocks that does not exist where they can be to be newly added blocks or unused blocks to be deleted. Finally, execute relocation, addition, and deletion based on the obtained information from the scanning (Purnama, 2017).
4 The Depth Levels of Logs
Back in Chapter 1, it was emphasized that conventional web logs and educational data have a limitation regarding to the information that they can derive. Mostly, it was about how those conventional logs could not capture the users or students behavior online. Eye and mouse tracking solves that problem by capturing how the students interact. It took some time for the author to understand and conceptualize the meaning behind those repeating statements about what conventional log data cannot tell while eye and mouse tracking log can tell. It turns out to be that the depth level of those logs are different where eye and mouse tracking logs belong to a deeper level than conventional logs.

Figure 4.1 Six level of web logs in order from most shallow to deepest are Internet, websites, categories, web pages, area, and coordinates.
This thesis defines six depth level of web logs from browser content point of view shown on Figure 4.1. Most analyzers do not know that there are deeper level of logs. Most tools do not generate data in deeper level than web page level logs. The web log depth levels converted to educational data can be illustrated on Figure 4.2. Most educational tools only generate logs up to course content level which are mostly how many time the students attempts the activity and what grade they received. This chapter discussed the three deepest log levels and explained how mouse tracking belongs to the deepest log level.
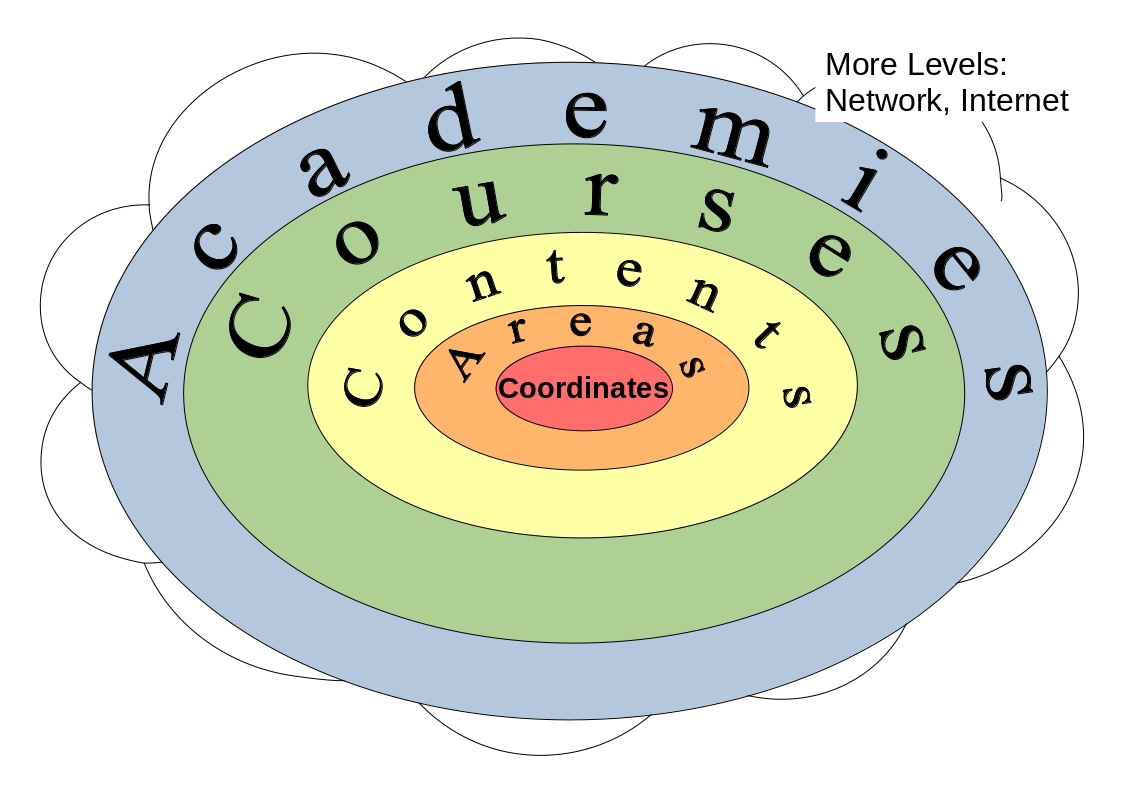
Figure 4.2 Six level of educational data in order from most shallow to deepest are Internet, academies, courses, course contents, area, and coordinates.
4.1 Web page / Course Content Level Logs
4.1.1 Conventional Web Logs and Educational Data
The conventional web logs belongs up to the web page level log. They are mainly page views which shows that a web page from a certain website and category have been viewed (Bluehost, 2016). Additional metadata can be attached to the page view:
- "Who", the identity of the viewer can be identified if the viewer register to the website, provides identity on the browser and gives permission to identify, or if not then the internet protocol (IP) address of the viewer can be captured.
- "Where" can be the link of the web page or the location of web server and viewer if they are identifiable.
- "When" is usually the date and time of the occurred page view or any action. More specifically, the duration can be calculated.
- "What" is usually the action of the viewer labeled by the analyzer. If the web page is a reading content then the viewer's action is labeled as reading. If it is an audio content then the viewer's action is labeled as listening. If it is a video content then the viewer's action is labeled as watching. If it is a forum then the viewer's action is labeled as discussing and etc.
As page view belongs up to the third deepest level log, there is a limit how much it can tell no matter how hard it is analyzed. For example, page view cannot tell how a user is reading a content such as whether the user is skimming or reading in detail. The limit is that page view cannot capture activities that occurred in specific area of the web page. In education, there are four popular logs that are used by teachers which are materials the student read, assignments submitted, topics discussed in forum, and quiz or exams grades. Unfortunately just as conventional web logs, conventional educational data can only tell what activities the students are doing and its duration but cannot tell how the students attempts those activities which can be more emphasized on Figure 4.3. In other words, it can identify a certain extent of what, when, where, and who but cannot identify deeper and how the viewer interacts with the contents (Purnama et al., 2016) (Purnama, Fungai, and Usagawa, 2016).
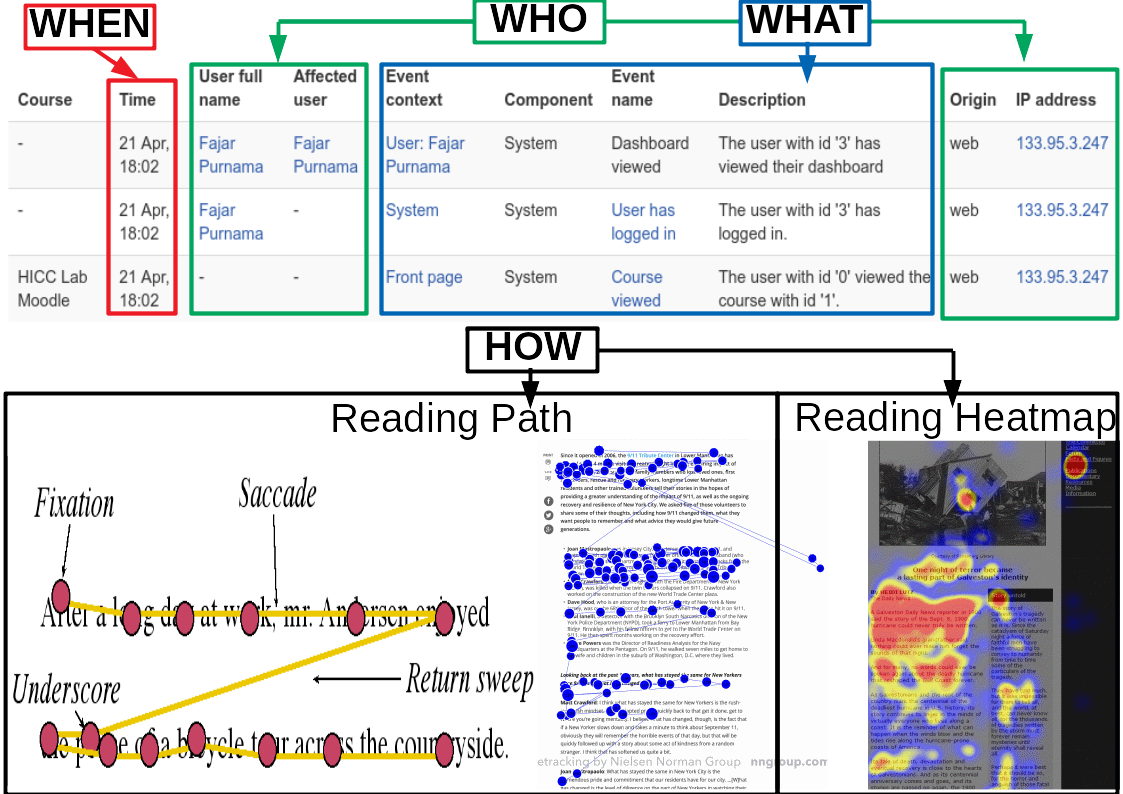
Figure 4.3 The top half of the image shows page view implemented in Moodle which is called course view. It can tell what kind of activity is attempted based on the page label within the course, when in dates, and who by the students' registered names and ip address. The bottom half of the image shows eye tracking that can tell how a user is reading the text which Moodle log cannot tell.
4.1.2 Amount of Interactions
Although the summarized event amount of mouse tracking is on the depth level of web pages or course contents, it is still not widely known by analyzers. DOM events can tell many other interactions users does on the web page. The simplest of them are knowing how much interaction the user does such as how many clicks, how many touch, how much mouse movements, how much scrolls, how much zoom in and zoom out, how many copy and paste, how many times the keyboard was pressed, and etc. Table 4.1 shows that the Mongolian students attempting the quiz session took at average 1368 seconds, performed at average 175 left clicks, 8 middle clicks, 11004 mouse movements, and 4158 scrolls.
| **name** | **duration** | **leftclick** | **rightclick** | **middleclick** | **mousemove** | **scroll** | **inactive** | **highlight** | **grade** |
| **student1** | 2572.66 | 50 | 0 | 15 | 13359 | 8747 | 1493 | 0 | 72 |
| **student2** | 2188.08 | 157 | 5 | 0 | 21066 | 6760 | 2662 | 2 | 32 |
| **student3** | 1659.22 | 278 | 1 | 6 | 13216 | 3895 | 1725 | 3 | 60 |
| **student4** | 2236.42 | 323 | 0 | 0 | 18068 | 7036 | 1467 | 4 | 84 |
| **student5** | 1916.00 | 346 | 1 | 14 | 17235 | 6019 | 1646 | 1 | 96 |
| **student6** | 2345.90 | 185 | 0 | 0 | 11006 | 5448 | 964 | 0 | 64 |
| **student7** | 1932.57 | 422 | 0 | 15 | 13748 | 2761 | 1735 | 0 | 60 |
| **student8** | 2748.21 | 173 | 2 | 0 | 12697 | 6151 | 1486 | 2 | 44 |
| **student9** | 1699.58 | 317 | 0 | 0 | 14462 | 4452 | 1848 | 0 | 72 |
| **student10** | 792.32 | 27 | 0 | 41 | 8436 | 4578 | 1125 | 0 | 64 |
| **student11** | 1021.46 | 241 | 0 | 0 | 11907 | 2018 | 1629 | 3 | 88 |
| **student12** | 691.06 | 64 | 0 | 0 | 7970 | 1995 | 1217 | 1 | - |
| **student13** | 889.88 | 610 | 0 | 19 | 11636 | 3754 | 1449 | 0 | 76 |
| **student14** | 1947.62 | 342 | 0 | 0 | 20724 | 4774 | 3235 | 0 | 72 |
| **student15** | 2300.24 | 37 | 0 | 0 | 15686 | 7346 | 2219 | 0 | 64 |
| **student16** | 1755.30 | 385 | 0 | 0 | 16435 | 5595 | 2385 | 3 | 64 |
| **student17** | 1770.57 | 29 | 0 | 0 | 16264 | 9521 | 1808 | 0 | 64 |
| **student18** | 2499.55 | 117 | 0 | 0 | 8686 | 2855 | 1685 | 1 | 92 |
| **student19** | 945.06 | 935 | 0 | 0 | 6491 | 5085 | 1199 | 0 | 76 |
| **student20** | 823.93 | 16 | 0 | 12 | 11590 | 4564 | 1604 | 0 | 60 |
| **student21** | 1624.92 | 23 | 0 | 10 | 10261 | 5123 | 1257 | 0 | 72 |
| **student22** | 1314.81 | 50 | 0 | 3 | 10966 | 2424 | 1700 | 1 | 96 |
| **student23** | 555.53 | 16 | 0 | 0 | 7726 | 1512 | 1443 | 0 | 84 |
| **student24** | 645.91 | 209 | 0 | 0 | 8814 | 2122 | 731 | 1 | 56 |
| **student25** | 1040.37 | 21 | 0 | 1 | 6351 | 2527 | 789 | 0 | 88 |
| **student26** | 1374.72 | 30 | 0 | 0 | 7340 | 2698 | 950 | 0 | 96 |
| **student27** | 837.26 | 21 | 0 | 0 | 6403 | 1849 | 984 | 0 | 56 |
| **student28** | 1902.36 | 173 | 0 | 7 | 15383 | 4817 | 2468 | 3 | 100 |
| **student29** | 992.71 | 31 | 0 | 0 | 10144 | 4335 | 1514 | 0 | 80 |
| **student30** | 859.91 | 94 | 0 | 0 | 10736 | 2417 | 1558 | 0 | 64 |
| **student31** | 1208.75 | 29 | 0 | 0 | 10430 | 4484 | 1197 | 0 | 76 |
| **student32** | 1030.32 | 16 | 0 | 0 | 11347 | 4227 | 1487 | 0 | 68 |
| **student33** | 1603.01 | 23 | 0 | 0 | 11425 | 3467 | 1729 | 0 | 60 |
| **student34** | 1098.69 | 23 | 0 | 0 | 8922 | 5386 | 806 | 0 | 84 |
| **student35** | 1462.85 | 27 | 0 | 0 | 7916 | 6822 | 1987 | 0 | 88 |
| **student36** | 2091.09 | 1179 | 3 | 179 | 16976 | 6360 | 4396 | 0 | 76 |
| **student37** | 827.12 | 26 | 0 | 0 | 6428 | 3062 | 719 | 0 | 96 |
| **student38** | 74.19 | 9 | 0 | 5 | 1068 | 328 | 156 | 0 | 80 |
| **student39** | 682.23 | 143 | 0 | 0 | 10061 | 2914 | 1419 | 0 | 68 |
| **student40** | 41.26 | 3 | 0 | 0 | 633 | 116 | 132 | 0 | 88 |
| **student41** | 90.92 | 7 | 0 | 0 | 1182 | 139 | 210 | 0 | 100 |
| **average** | 1368.16 | 175.78 | 0.29 | 7.98 | 11004.73 | 4158.12 | 1517.39 | 0.61 | 74.50 |
| **total** | 56094.53 | 7207.00 | 12.00 | 327.00 | 451194.00 | 170483.00 | 62213.00 | 25.00 | 2980.00 |
| **minimum** | 41.26 | 3.00 | 0.00 | 0.00 | 633.00 | 116.00 | 132.00 | 0.00 | 32.00 |
| **maximum** | 2748.21 | 1179.00 | 3.00 | 179.00 | 20724.00 | 9521.00 | 4396.00 | 4.00 | 100.00 |
| **stdev** | 728.82 | 295.33 | 0.72 | 39.05 | 4977.88 | 2291.82 | 914.11 | 1.16 | 15.97 |
Knowing the amount of DOM event occurrence on a web page may give a hint whether the web page fulfills its purpose or not. For example, a web page designed based on game theory are bound to be interactive where if there are less events such as clicks, movements, etc, may show that the users does not engage on the web page, whereas if the web page is designed for reading and there are many events, then there must be something wrong. The author expect high amount of DOM event done by the students because they are attempting a quiz where they need to perform many clicks to choose an answer, and need to perform many movements to read the questions carefully and maybe reviewing some questions. If there is no problem with the web page then there can be problems with the users. A study showed by Rodrigues et al., 2013 that high amount of events generated by a user can indicate that the user is stressed. Theoretically, there should be a common sense of how much a user should generate events within a certain amount of duration.
4.1.3 Web Page or Course Content Inactivity
Web page or course content inactivity is another DOM mouse event feature that analyzers does not know. In page view, the duration can be counted on visited web page but it cannot tell whether the users are actually in the web page the whole time because they can just open another tab and leave the previous ones open. With mouse DOM events, it is possible to distinguish the amount of active and inactive time of users within a web page. The inactivity is indicated when the mouse cursor leaves the web page for opening another tab or doing other activities and when the mouse cursor re-enters the web page, the status will show active again.
In Table 4.1, the amount of inactivity queries of each student are provided, and in Figure 4.4, the amount of inactivity in time domain are plotted. They showed that all the students does not always stay in the quiz page which opens the possibility that they are seeking information from outside source to answer the quiz better such as searching for answers in search engines and messaging friends online. The amount of inactivities could be exagerated due to system limitation reasons such as slow mouse leaves generates more inactivities query than fast mouse leaves. However, the system design still ensures that no inactivities queries will be generated if the mouse does not leaves the quiz area.
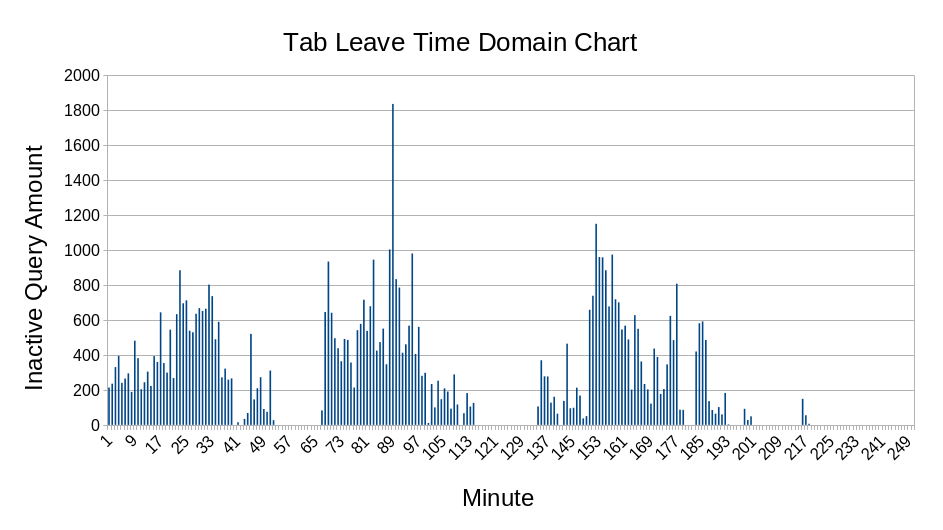
Figure 4.4 Inactive queries plotted in time domain. The horizontal axis is the time interval in minutes and the vertical axis is the amount of inactive queries.
Aside from capturing inactivities, capturing highlight, copy, cut, and paste can help in detecting dishonest behaviors. An alarm system can be developed to inform the examiners when such events occurred. For important exams such as certifications, stricter systems can be implemented such as immediately failing the test when the mouse cursor leaves the exam illustrated on Figure 4.5.

Figure 4.5 An exam detector that tracks unwanted activities of participants such as mouse leaving the exam, tab and meta button to leave the exam, and other events indicating exam leaving.
4.2 Area Level Logs
Area level logs are logs showing activities within areas of the web page or course contents. This can be done by either or combination of capturing the mouse cursor position, the touch location, the scroll bar position, or tracking the eye ball position. Then capturing the date and time of the events that occurs in those positions. The ROI mouse tracking provides these kinds of information. The amount activity in each area for this thesis is based on the total amount of events.
The most popular analysis of area level logs are heatmap visualization. There are many indications that can be derived from heat maps. For example on a high activity or duration area, may indicate that users are interested in the area. If not, then they may have trouble with the area whether trouble in understanding the content, questions that are too difficult for example on Figure 4.6 that question three receives the most attention which may indicates difficulties, or there was design problems that results in unnecessary efforts on users to capture the information. On the other hand if the area has low activity or duration may indicate that the users are not interested, the design is not well enough to capture the users' attention, or the question in the quiz is simply too easy.
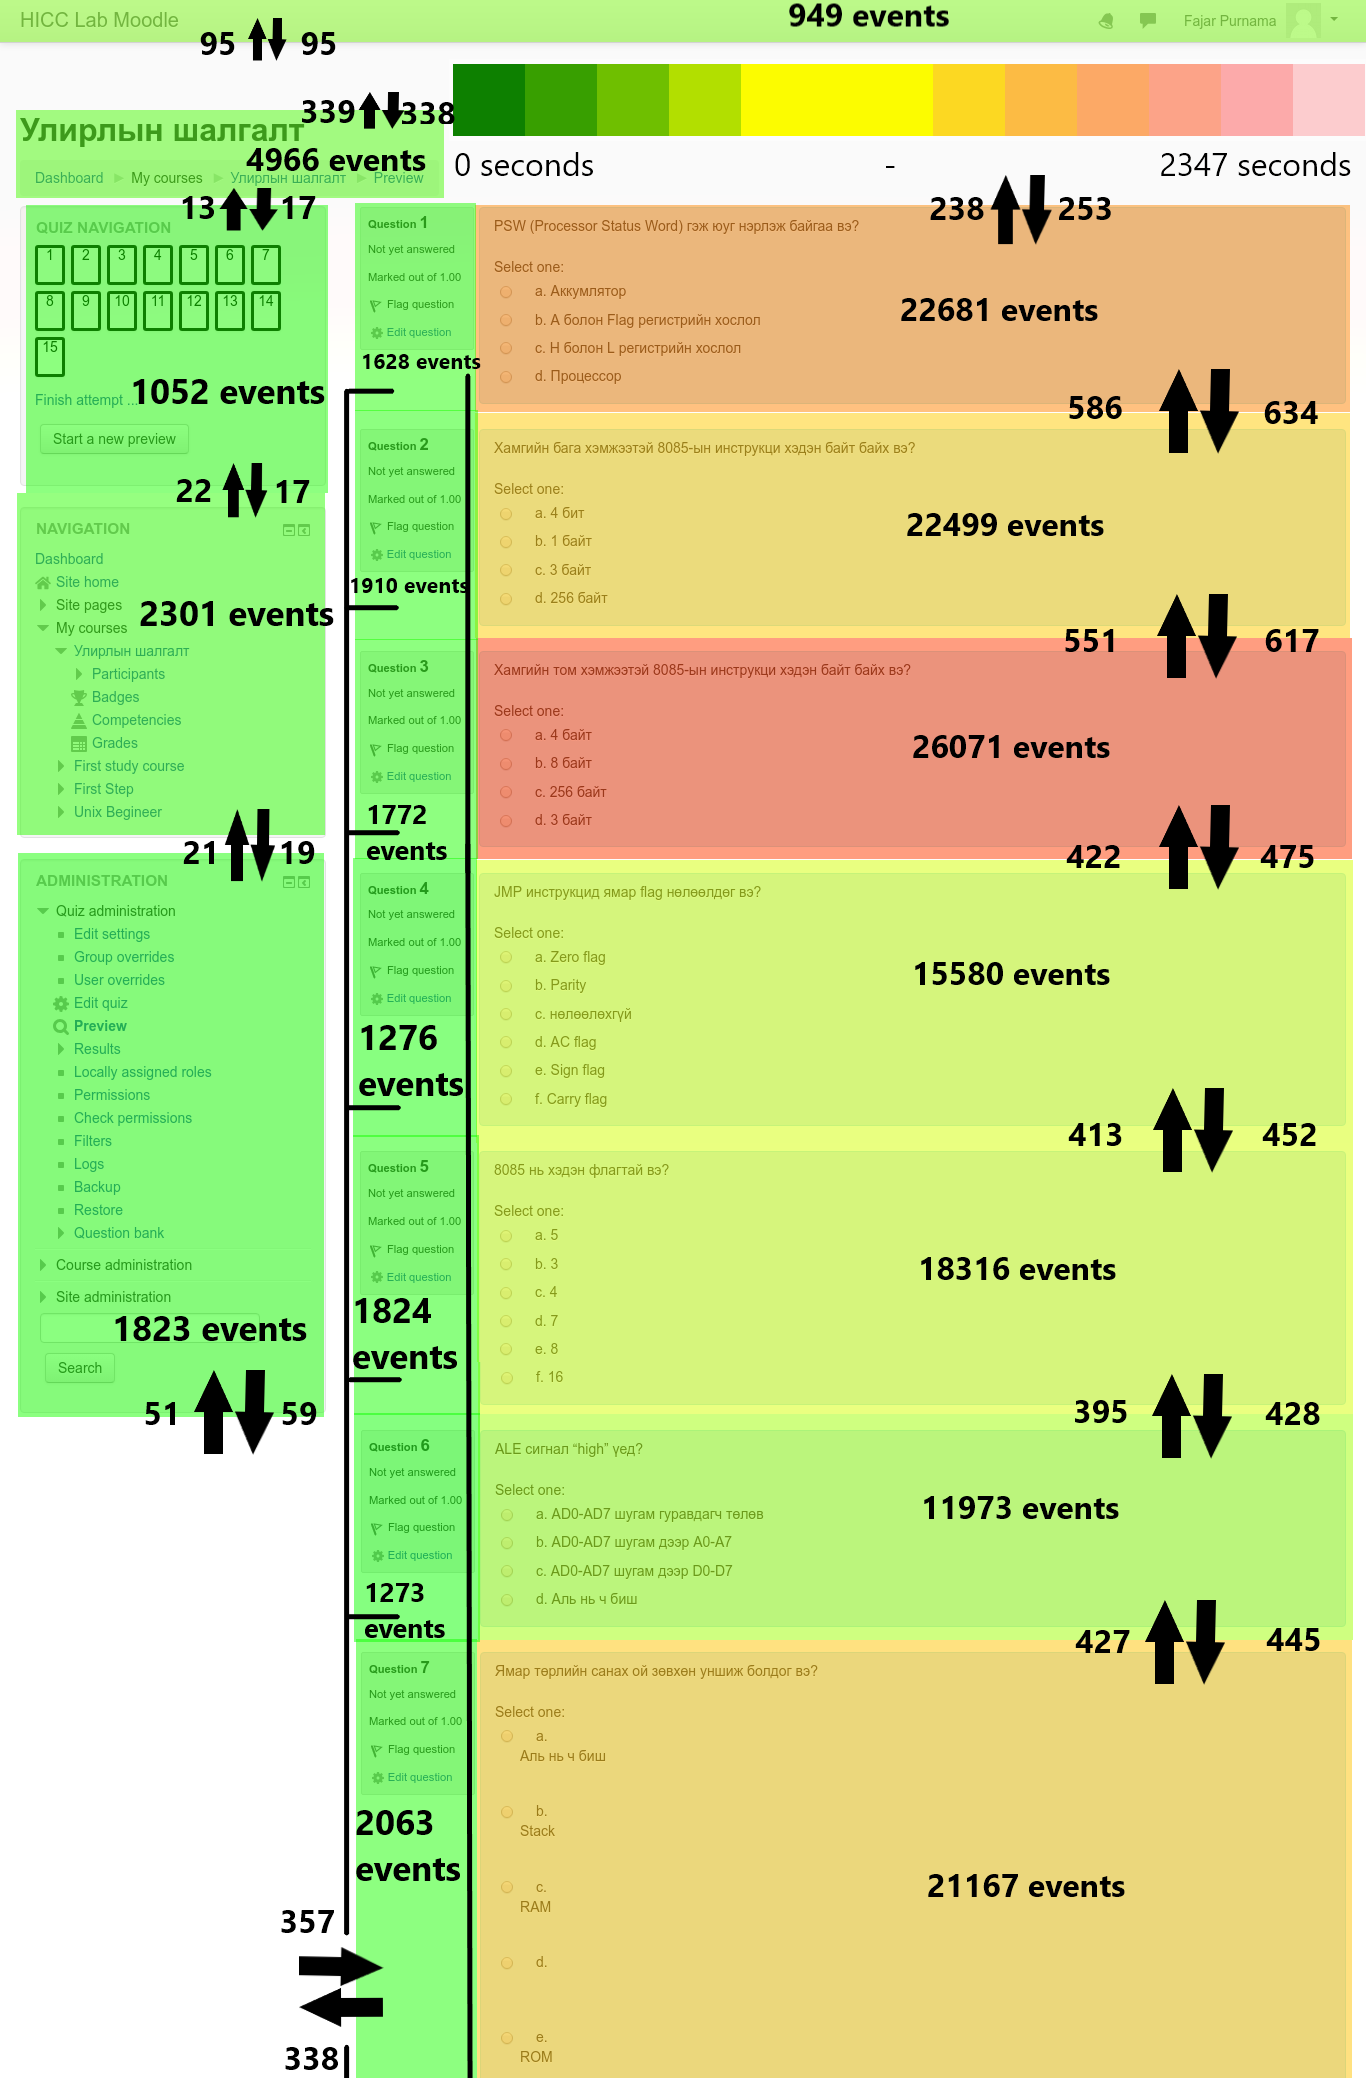
Figure 4.6 DOM and Mouse tracking of a whole class attempting a quiz session summarized into a heatmap. The color represents the duration of mouse cursors staying on an area where short to long durations are indicated from green to red. The number inside an area is the total events of clicks, movements, scrolls, etc combined. The arrows indicates the amount the mouse cursors entering or leaving an area.
Figure 4.7 shows an even more detailed heatmap where the visualization was split into 10 minute intervals. Just from a glance it can be seen that the high activity time is the 30th, 90th, and 160th minute, they took a break on the 130th minute, and they finished on the 230th minute. Another interesting information is that they did not bother much with the last question, maybe whether they are too easy or they just want finish quickly because they are too tired.
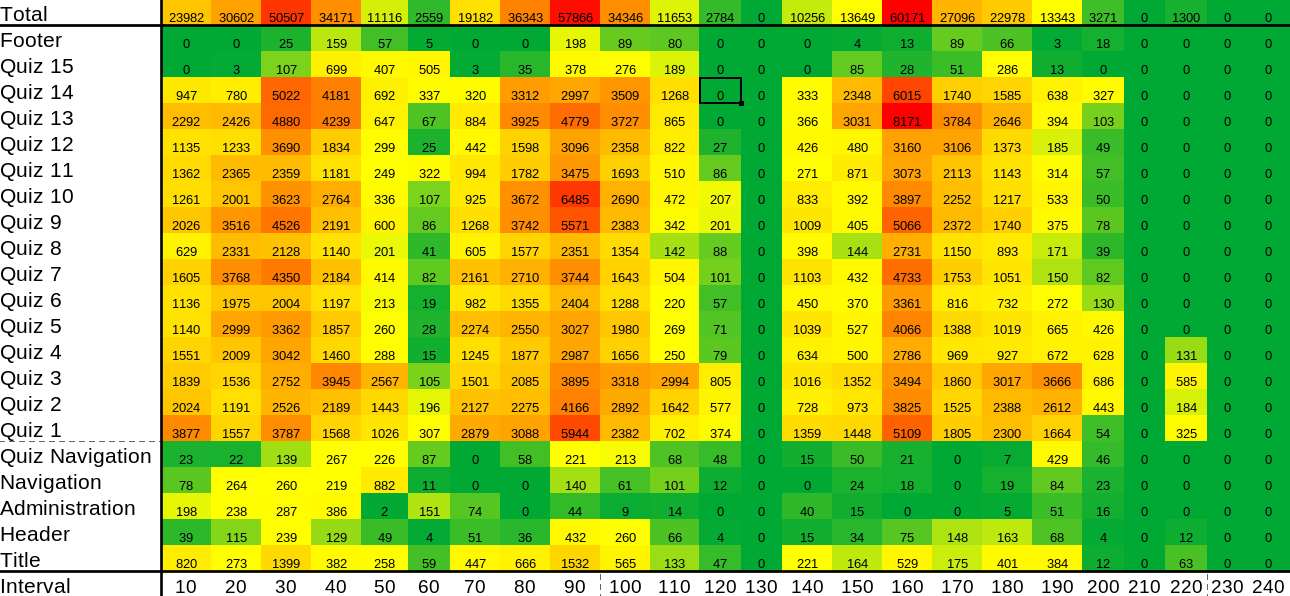
Figure 4.7 Mouse activity heatmap in quiz page locations in time series. The horizontal axis represents 10 minute interval time and vertical axis are quiz page locations. For the heatmap, green color is close to minumum activity, yellow color is close second quartile, and red is close to maximum activity.
Figure 4.8 shows another detailed heatmap regarding to the amount of activities done by each students on each area. The heatmap seems to vary to not showing much similarities between each students however, there are some. There can be seen a common correlation on question 13 that there are high activities and looking at the grade/score distribution in Figure 4.9, many students got the answer wrong which maybe common evidence that the question is too difficult for them that they had to take more effort in it. An opposite case is on question 6 where there are low activities but many students got the answer wrong which can lead the analyzer to wonder whether question is a trick question. Another similar case with strong similarity found between Figure 4.8 and Figure 4.9 that students did very little activity on the last question and but most the students got the answer wrong. Unlike question 6, it may not be a trick question but a difficult question because the score allocation is high. There maybe two possibilities where the first possibility is that the students ran out of time and since it is the last question, they may answer randomly, and the second possibility is that the students are lazy and/or tired that when they reach the last question that is difficult, they answer randomly because they may just wanted to finish the quiz quickly, giving up on the last question.
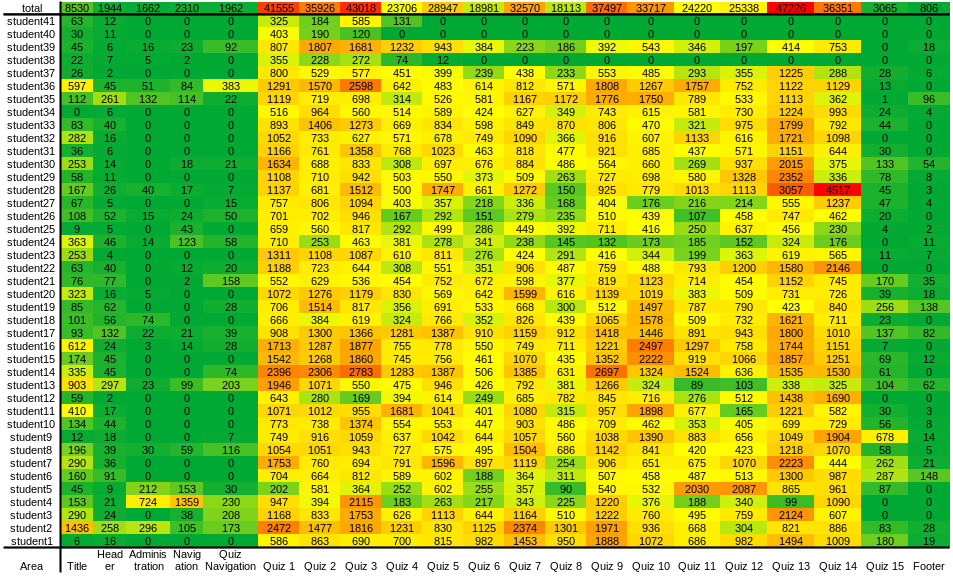
Figure 4.8 Mouse activity heatmap in quiz page locations of each students. The horizontal axis are quiz page locations and vertical axis are the students anonymized. For the heatmap, green color is close to minumum activity, yellow color is close second quartile, and red is close to maximum activity.
Those indications can be useful in many ways. For example, if the indications shows that users are not paying attention to areas which are intended to be emphasize by content creators then there needs design fixing or content revision. In education, the heat map can be useful to profile the students. It can then be followed by a guidance system that can automatically detects the students interest which the guidance system can guide the students in many ways such as linking to related resource, suggesting students their career path, grouping them with relevant community, etc. The profile can also be used in a stricter way where the teachers gives assignments to students about reading a context and the system will detect whether the students have sufficiently paid enough attention to the context or not.
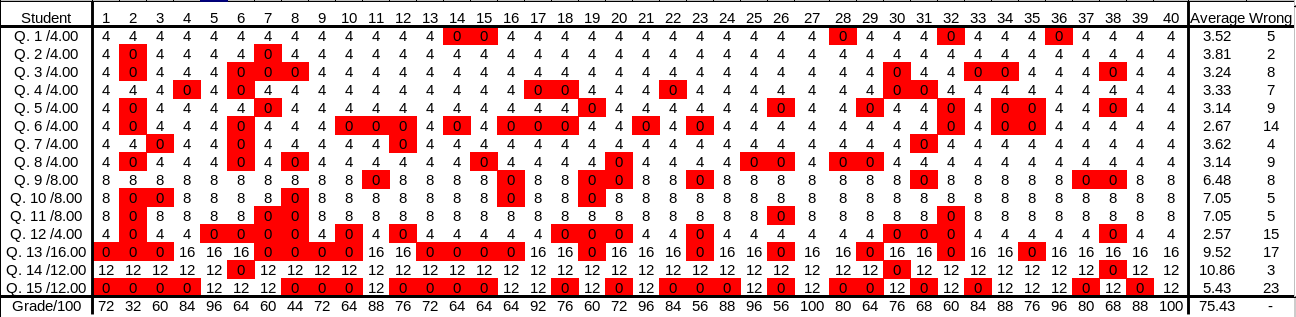
Figure 4.9 Grades/marks/scores the students receives in each questions. The first row is the label of the anonymized students, average score, and the amount of mistake made in each question. The first column is the label of the question number along with the score allocated to each of them. Wrong answers are marked with 0 points and highlighted in red.
Additionally there are some analyzers that counts the amount of mouse entering and leaving the area which is known as the mouse flow. In quiz sessions, it is normal to find many mouse flows because students tends to review or revisit the questions whether to double check or because they previously skipped them. On the other hand, for a website that is meant to guide or share information, many mouse flows may indicate problems for the website such as the users maybe confused in finding the information they need thus searching tirelessly (Hsu, Chang, and Liu, 2018).
A possible application is force reading illustrated on Figure 4.10, for example making sure the students read the agreement to tracked before exam and users read the term of service. The administrator can configure the variables such as the reading duration and amount of activities and areas. Simply, if the user did not read enough the area, then the user cannot pass and must read enough of the defined passage.
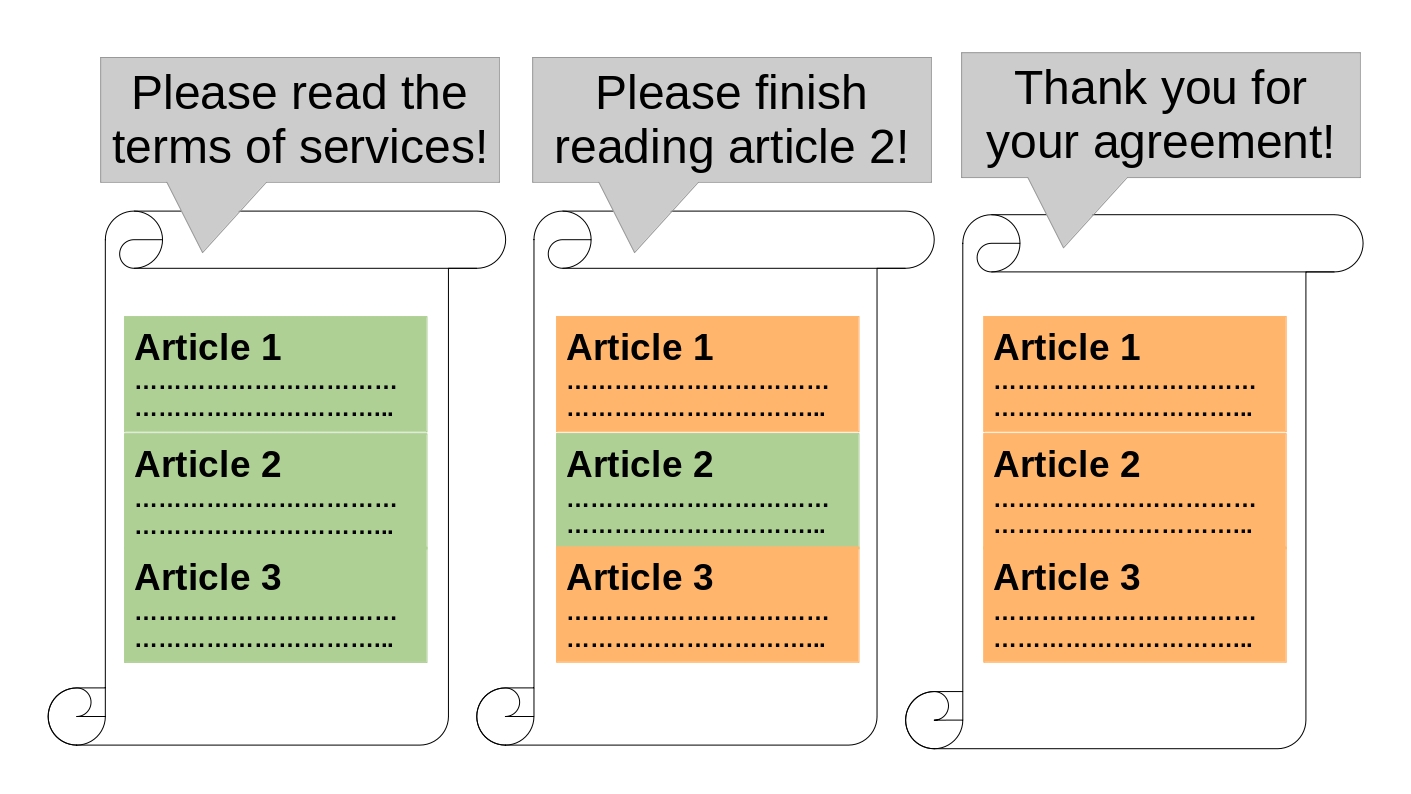
Figure 4.10 Illustration of force reading based on the duration of the mouse cursor stays in an area. The left example shows that the mouse cursor did not stay long enough in each area and tells the user to read everything, the middle example shows that the mouse cursor did not stay long enough in middle area and tells the user to complete reading middle area, and the right example shows satisfaction in user's reading.
4.3 Coordinate Level Logs
The coordinate level are the deepest level logs. The coordinate values can either be based on document, screen, or windows perspective. This is the log that the default mouse tracking generates (Purnama et al., 2020b). It is overwhelming but contains the most information where this is the log that most analyzers should want to keep. The more shallow level such as the area level log can be derived from the coordinate level log and it is unidirectional where the vice versa is not possible (Purnama and Usagawa, 2020). The most popular analysis is to draw a mouse trajectory. If the time when the mouse cursor lands on the coordinates are recorded, then it is possible to replay what the users did.
An example visualization that can be drawn from the mouse tracking data is the mouse click trajectory in Figure 4.11. It shows a user highlighting a text which can indicate that a user is paying a attention to that text or attempts to copy that text to save in the user's note or to paste in the search engine to find more information about the text. The amount of highlights the students did was also summarized on Table 4.1 and showed that either the students who highlights gets high or low grade and not average grade. The speculation is that the questions they highlight are too difficult for them and either they succeeded in finding the answers on other sites or failed. Unfortunately, the copy and paste events were not implemented at that time. In fact, it is because the author found this highlighting that motivates the author to add copy, paste, and other DOM events into the mouse tracking application.
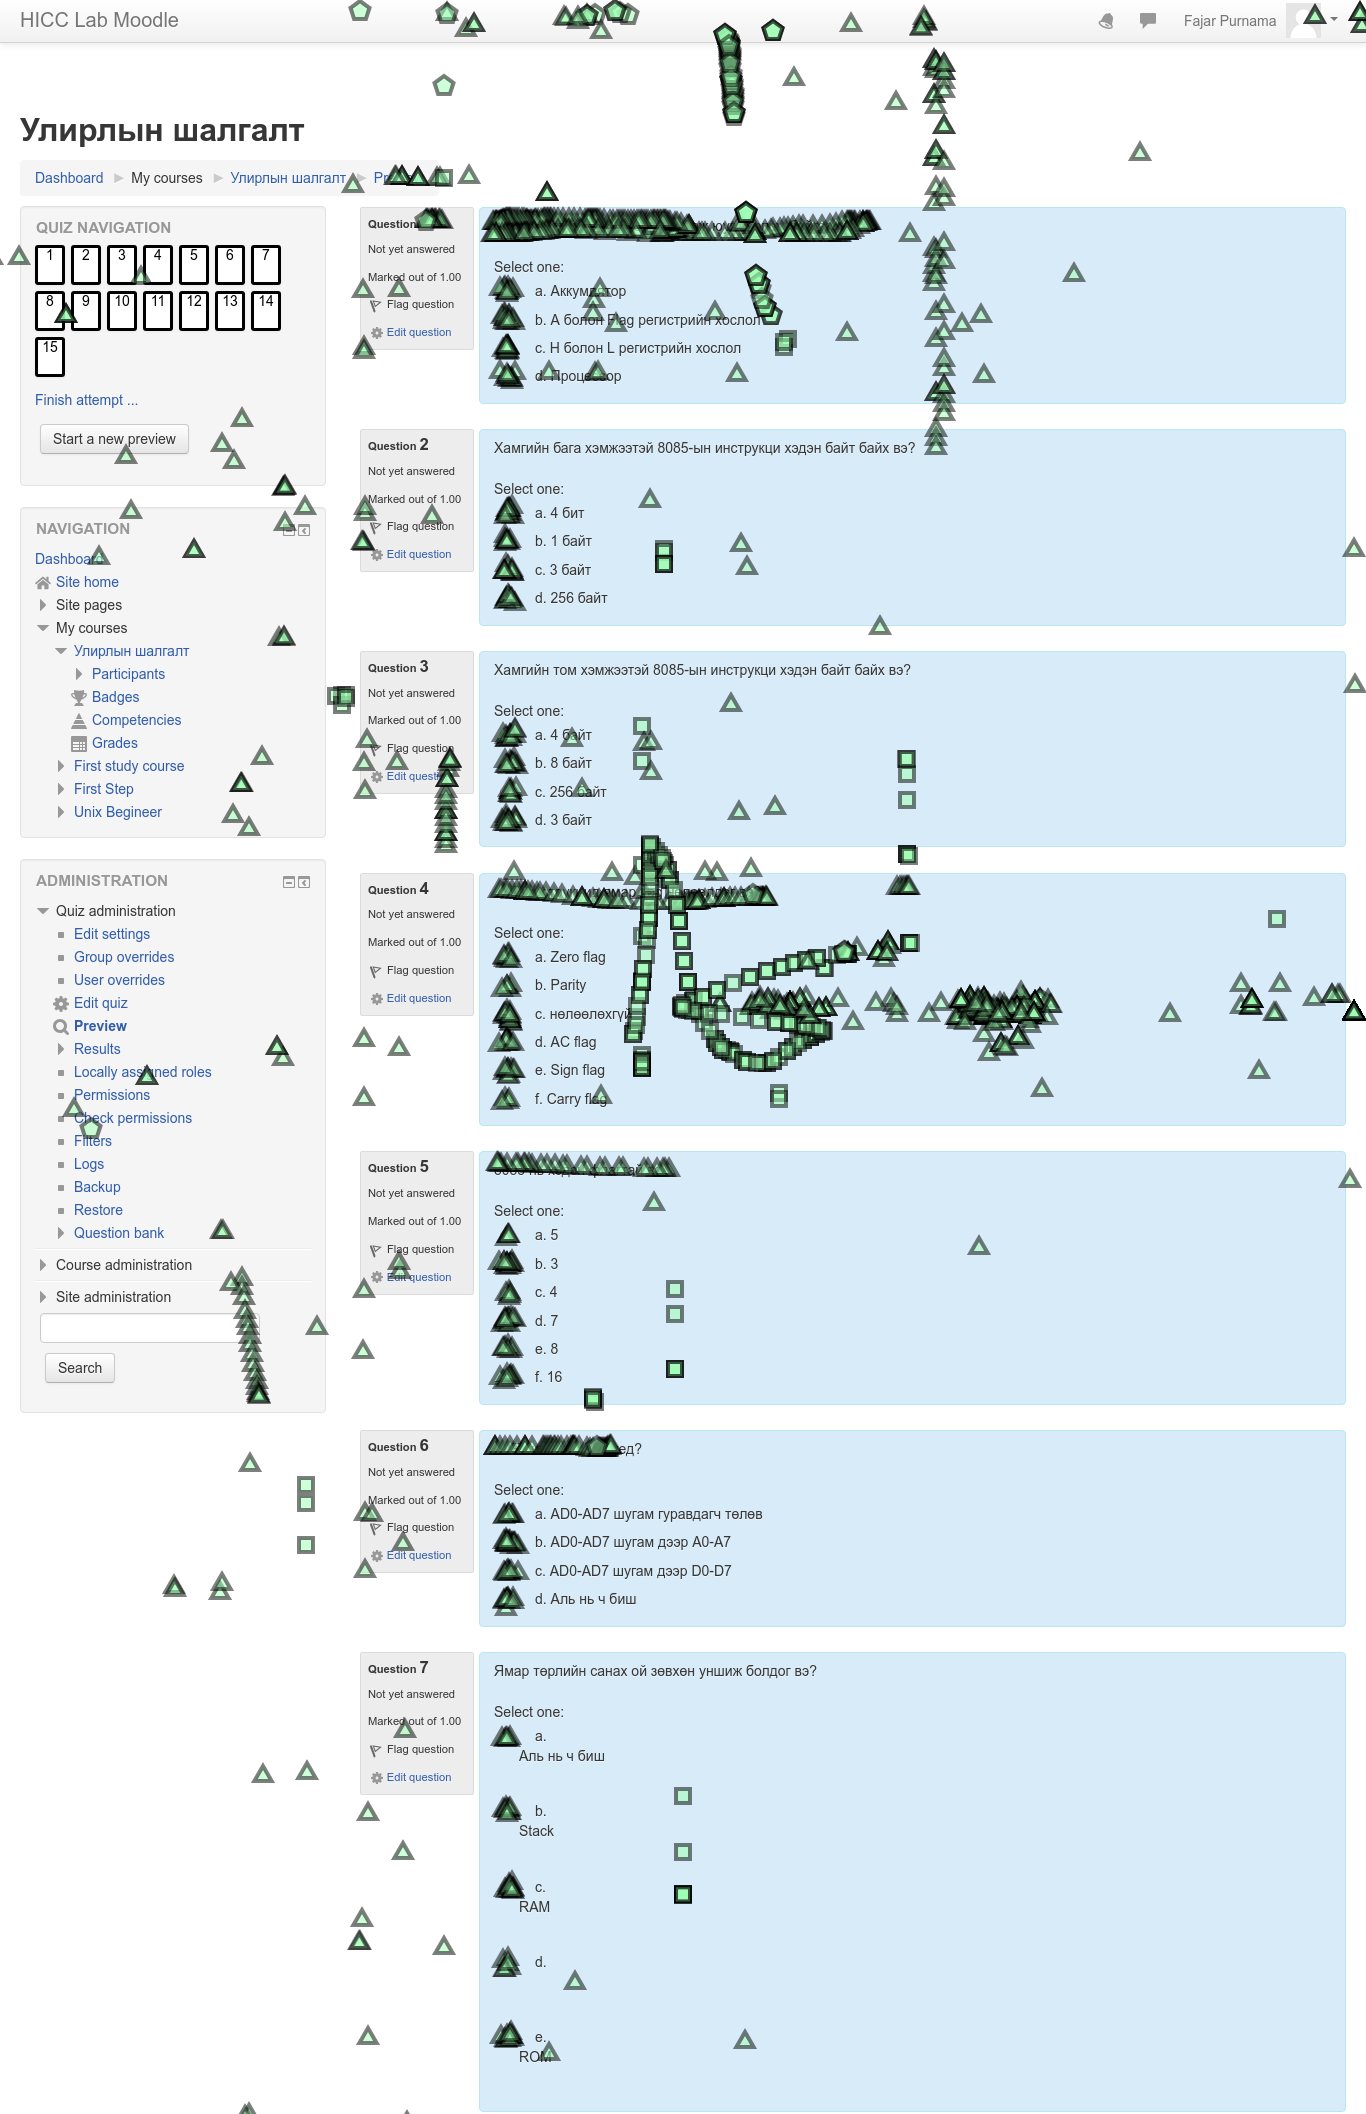
Figure 4.11 A visualization of clicks generated using the mouse tracking log of Mongolian students attempting the online quiz session. Left clicks are indicated by triangles, middle clicks are indicated by squares, and right clicks indicated by pentagons. The two interesting parts of these visualization are shown by rapid left clicks on certain text areas that indicates highlighting and rapid middle clicks that indicates scrolling.
Although mouse tracking logs are part of the deepest level logs there is still a limit of how much the mouse cursor and scroll position can indicate because certain events does not necessary have to occur on those positions. For example, reading is based on the eye gaze and typing may occur not far from the mouse and scroll position but not necessarily exactly on those position. Each of these logs alone will not make the best logs but a combination of them. Combining conventional web logs or educational data with mouse tracking and eye tracking may provide a complete log.