Notes
- This is my English translated final project as a requirement for my undergraduate graduation in the Electrical Engineering Department, Faculty of Engineering, Udayana University. However, this Final Project is only deposited in the Udayana University library and has never been published anywhere else and I hold the full copyright and it has been 6 years since this Final Project was written. Therefore, I declare that this Final Project is open, may be copied, may be republished, and may be sold, provided that you mention my name as the original author and state that this report is open in this link (customized CC-BY-SA).
- This final project has been approved by my two supervisors, namely Dr. I Made Oka Widyantara, ST., MT. and I Gst A. Komang Diafari Djuni H, ST., MT. as well as the three examiners Dr. Gede Sukadarmika, ST., MSc., Widyadi Setiawan, ST., MT., And NMAE Dewi Wirastuti, S.T., M.Sc., Ph.D. This final project is also a topic given by Dr. Nyoman Putra Sastra who should have been my main supervisor, but at that time he was continuing his studies where this final project was part of his doctoral dissertation.
- Slide: Slide Share
- Source Code: Github
Abstract
In recent years, the wireless sensor network (JSN) has provided breakthroughs in the field of monitoring from monitoring rainfall in gardens to monitoring heart rate in the health sector. This technology is known for its very low and simple energy consumption, and is currently being developed so that it can operate without a power source, but instead uses the available ambient energy such as using the energy input of a TV station's electromagnetic waves. JSN initially focused on data that could be sent at a low bit rate channel capacity. In this research, it is more to JSN with a higher bit rate channel capacity in order to transmit multimedia data specifically here is image transmission, so that the term JSN can be reduced to a wireless visual sensor network (JSVN). The platform used is Imote2 with a radio based on IEEE 802.15.4 ZigBee and the main characteristic of this research is implementing an embedded Linux system, which has never been done before. So far, there are no publications that describe the image transmission scheme in Imote2 Linux, in other words there is no information related to image transmission. This research discusses in detail the image transmission scheme between the author's version of Imote2 Linux and the scheme so that it can be used as a testbed, starting from applications written in C, compiling some testbed requirements, to implementing the testbed. The rest of the performance of Imote2 Linux is tested by transmitting the image without compression and with the JPEG2000 standard compression where the compression is carried out on the Imote2 Linux embedded system by the OpenJPEG software. The results show a significant difference between uncompressed and compressed transmission.
Chapter 1 Introduction
1.1 Background
WSN (wireless sensor network) is a wireless network system that uses sensor devices to obtain information. These sensors are distributed in an area that are connected wirelessly (forming a network) to collect information around them as in Figure 1.1. This WSN has been applied in the civil, medical, and other fields (Shwe et al, 2013). There are several types of sensors, including temperature, motion, acidity, sound, and camera sensors. This research uses WVSN (Wireless Visual Sensor Network) which is a camera sensor-based WSN.
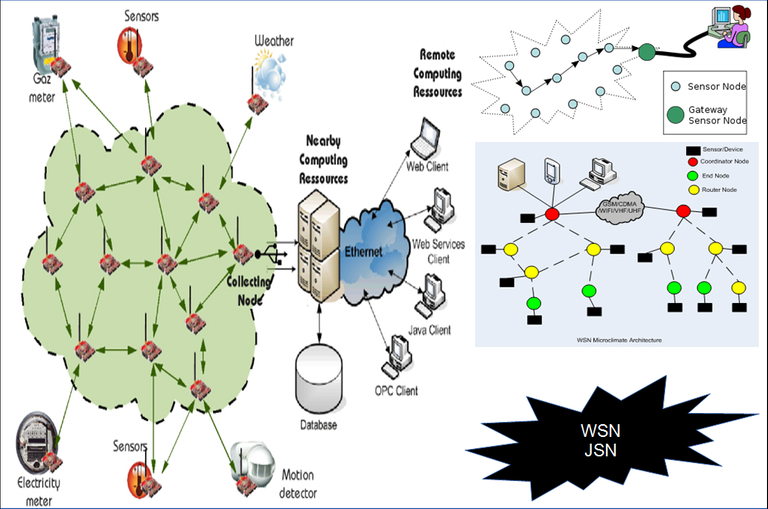
Figure 1.1 WSN overview
One example of the application of WSN is the research of Garcia-Sanchez (2010) on monitoring of wild animals on transportation infrastructure in the wild. Things that are monitored are animal interactions such as the frequency and time the animals cross the road or underpass, the length of time the animals have been there, and how the animal's attitude towards the transportation infrastructure. From this monitoring, it can be seen whether the transportation infrastructure is safe, attracts the attention of animals, the overall condition of the transportation infrastructure and the natural conditions around it. Monitoring is carried out by installing camera sensors and motion sensors on the Imote2 platform in the transportation infrastructure area such as the underpass entrance gate, in the underpass, the edge of the highway, above trees, or in ravines as shown in Figure 1.2. Several factors such as no power source (resource), an environment that does not allow the installation of large devices such as ravines, danger zones, uneven terrain, and sensitive environmental conditions (tend to attack the device or avoid the device), or the time factor that requires immediate monitoring so that it is impossible to spend time on large equipment installations, and many other factors, a similar example in the military field to detect the presence of an enemy must use a minimalist and small device so that it is not easily detected, for this matter WSN is an option because it is practical to apply.
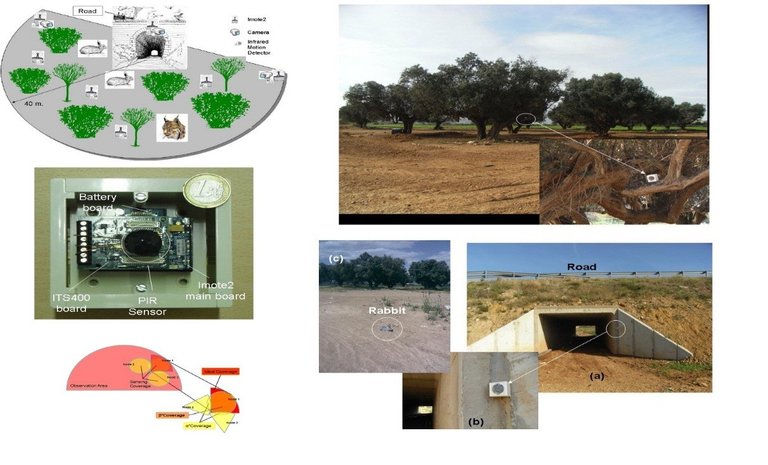
Figure 1.2 Example of implementing JSN on a road in the wild (Garcia-Sanches, 2010)
Current WSN research leads to energy savings while maximizing performance in other words, getting as much information as possible with the minimum energy consumption. This is because WSN has limited resources and limited computing capabilities. Imote2 itself uses 4 AAA batteries as a power source, has a processing capability of 13-416 MHz, 32 MB program memory, 256 kB of RAM (Random Access Memory) as a temporary storage place at the processing stage, and a maximum transmission rate of 250 kbps point-to-point. Even though Imote2's specifications are superior to other platforms as shown in Table 1.1, it is still far from being compared to PCs (Private Computers) which now have a minimum specification of over 1 GHz processor, over 1 GB RAM, and over 50 GB hard disk capacity.
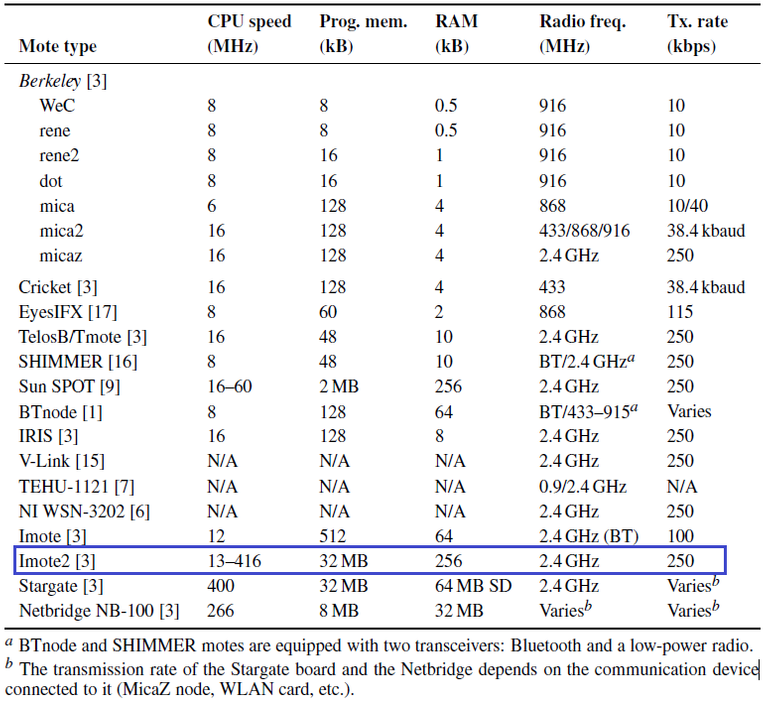
Table 1.1 Mote hardware (Akyildiz, 2010)
From these limitations, one of the efforts to save is the determination of the right transmission media. There are many types of standards for wireless transmission media such as WLAN (Wireless Local Area Network), Broadband Wireless, and WPAN (Wireless Personal Area Network). WLAN standardized on IEEE 802.11 has a wide range over 1 km with a max data rate of 54 Mbps on IEEE 802.11g, this standard is more suitable for wireless communication on computers. Broadband Wireless has a wider range with a max data rate of IEEE 802.16m 100 Mbps, better known as WMAN (Wireless Metropolitan Area Network). However, the results of previous research, namely research by Wiasta (2012), Natha (2012), and the author himself Purnama (2013), are not efficient in transmitting binary data using WLAN. The results are far compared to using the WPAN standard, which can be seen in Figure 1.3. For portable devices, the IEEE 802.15 WPAN standard is provided. IEEE 802.15.1 Bluetooth provides a max data rate of 723.2 kbps with a range of 10 meters. It is commonly used for voice and data transmission, applied to cellphones and gadgets. IEEE 802.15.2 regulates communication between WPANs and other wireless networks. IEEE 802.15.3 HR-WPAN (High Data Rate Wireless Personal Area Network) with a data rate of 11-55 Mbps with a range over 70 meters is commonly used for multimedia. Suitable for use on WSN is the IEEE 802.15.4 LR-WPAN (Low Data Rate Wireless Personal Area Network) standard because it is low power consumption and data rates of 20, 40, 250 kbps point-to-point with a range of 10 meters (Ahmad, 2005). IEEE 802.15.4 develops the PHY layer, MAC layer, and NWK layer, while Zigbee develops the full application layer in Chapter 2. The transmission limitation in IEEE 802.15.4 Zigbee is the maximum data rate of 250 Kbps point-to-point with PHY layer, the maximum packet size is 127 bytes minus 89 bytes header. Fragmentation and reassembly are not performed at the NWK layer, therefore the application layer must be developed for fragmentation and reassembly and adapted for image transmission (Pekhteryev, 2005).
%20Imote2%20dengan%20WLAN%20.PNG)
%20catu%20daya%20WLAN.PNG)
%20dengan%20LR-WPAN.PNG)
Figure 1.3 Electrical power consumption in WSVN Imote2 binary data transmission (a) Imote2 with WLAN (b) WLAN power supply (c) with LR-WPAN (Natha, 2012, dan Wiasta, 2012)
Another effort is to use a lightweight operating system. Previously Imote2 worked on Intel Platform X. After Imote2 moved to Crossbow, Intel Platform X was no longer being developed because Crossbow released its own operating system. The operating system used is most of the operating systems developed by communities such as SOS (Simple Operating System) but SOS has been discontinued since 2008. Currently, it is TinyOS and most recently Linux. Most publications on the web use TinyOS. Embedded Linux is now being developed due to the limitations of TinyOS such as complex routing. The embedded Linux community thinks the Linux operating system on Imote2 can overcome these limitations. However, embedded Linux on Imote2 is still new and under development (Kasteleiner, 2010). The main reason Linux is used is because it is opensource, which means it is free, open and can be developed by anyone.
This research leads to embedded system Imote2 Linux. Previous work successfully embedded Linux into the Imote2 platform and successfully sent a maximum of 28 bytes of random data. In this work the function will be extended so that Imote2 Linux can transmit images with IEEE 802.15.4 ZigBee-based radios. After being able to transmit, the Imote2 Linux transmission performance will be observed.
1.2 Problem
- How is the image transmission scheme with wireless media based on IEEE 802.15.4 ZigBee on the Imote2 JSVN platform on embedded Linux?
- How does the IEEE 802.15.4 Zigbee based WSVN platform perform in image transmission on embedded Linux?
1.3 Research Objective
- To get an image transmission scheme with wireless media based on IEEE 802.15.4 Zigbee on the Imote2 JSVN platform on embedded Linux.
- To get a robust image transmission scheme on the Imote2 WSVN platform based on IEEE 802.15.4 Zigbee on embedded Linux.
1.4 Research Benefit
- Get an image transmission scheme with wireless media based on IEEE 802.15.4 Zigbee on the Imote2 JSVN platform on embedded Linux.
- Getting the optimal schema for transmitting images on the Imote2 JSVN platform on embedded Linux.
- Get the performance results of the Imote2 JSVN platform in image transmission implementing IEEE 802.15.4 Zigbee on embedded Linux.
1.5 Scope of Problem
- Using the Imote2 platform WSVN.
- Imote2 uses the embedded Linux operating system.
- Image processing applies the JPEG2000 standard.
- Transmission system between Imote2 Linux.
Chapter 2 Literature Review
2.1 Previous Research
The previous research is the implementation of embedded Linux on the Imote2 WSVN platform. First Imote2 uses the operating system from Crossbow. After that TinyOS is installed, now we try to use embedded Linux. There are 3 things discussed, namely the embedded Linux installation procedure, post-installation configuration, and observed the performance of the Imote2 WSVN platform by measuring the memory consumed and the electricity consumed when transmitting binary data. The installation procedure includes cross-compiling the Linux kernel and drivers to the ARM architecture used by Imote2, setting up the bootloader and filesystem, and embedding the bootloader, kernel, and filesystem to Imote2 using the OpenOCD chip debugger software. To do this, you need a computer with the Linux operating system. Post-embedding / entry is activating IP (Internet Protocol), SSHD (Secure Shell Daemon), and radio networks via Telnet. The commands for configuring this are common in Linux based on Debian, Ubuntu, and the like. The final stage of the research is to observe the performance of binary data transmission at a distance of 10m, 20m, and 30m. The transmission was tested on 2 types of wireless transmission media, namely IEEE 802.11 WLAN and IEEE 802.15.4 Zigbee also called LR-WPAN. It is necessary to add a TP-LINK WLAN power supply and radio device to implement WLAN. A daughter board is created to connect the device. In terms of software, a driver is needed. While the Zigbee implementation is available in Imote2, all you need to do is run the driver and create a script to transmit binary data. In the final result Zigbee is more efficient in terms of consumption of voltage and electric current can be seen in Figure 2.1, Figure 2.2, and Figure 2.3. The value of electric power consumption is the result of the multiplication of voltage and electric current in the previous figure, namely Figure 1.2 (Natha, 2012, Wiasta, 2012, Purnama, 2013).
%20tegangan.PNG)
%20arus.PNG)
Figure 2.1 Consumption of WLAN-based Imote2 battery (a) voltage (b) current
%20tegangan.PNG)
%20arus.PNG)
Figure 2.2 Consumption on WLAN USB Power Supply battery (a) voltage (b) current
%20tegangan.PNG)
%20arus.PNG)
Figure 2.3 Zigbee-based Imote2 battery consumption (a) voltage (b) current
2.2 State of The Art
This research is a continuation of previous research that will examine the performance of the WSVN Imote platform with the embedded Linux operating system in transmitting images via IEEE 802.15.4 Zigbee-based transmission media. If previously only transmitting binary data, this time is transmitting images. It is preferred to use IEEE 802.15.4 Zigbee-based transmission media because it was previously proven to be more efficient.
The idea to examine image transmission with 4 different scalabilities based on wavelets (research stage in Chapter 3) was obtained from the research of Nasri (2010). Nasri's research (2010) examined the application of JPEG2000 in distributive image transmission in WSVN. In detail, the WSVN scheme is divided into 7 clusters (7 groups of WSVN devices) where each cluster is given a part of the standard JPEG2000 compression stage (JPEG200 can be seen in sub-chapter 2.6) can be seen in Figure 2.4. With this scenario the idea emerged to transmit images with different scalability based on the JPEG2000 standard in the research at this writing.
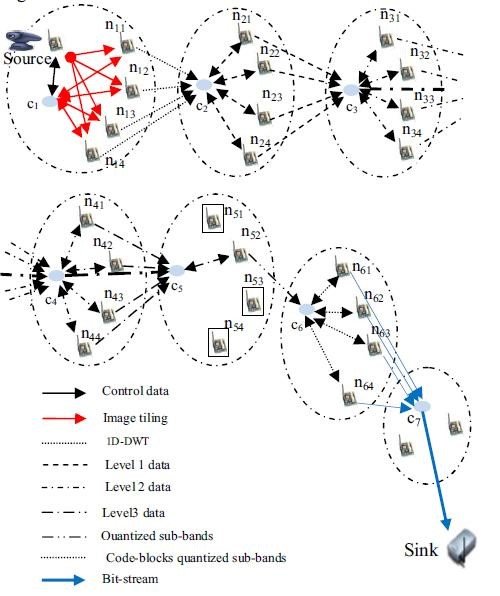
Figure 2.4 JPEG2000 compression scheme distributed on JSN (Nasri, 2010)
- The first cluster performs 1D-DWT by decomposing horizontally to form the L and H sub-bands.
- The second cluster performs 1D-DWT with vertical decomposition to form LL1 sub-bands, LH1, HL1, HH1.
- The third cluster performs a whole 1D-DWT on the LL1 sub-band to form the LL2 sub-band, LH2, HL2, HH2.
- The fourth cluster performs a whole 1D-DWT on the LL2 sub-band to form the LL3 sub-band, LH3, HL 3, HH 3.
- The fifth cluster does quantization.
- The sixth cluster is coding the block.
- Cluster refers to entropy coding.
In summary, the results of the highest energy consumption are in the first and second clusters, then energy consumption decreases from the second cluster to the destination. The results were obtained using a special energy consumption formula for the JPEG2000 stage, in other words Nasri's research (2010) was a simulation, not a study using direct devices.
Related research is the compression and transmission performance using the IJG (Independent JPEG Group) library on the Imote2 platform with TinyOS based on the results of research by Mowafi (2010). The scenario is a single-hop or point-point connection where the JSVN device performs JPEG compression of the image before transmitting. The image is compressed with a 5-fold quality factor of 95-5. Time and voltage drop during compression and transmission were measured and the image PSNR was measured. The measurement results show that the time and stress consumption of the image compression process is relatively the same as the quality factor value, with a value close to 0. While the measurement results of the transmission show that it requires an average time and voltage of 14 seconds and 0.45 mV at a quality factor of 95 and decreases to 1 second and 0.03 mV at quality factor 5. The PSNR range from the 95-5 quality factor is 47-28 dB. So JPEG image compression helps to save time and energy in image transmission. The results of the research can be seen in Figure 2.5.
%20waktu.png)
%20drop%20tegangan.png)
%20PSNR.png)
Figure 2.5 Quality factor against (a) time (b) voltage drop (c) PSNR (Mowafi, 2010)
In another paper, Mowafi (2012) implements IJG and JPEG2000. Variation of the quality factor in IJG and Compression Ratio in JPEG2000 was done by finding the same file size in the two compression techniques. After that, the two compression techniques were compared by measuring the time for compression, the transmission time after compression, and the energy consumption of the bit rate. PSNR measurement of the two compression techniques is also done based on the size of the file. Finally, a simulation with a multi-hop sensor was carried out where time and energy consumption were the benchmarks for the two compression techniques. The parameters were obtained from previous single-hop research. The result is that the JPEG2000 excels in terms of PSNR, power consumption during transmission, and transmission time, but JPEG excels in terms of power consumption and compression time. The compression time consumption in JPEG is the least compared to other aspects, while the compression time consumption in JPEG2000 is the largest on the contrary, from the overall compression and transmission process. The research results can be seen in Figure 2.6. So it can be concluded that JPEG is more efficient on WSVN with short hops because it is economical on the compression side, does not require a long transmission line. If with long hops it is recommended to use JPEG2000 because it is more efficient on the transmission side. WSVN will be more optimal if various compression techniques are applied in order to be flexible to circumstances.
%20PSNR.png)
%20Energi.png)
%20Waktu.png)
Figure 2.6 Image Compression against (a) PSNR (b) Energy (c) Time (Mowafi, 2012)
Pekhteryev's (2005) research in transmitting images on IEEE 802.15.4 and Zigbee networks are very similar to this study. Due to the very limited transmission capacity and the absence of fragmentation and reassembly features, the NWK layer is required to make an application with these features. The research is to observe the number of error sending images from sending 100 JPEG images and 100 JPEG2000 images on 1-hop and 2-hop networks as shown in Figure 2.7, the results can be seen in Figures 2.8 and 2.9.
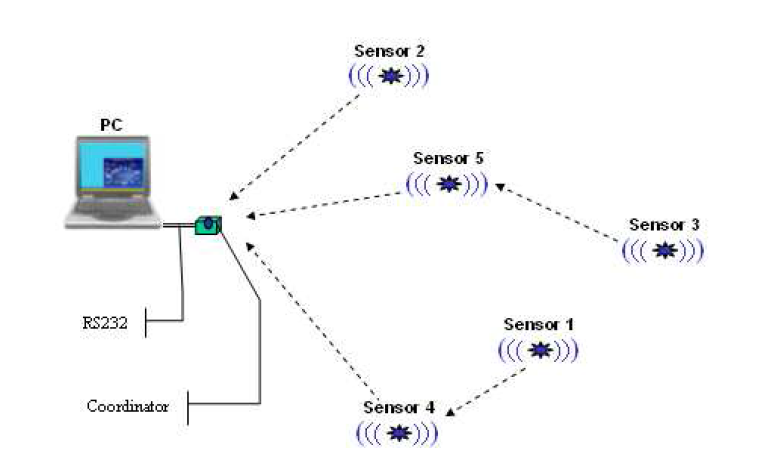
Figure 2.7 Research scenario (Pekhteryev, 2005)
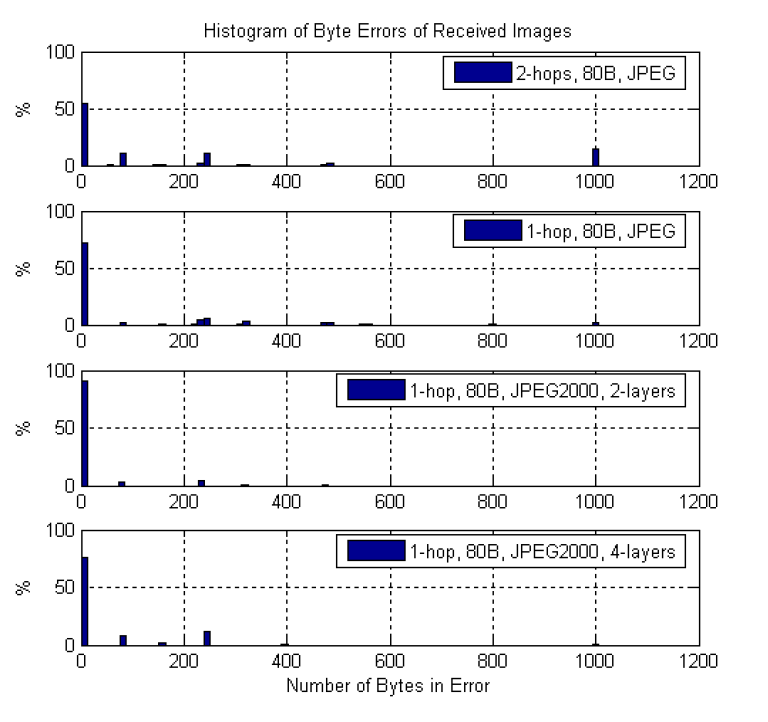
Figure 2.8 Percentage of the histogram bytes error1 (Pekhteryev, 2005)
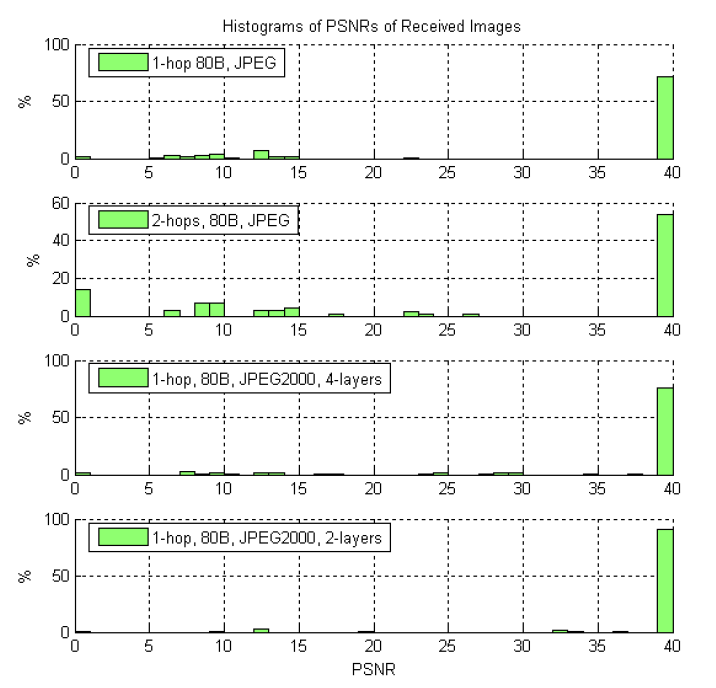
Figure 2.9 The percentage of error bytes histogram 2 (Pekhteryev, 2005)
This study implements image transmission in the IEEE 802.15.4 Zigbee transmission as research by Pekhteryev (2005). The difference from this study is that Pekhteryev's (2005) study uses an M16C microcontroller and analyzes transmission errors more, whereas this study uses the Imote2 platform device and analyzes the energy efficiency of transmission. Furthermore, the image is compressed first using the JPEG2000 standard before transmission, such as Mowafi's research (2012). The difference between this study and Mowafi (2010, 2012) is the operating system used, Mowafi's research (2010, 2012) uses TinyOS while this research uses embedded Linux. In addition, there is no research (from the author's knowledge) that discusses the image transmission scheme on the IEEE 802.15.4 Zigbee WSVN, especially in the Imote2 Linux embedded system. The essence and the fundamental difference of this research from the others is that the image transmission program in C language and a schematic is made to function as a testbed in Imote2 Linux.
2.3 Electrical Power
Electric power mathematically defined as the electrical energy produced per time.
P=dw/dt (2.1)
Where:
p = electrical power (watt)
w = electrical energy (joule)
t = time (second)
Electric power can be formed by multiplying electric voltage and electric current. If the electric voltage is the average electrical energy per electric charge, and the electric current is the electric charge that flows every second, the multiplication of these two variables produces electric power. (Irwin, 1993).
V=dw/dq, I=dq/dt, VI=(dw/dq)(dq/dt)=(dw/dt)=P (2.2)
Dimana:
V = electrical voltage (volt)
q = electrical charge (coloumb)
I = electric current (ampere)
2.4 IEEE 802.15.4 ZigBee Standard
This standard is a collaboration between IEEE (Institute of Electronic and Electrical Engineer) and ZigBee. IEEE focuses on developing standards at the lower layers, namely the PHY (Physical) layer and MAC (Media Access Control) or datalinklayer. Meanwhile, ZigBee focuses on developing the layer above it, to the application layer. The IEEE 802.15 standard is specifically for WPAN (Wireless Personal Area Network) with the aim of low power consumption, short range, and small device size. If 802.15.1 (bluetooth) is an intermediate standard, 802.15.3 is HR(high rate)-WPAN with high data rate, then 802.15.4 is LR(low rate)-WPAN with low data rate but low power consumption. While 802.15.2 is a standard for connecting between types of wireless devices (Ergen, 2004).
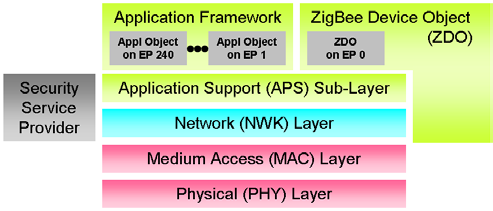
Figure 2.10 The architecture of the IEEE 802.15.4 ZigBee standard (Daintree Network, 2006)
2.4.1 PHY Layer
Is the lowest layer that regulates transmission. Symbol formation uses O-QPSK (Offset Quadriture Phase Shift Keying) modulation to reduce consumption in transmission. Operating frequency bands are divided into 27 channels based on DSSS (Direct Sequence Spread Spectrum) as shown in Figure 2.11.
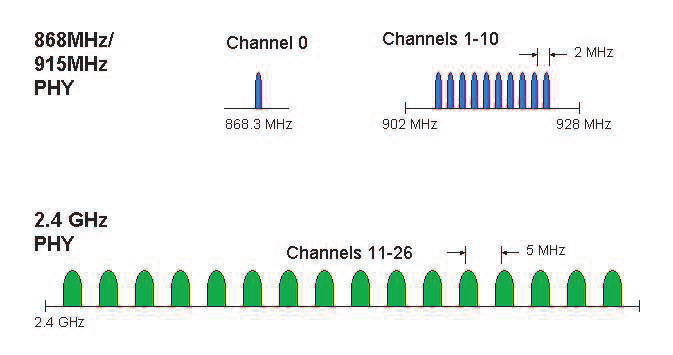
Figure 2.11 Operating frequency band (Ergen, 2004)
Channel 0 is at a frequency of 868.3 MHz with a data rate of 20 Kbps, channels 1-10 are at a frequency of 902 Mhz with a distance between channels of 2 MHz with a data rate of 40 Kbps, and channels 11-26 are at a frequency of 2.4 GHz with a distance between channels of 5 MHz with a data rate of 250 Kbps. The minimum sensitivity of channel is 0-10 -92dBm while channel 11-26 is 85 dBm (Ergen, 2004), the details can be seen in table 2.1.
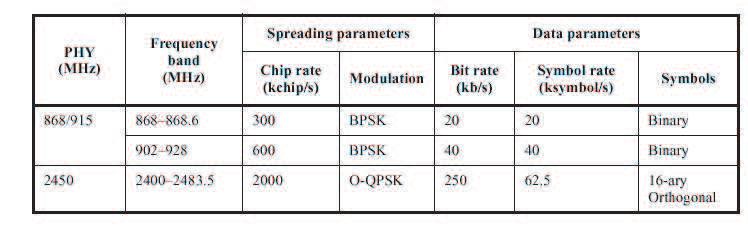
Table 2.1 Frequency bands dan data rates (Ergen, 2004)
Features of the PHY layer (Ergen, 2004):
- Activation and deactivation of radio transceivers.
- Receiver ED (Energy Detection).
- LQI (Link Quality Indication).
- CCA (Clear Channel Assessment).
- PPDU (Physical Protocol Data Unit) packet.
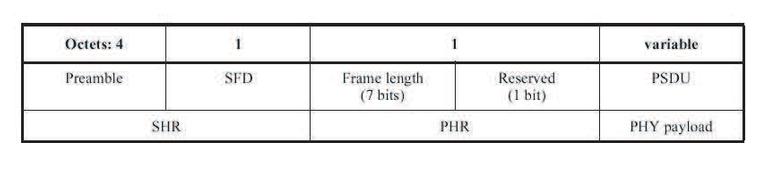
Figure 2.12 PPDU Format (Ergen, 2004)
2.4.2 MAC Layer
MAC layer is the layer that regulates the flow of data from the PHY layer to the network layer and vice versa. A device can be either an FFD (Full Function Device) or an RFD (Reduced Function Device). An FFD can function as a PAN (Personal Area Network) coordinator, coordinator, or member. The MAC layer manages the following devices (Ergen, 2004):
The data transfer model can be divided into 3, namely coordinator-device, device-coordinator and device-device. Can be set to use beacons or not. When using the beacon, it will use the superframe structure format and otherwise it will use unslotted CSMA-CA (Carrier Sense Multiple Access Carrier Avoidance). The beacon frame format can be seen in Figure 2.13.
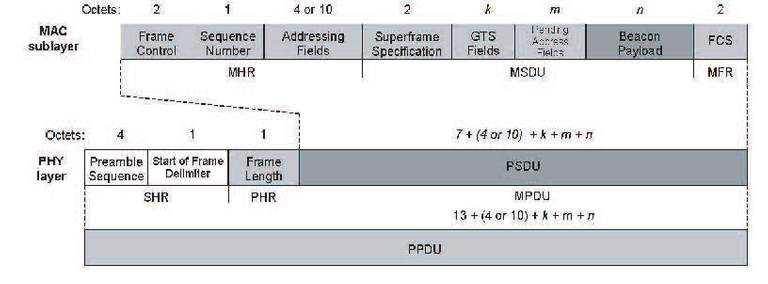
Figure 2.13 Beacon frame
Dapat menggunakan superframe structure atau tidak. Superframe structure dapat dilihat pada gambar 2.14.
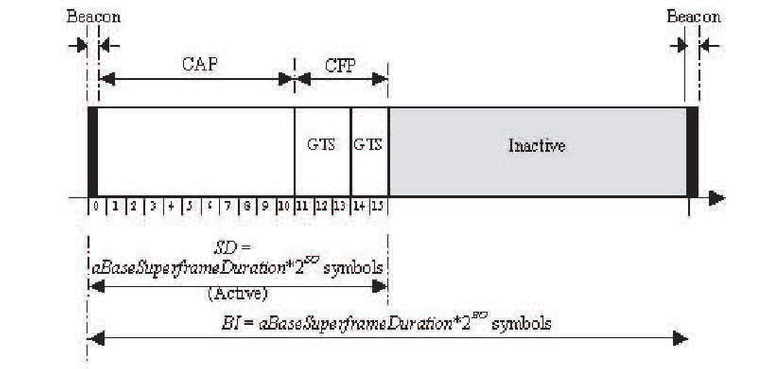
Figure 2.14 Superframe structure
From the structure in Figure 2.14, there are 3 periods. During the inactive period the device is inactive. In the CFP (Contention Free Period) period there is a GTS (Guaranteed Time Slot) from channels 11-15, other devices that want to connect with the device in a CFP state can directly connect. Meanwhile, in CAP (Contention Access Period) devices must compete using a slotted CSMA-CA to communicate. The CSMA-CA algorithm can be seen in Figure 2.15.
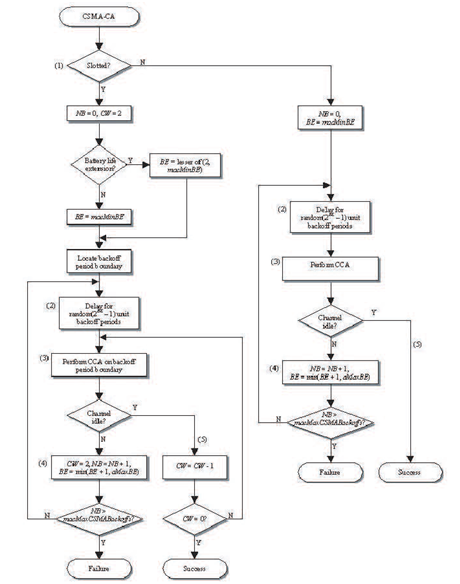
Figure 2.15 CSMA-CA Algorithm
Starting and maintaining PAN. A PAN will be started after performing an active channel scan, if there is the same PAN on a POS or it is known as a conflict device it will run the identifier conflict resolution procedure.
Manage association and disassociation. A device that wants to associate with a PAN will send a data-request to the coordinator. Then the coordinator will send an acknowledgment. Even though the acknoledgement has yet to determine the agency that sent the data request, it has been an associate, depending on the coordinator. If the coordinator wants to disassociate a device or the device wants to disassociate himself then sends a data-request. Although the acknoledgement has not been sent, the device sending the requeset data is immediately disassociated after sending. The frame data can be seen in Figure 2.16, and the acknoledgement frame can be seen in Figure 2.17.
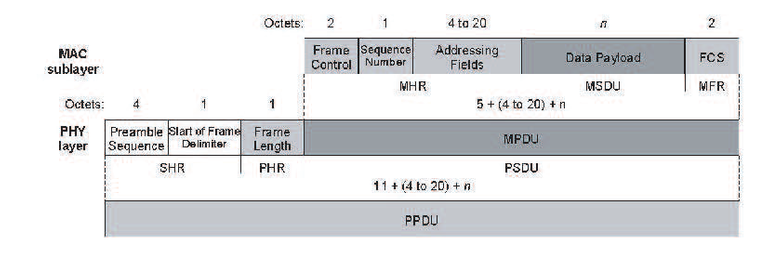
Figure 2.16 Data frame
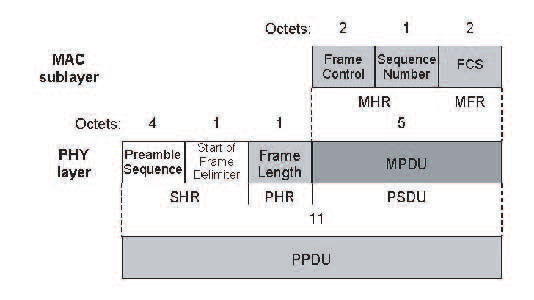
Figure 2.17 Acknowledgment frame
Set up synchronization. Synchronization can use beacons, otherwise it asks for information with the coordinator.
MAC frame format, can be seen in Figure 2.18. MAC Command frame can be seen in Figure 2.19.
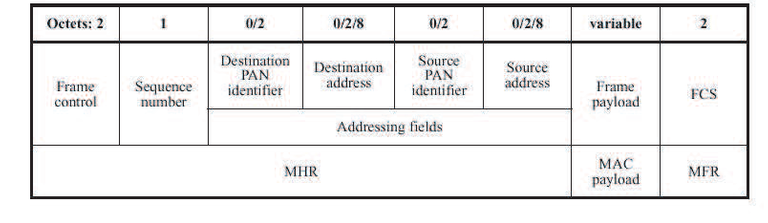
Figure 2.18 General MAC frame format
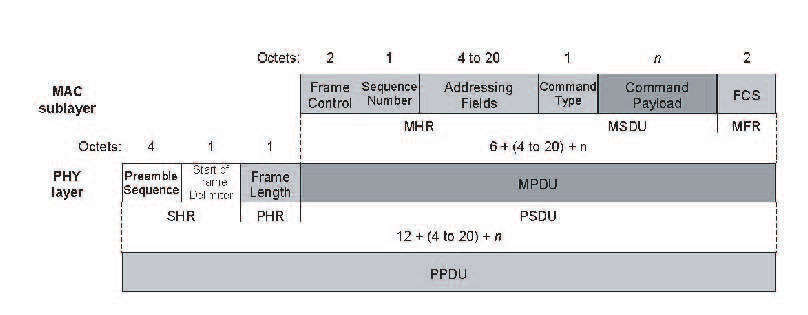
Figure 2.19 MAC Command Frame
2.4.3 Network Layer
The network layer manages the network, including the routing mechanism. In general, at this layer two algorithms are used, namely AODV (Ad Hoc On Demand Distance Vector) and Motorola's Cluster-Tree algorithm. (Ergen, 2004).
AODV is a pure on-demand route acquisition algorithm, in which devices are not on an active path, assigning routing information, or participating periodically in exchanging routing tables. Devices don't have to know the path to other devices on a network when they don't need to communicate. Path discovery is performed when devices need to communicate. First the device will send a RREQ (Route Request) packet consisting of source addr, source sequence number, broadcast id, dest addr, dest sequence number, hop cnt. The device will start communicating when it receives an RREP (Route Reply) consisting of source addr, dest addr, dest sequence number, hop cnt, lifetime.
Motorola's Cluster-Tree Algorithm, in this algorithm the device is designated as DD (Degsinated Device) first. DD is the core device of a topology, so all information from the topology will be stored on DD, from this information it is known that the topology optimization is formed. It is determined that DD is in the 0th cluster. After that DD will give CID (Cluster Identity) to CH (Cluster Head). Through CH is given an ID (Identity) and checked for surrounding devices that will become members of CH and form a star topology. The link between clusters is called a border node. The overall topology will form a tree can be seen in Figure 2.20.
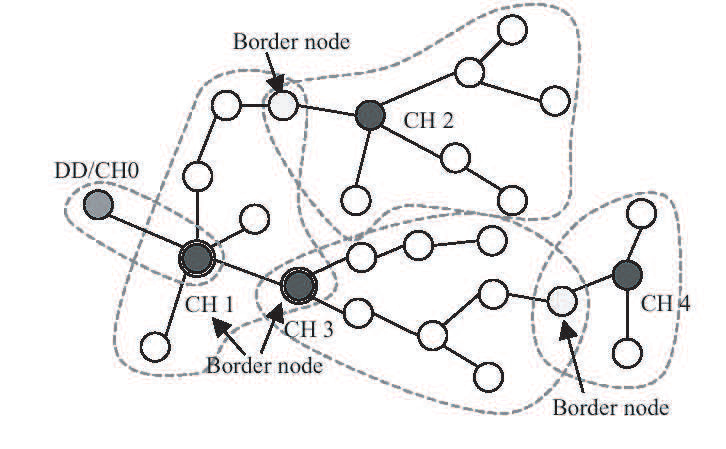
Figure 2.20 Multicluster network
2.4.4 Application Layer
This layer consists of the application framework and application support (APS) sublayer. Application framework manages communication that connects end-users to the layer below the application. Meanwhile, the application support sublayer manages the relationship between the application framework and the network layer, specifically managing application profiles, clusters, and endpoints. An application profile describes a set of devices running on a specific application, for example application profiles for home automation systems and commercial, industrial and institutional settings. A device in an application profile communicates in a cluster, for example, in a home automation profile there is a cluster that regulates the lighting subsystem. While endpoints is a communication entity, which has been determined about the application that is running, for example a button on the remote control.
The important thing about application support sublayer is binding, which here is interpreted as a link between endpoints, for example to turn on the light with a button on the remote. Binding can be direct or indirect. The direct connection between the remote and the light is direct binding. Indirect binding, there is a router between the remote and the light, usually there is a cluster library. There are commands in the cluster library that can be used together, you only need to add the cluster ID to the command, for example the on/off command needs to be added to the cluster ID for the target device (Daintree Network, 2006).
Fragmentation and reassembly are not performed at the NWK layer, therefore the application layer must be developed for fragmentation and reassembly and adapted for image transmission (Pekhteryev, 2005).
2.5 Intel Mote 2 (Imote2)
Imote2 is a platform on the WSN device developed by Intel Research in the platform X research section. This device is built with low power consumption, with a PXA271 XScale CPU processor, and is integrated in IEEE 802.15.4 ZigBee (Stanford, 2013). This processor (Intel Xscale processor PXA271) can operate at low voltages (0.85V) and frequencies of 13MHz to 104MHz. The frequency can be increased up to 416MHz by adjusting the voltage. In general, Imote2 consists of 4 parts as shown in Figure 2.21.
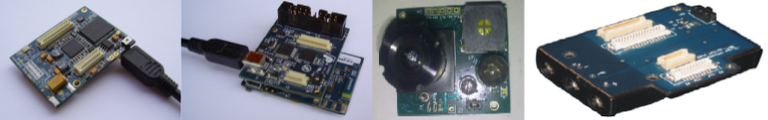
Figure 2.21 Imote2 (a) radio processor board (IPR2400) (b) interface board (IIB400) (c) sensor board (IMB400)(d) power supply board (IBB2400).
2.5.1 Radio Processor Board IPR2400
IPR2400 specifications can be seen as follows (crossbow, 2007):
- PXA271 XScale® processor @ [13–416] Mhz.
- Wireless MMX coprocessor.
- 256kB SRAM, 32MB FLASH, 32MB SDRAM.
- Integrated 802.15.4 radio, support for external radios through SDIO and UART.
- Integrated 2.4GHz antenna.
- Multicolor status indicator LED.
- Basic and advanced expansion connectors supporting : 3xUART, I2C, 2xSPI, SDIO, I2S, AC97, USB host, Camera I/F, GPIO.
- Mini-USB port for direct PC connection.
- Size: 48 mm x 36 mm. PCB thickness 1.75 mm
2.5.2 Interface Board IIB400
IIB400 specifications can be seen as follows (crossbow, 2007):
- Mote connectors 2x Advanced (male/female).
- USB connector mini-B female.
- Serial port A virtual UART with RTS/CTS flow control.
- Sertial port B virtual UART without hardware flow control.
- JTAG port standard 20-pin connector.
- Size 48mm x 36mm x 14m.
- Weight 11g.
2.5.3 Sensor Board IMB400
IMB400 specifications can be seen as follows (crossbow, 2007):
- Camera
- Image resolution up to 640x480 pixels, 30 fps max. RGB, YcbCr or YUV formats.
- Hardware image scaling and filtering – automatic exposure, gain, white balance, black level.
- Image controls include saturation, hue, gamma, sharpness.
- Audio Codec
- Sampling rates up to 48kHz, mono.
- SNR > 94dB, THD < -80dB
- Programmable filters for noise suppression.
- PIR Sensor
- Maximum range ~ 5m.
- Detection angles 80-1000.
2.5.4 Power Supply Board IBB2400
IBB2400 specifications can be seen as follows (crossbow, 2007):
- Batteries 3 x AAA.
- Maximum Current 500mA fused.
- Size 52mm x 43mm x 18mm.
- Weight with 3 AAA Batteries 51g.
- Weight without batteries 14g.
2.6 JPEG2000
JPEG2000 is an image compression standard developed by JPEG (Joint Photographic Expert Group) around 2000 with the hope that this image compression standard based on DWT (Discrete Wavelet Transform) provides better quality than the pre-image compression standard developed in 1992, namely JPEG. which is based on DCT (Discrete Cosine Transform). The advantages of JPEG2000 with JPEG are as follows:
- Provides a higher compression ratio at the same time as better image quality.
- Using tiling, so that the encoding can be done only on a certain part of the image, it does not have to encode the whole image, in other words, the image is divided into many parts.
- Progressive transmission with pixel and resolution accuracy, meaning that the original image is received at a low resolution, the resolution will increase as data is transmitted, so it can be multiresolution, can be displayed with many resolution options.
- There are lossless or lossy compression options that are not available in JPEG.
- Cope errors.
- Flexible file format.
- Side channel spatial information.
In general, the technicality of JPEG2000 image compression can be seen in Figure 2.22 and vice versa.
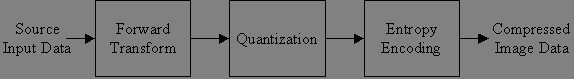
Figure 2.22 General JPEG2000 image compression technique
The JPEG2000 image compression standard is regulated in ISO/IEC 15444 which consists of 14 parts, the basic characteristics of the JPEG2000 are regulated in the first part, namely ISO/IEC 15444-1 core coding system. The encoding in JPEG2000 can be seen in Figure 2.23.
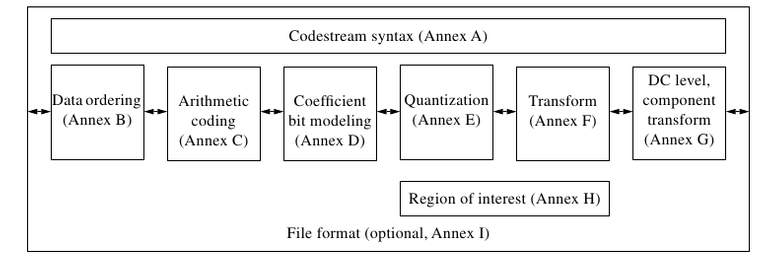
Figure 2.23 Encoding JPEG2000
2.6.1 Codestream syntax
Before DWT image can be done, it must be converted into signal. This is done in the syntax codestream. In this section, there is either a core header or a header tile. The header consists of several segment markers that contain minimal information about a component, for example tile size, ROI (Region of Interest), and quantization, which can be seen in Table 2.2 and Table 2.3 (Boliek, 2000).
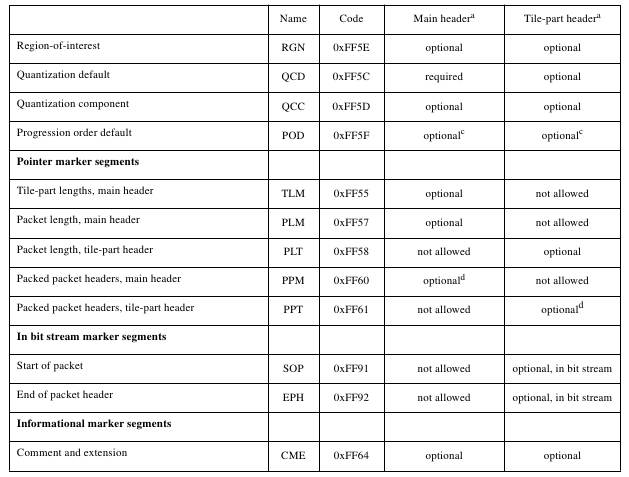
Table 2.2 List of segment markers 1
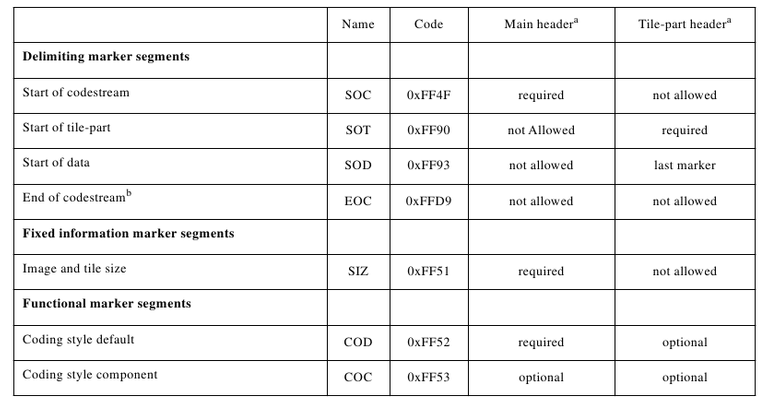
Table 2.3 List of segment markers 2
2.6.2 Data Ordering
In this section, an image is divided into several components. In this section, tiling is performed as in Figure 2.24, namely dividing the image into squares, so that coding does not have to be done on the entire image, coding can be done in a certain part, for example increasing the resolution can be done in a certain part, not necessarily the whole image.
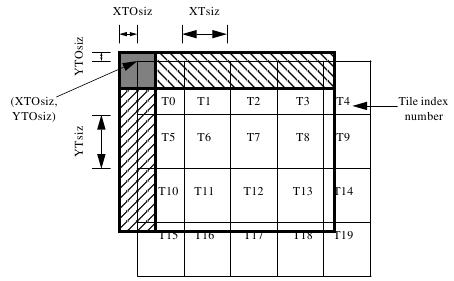
Figure 2.24 Tiling
After that the tiles are divided into several resolutions and sub-bands, including the LL, LH, HL, and HH sub-bands as shown in Figure 2.25. Resolution is divided into precincts, and sub-band is divided into code-blocks. The data is distributed on 1 or more layers where the information content of each layer is stored in packages. The last is the progression order that allows multi-resolution, the level of resolution will increase along with sending data, in other words, there is no need to take all the data to display the image (Boliek, 2000).
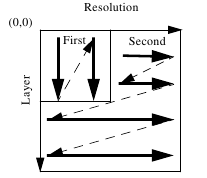
Figure 2.25 Example of change in 2-dimensional order progression
2.6.3 Arithmetic Entropy Coding
After getting the coefficients, the next step is arithmetic entropy coding where information is represented in digital form. The JPEG2000 uses Elias entropy coding where a positive integer x is represented as 1 + floor(log(2)x). Because the image has been divided into several tiles, coding is performed on each tile (Boliek, 2000).
2.6.4 Coefficient Bit Modeling
In this section important or rare information appears filtered. Each coefficient in the sub-band has been divided into code blocks as shown in Figure 2.26.
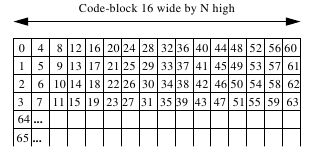
Figure 2.26 Code block
After that the code block is ready to enter coding passes. Coding passes consists of 3, namely (Boliek, 2000):
- Significance propagation coding pass, where it is determined that the important or rare coefficients arise.
- Magnitude refinement pass, after obtaining a significant coefficient from the first pass coding, at this stage the coefficient is added with the horizontal, vertical, and diagonal neighbors. If the additive is more or equal to 1 then it is labeled "TRUE", otherwise it is "FALSE".
- Clean-up coding pass, run-length coding is performed on the other coefficients.
2.6.5 Quantization
Quantization is a process of rounding coefficients. In JPEG2000 formula 2.3 is used to find the stepsize then uses the 2.4 quantization formula (Boliek, 2000).
∆b=2Rb−εb(1+(μb/2)) (2.3)
∆b : stepsize
Rb : dynamic range sub-band b
εb : exponent
μb : mantisa
q(u,v)=sign(ab(u,v))(ab(u,v)/∆b) 2.4
2.6.6 Transform
In the JPEG2000 standard FDWT (Foward Discrete Wavelet Transform) is carried out on each tile. FDWT passes tile coefficient with low pass filter and high pass filter to get low pass coefficient and high pass coefficient. The first level of FDWT produces a sub-band LL (Low-Low) which consists of a vertical low pass coefficient and a horizontal low pass, LH (Low-High) which consists of a vertical low pass coefficient and a horizontal high pass, HL (High-Low) which consists of a coefficient vertical high pass and horizontal low pass, and HH (High-High) which consists of the coefficient of vertical high pass and horizontal high pass. The next level is carried out by FDWT on the LL sub-band, and the resulting new LL sub-band depends on the specified level as shown in Figure 2.27. The vertical low pass coefficient is obtained by applying the low pass filter to the tile vertically, while the horizontal low pass coefficient is obtained by applying the low pass filter to the tile horizontally and so on. On the decoder side, the IDWT (Inverse Discrete Wavelet Transform) process is carried out, which is the reverse process of FDWT (Boliek, 2000).
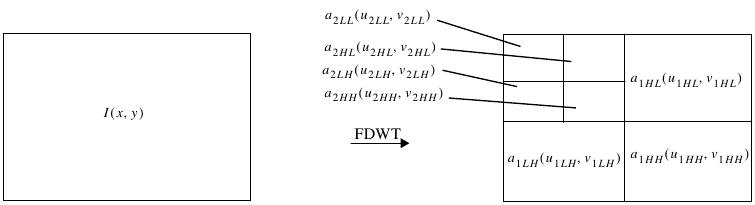
Figure 2.27 Foward Discrete Wavelet Transform
2.6.7 DC Level, Component Transform
Forward DC level shift is done before doing FDWT. After doing the forward DC level, a forward component transform can be performed to make compression more efficient, but this process may not be done as shown in Figure 2.28 (Boliek, 2000).
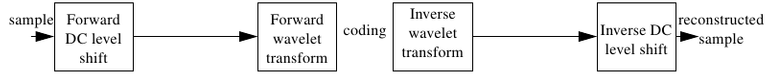
Figure 2.28 DC level shift before transformation
2.6.8 Region of Interest
ROI (Region of Interest) is part of the image that will be encoded on the codestream first with the aim of this section being given greater quality. The method used is Maxshift. Generally consists of 4 steps (Boliek, 2000).
- Regional generation ROI.
- Scaling the ROI area so that it has a larger value than the rest (background), so that it is in a higher bit plane.
- Decrease the background scale.
2.7 Peak Signal to Noise Ratio
PSNR (Peak Signal to Noise Ratio) is a measure commonly used to measure the quality of the image that has been processed against the original. First, the error calculation for the image that has been processed with f (x,y) against the original image g (x,y) is carried out. After obtaining the MSE (Mean Square Error) value that will be used to find the PSNR value (Shi, 2007).
e(x,y)=f(x,y)− g(x,y) (2.5)
e : error
f : processed image
g : original image
x : horizontal coordinate
y : vertical coordinate
MSE=(1/MN)ΣM-1x=0ΣN-1y=0e(x,y)2 (2.6)
MSE : Mean Square Error
M : horizontal dimensions of the image
N : vertical dimensions of the image
PSNRdB=10log10(2552/MSE)dB (2.7)
PSNR : Peak Signal to Noise Ratio in decibel