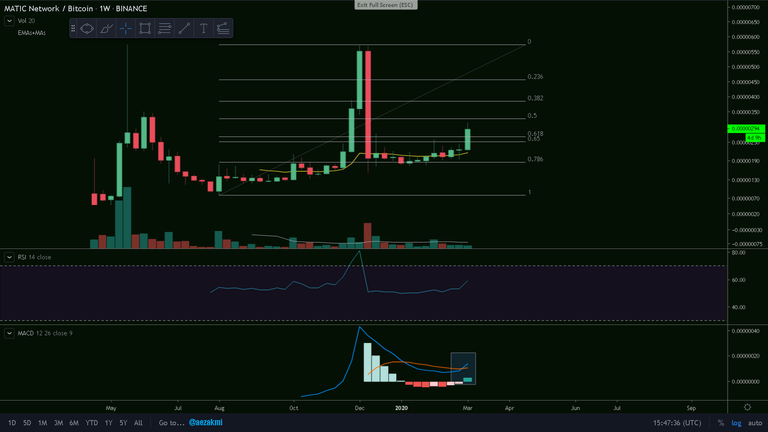
MATIC/BTC Weekly Chart
After a long period between the 0.786 Fibonacci retracement and the 21 weekly EMA (yellow), we finally got last month above the resistance. With the current bullish candle, we've made it above the 0.618 retracement and got stopped at the 0.5. We also have a strong MACD bullish cross, with what seems to be a bullish Histogram starting.
Ctrl + Click here to enlarge the image in a new tab (steemitimages)
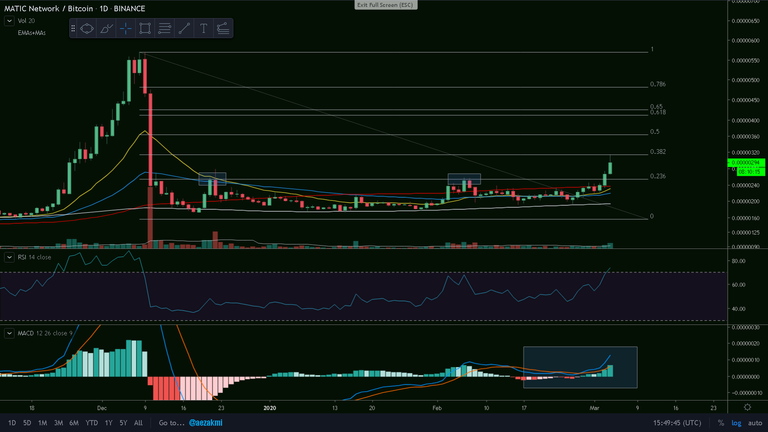
MATIC/BTC Daily Chart
Using the Fibonacci tool on the downtrend, we finally managed to break the 0.236 resistance, after two earlier attempts. All this time, the 200 day MA (grey) was our support level and I assume that we will revisit it in the future, after it starts to go upwards. We got stopped exactly at the 0.382, with the RSI entering the overbought area for the first time after the big dump and the MACD indicating a bullish increasing Histogram. If we retrace back, let's hope that the 0.236 will act as our support.
Ctrl + Click here to enlarge the image in a new tab (steemitimages)


Thanks for reading and safe trading!✌
If you find this post useful, please:
