
Direct from the desk of Dane Williams,
This is not your average forex broker blog.
Morning,
As US stocks went limit down yesterday, I tweeted that it was too bad because a textbook short setup had just formed.
How things played out from there is a beautiful textbook lesson in low risk/high reward trading, even in the midst of market panic.
SPX Daily:
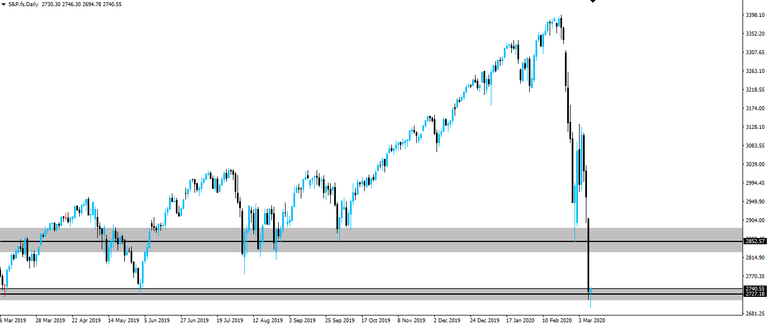
Starting with the higher time frame, daily chart, you can see price was at support from the previous swing low.
In the current climate, that was never going to hold and price soon went through the level and hit its limit down number.
SPX 15 Minute
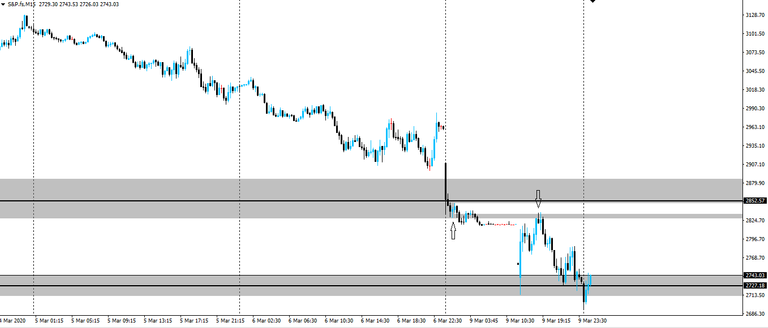
On the intraday, 15 minute chart, price then printed a short term support zone, before going lower and returning to retest it as resistance.
With the market at limit down, this wasn't tradable but as we so often see, we were given a second chance.
The market re-opened lower (at the next level of higher time frame, support from the previous swing low, mind you), but soon retested that exact short term support zone that we were looking to act as resistance.
Sellers immediately stepped in again and the market continued lower back down to the next level of higher time frame support.
So technical that it hurts.
Best of probabilities to you,
Dane.
@forexbrokr | Steemit Blog
Market Analyst and Forex Broker.
Twitter: @forexbrokr