Are you using Date tables in your DAX models? If not, why not? If you are using Power BI or Power Pivot then you should be using a date table in your model. Some people would argue that it is not necessary, but once you try and scale your model, without a date tale, you will be in trouble.
In this article you will learn
- What is a date table
- How and why to disable the load of hidden date tables
- Tips for creating a date table using DAX
- How to create a date table using Power Query
- Why and How you should mark your date table in Power BI
What is a Date Table?
A date table is a dimension table. Used to slice, filter and group data from facts tables. It should be loaded into your model and not created with DAX when possible. Many organisations will have a date table prepared that can be used in different models. If you don’t have one of these maybe you should consider creating one. Make once use many times. The time you spend creating one will be repaid to you over and over.A date table can be as little as 1 column of dates to a much more descriptive table showing bank holidays, quarters and so forth. The dates must span all the dates that you expect to find in your model without skipping a day. One column of dates works fine, however for more detailed time analysis, having a date table that contains details such as Month name and number, year, qtr and so on are a real benefit.
Dimension tables are used to Filter, Group and Slicer data from facts tables and as I have said, a date table is a dimensions table. But a date table also has another role and that is to initiate time intelligence functions in DAX such as SAMEPERIODLASTTEAR
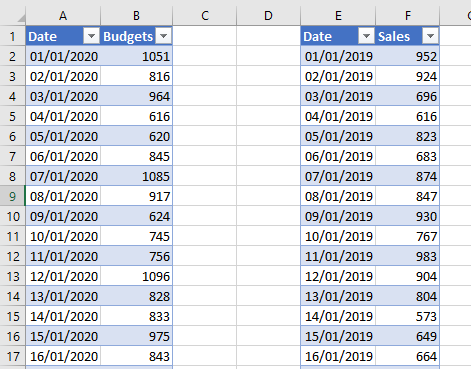
For the following examples, we have two tables of data which we will load into Power BI. One table is a Sales table and the other table is a budgets table.
The sales table contains the sales values for given days along with the corresponding dates in 2019 and the budgets table contains the forecast sales for 2020 to 2023.
How and why to disable load of hidden date tables
When we load tables into Power BI that contain a date column, Power BI will automatically create hidden date tables that will allow you to carry out date comparison and time intelligence function without a full date table.
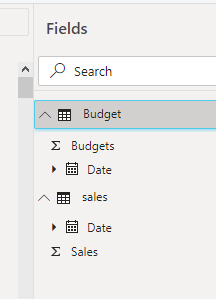
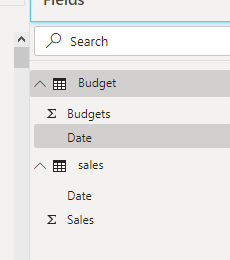
Look at the Fields list. These are the sales and Budget tables above loaded into Power BI. Both the budget table the sales table date columns have this little calendar icon beside them. This shows us that Power BI has identified the date and has create a hidden date table.
Don’t use these date fields. I would suggest you disable Power BI automatically creating date tables. There are a few reasons for this. The first reason is that once you disable them, you cannot carry out time intelligence functions on these columns, forcing you to carry them out on an actual real date table. The second reasons is performance. All these hidden tables take up space in your model and with a large model, can slow it down.
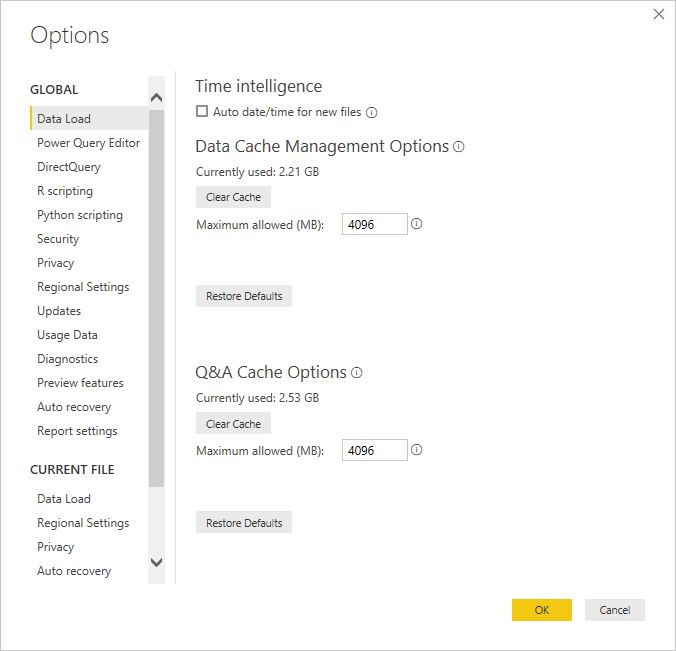
To disable Power BI creating these hidden date tables, go to File, Options and Setting and then Options. You will then have the option to edit the Global settings or the setting for the current workbook.
Under Data Load, uncheck the box for Time Intelligence – Auto date/time for new files.
You can also do this on a global setting. That way any files you work on moving forward, will not create these automatic hidden date tables. However, if you only do it on the current file, you might forget to change the setting next time you are working in Power BI and new files will contain these hidden tables.
Once you deselect this box, Power BI will not create these tables and see in your fields list, the date columns no longer have this little date icon.
How to create a date table using DAX
This is not the preferred solution to creating a date table, however it is important as a DAX user you know what functions are available and how, when you have no other choice, you can use DAX to create a date table.
If you are using Power BI we have a nice little function CALENDERAUTO. This function takes only one argument and that is to define which month of the year is the year end. Not all companies have a year end in December. If January is your year end, you would enter 1 as the argument, if December is your year end you would enter 12
CALENDERAUTO will examine your data and create a list of dates between the earliest date found in your model and the latest date found. This function is not yet available in Excel DAX but it is available in Power BI.
To add a table using DAX, from the Modelling Ribbon select New Table. In the formula bar, we can name this table Datetable and enter our function CALENDERAUTO(12)
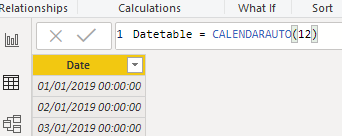
This will then create a table with a DATE column containing the earlier and latest dates found in your model and it fills in all the dates in between.
From the Modeling Ribbon we can also change the format and data type. Shown above the data type is set to Date/Time. We can change this to data type Date and we can also change how the date is displayed from the Format drop down.
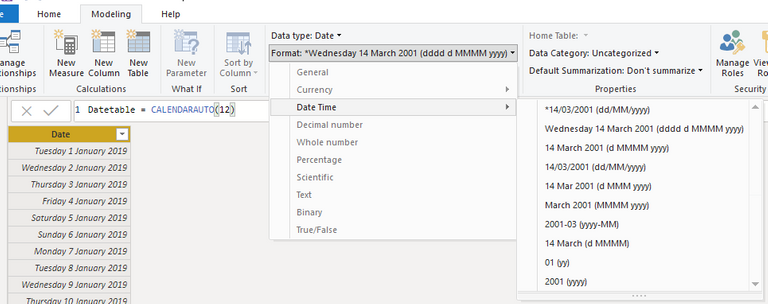
We can then proceed, using the DATE column, to create other columns based on the needs of the analysis.
=Month(date) will return the month number
=Format(date, “mmm”) will show the month name in short
=Year(date) will show the year.
=ROUNDUP(Month/3,0) will return the qtr based on January being the start month
You will find all the same date and time functions in DAX that you have in Excel so there is no need to show you them all in detail in this article.
I would also suggest, if you are creating a date table using DAX that you use variables. The use of variables makes a DAX model more efficient and optimal. We will discuss this in a later article on variables.
How to create a date table using Power Query
I have seen many different options for creating date tables and today I am going to show you the one I use. This will create a dynamic date table, updating with the earlier and latest dates in your model.
The first thing to do is identify which tables have the earlier and latest dates. Very often a sales table would have the earlier date and a budgets table would have the later dates. However if you are using a HR model, employee start date and maybe expected retirement dates would be the best to use.
We are going to use our sample data already loaded to our model. The Sales and Budgets tables.
Create Model Driven Start and End dates.
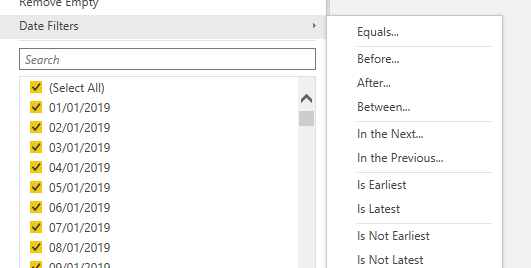
First we would Duplicate the query for the sales table. We will rename this to Earliest date. Then Remove all other columns except the date column. Using the date filter, select Is Earliest.
This will leave us with the earliest date from our sales table. However, this date might occur many times. If this is the case, select remove rows and remove duplicates from the format ribbon. This will make sure we are left with only one value in our table.
Next Right click on this date and select Drill Down.
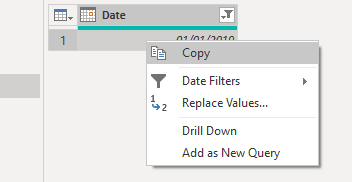
This will convert our table to a single value.
For the latest date, we can copy the Budgets table. We will rename this query Latest Date. Then we can remove all columns except the date column. This time when we filter the table, we will select IS LATEST to return the latest date in the table. If the latest date reoccurs, remove the duplicates so we are left with only one value. Right click on the date and select Drill down to turn this table into a value.
Now we have our earliest date and our latest date. Next, we need to combine these into one table and fill in all the dates in between.
Using M to create our Date table
In Power Query select New source and Blank query from the home ribbon
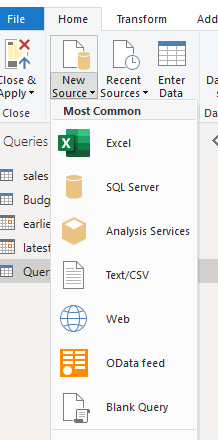
This will open a blank query and the formula bar will be active. In the formula bar enter the following
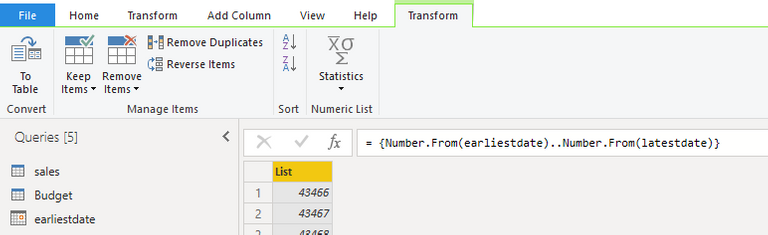
= {Number.From(earliestdate)..Number.From(latestdate)}
This will create a list of numbers between the earliest and latest dates. As this is only a list we then need to select Convert to Table
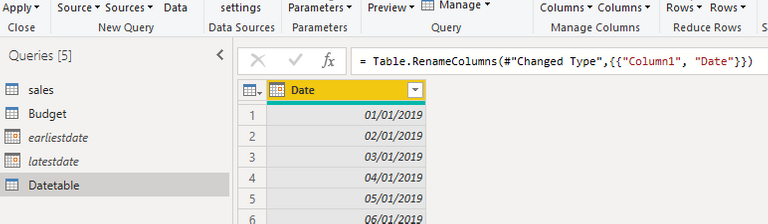
The next step is to transform the data type to Date and rename the column to date, and the query to date table.
Expanding our Date Table by adding Columns in Power Query
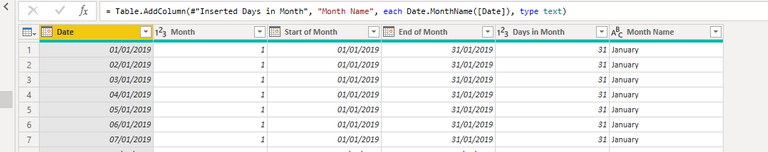
Additional columns can be added to this date table as needed. The Add Column Ribbon contains a suite of date functions that allow us to use the date filed and define the like of the Year, Month name and so forth.
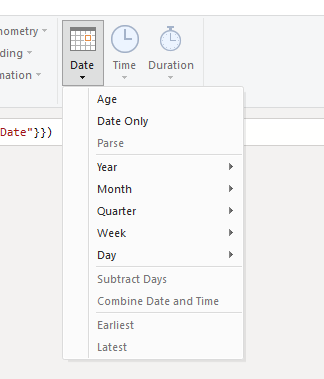
For example, Columns you can add relating to the month include Month Number, Start of Month, End of Month, Number of Days, Month Name.
Adding Custom Columns
If you wanted to add a sort by column which is often based on the combination of two date fields, we can use the Custom Columns option.
Select Add new column, Custom Column.
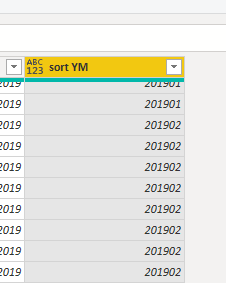
Add a column name, such as sort YM. The custom function I have used is
=[Year]*100+[Month]
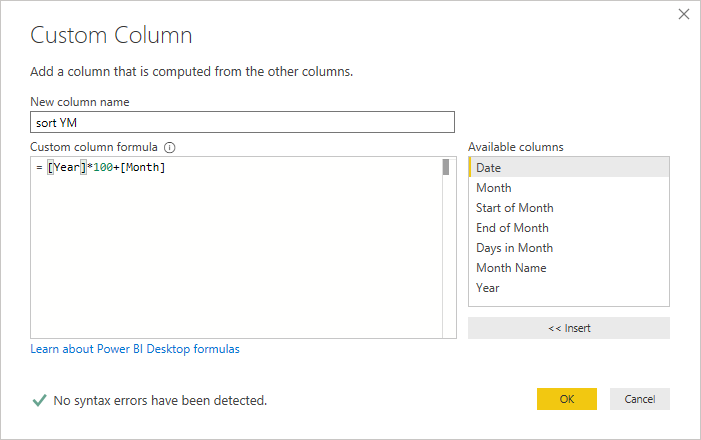
This will create a column that will take the year, for example 2019 and multiple this by 100, giving 201900 and then we add the month number, so for January it adds 1 giving 201901.
Load table into the model
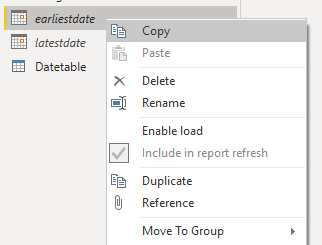
Once we are happy with our date table created in Power Query we can load it into our model. I would first suggest that you disable the load of the earliest and latest dates.
Once loaded to our model, we can then create our relationships between the date table and the sales table and the date table and the budgets table.
Marking a Date Table
Why mark a date table?
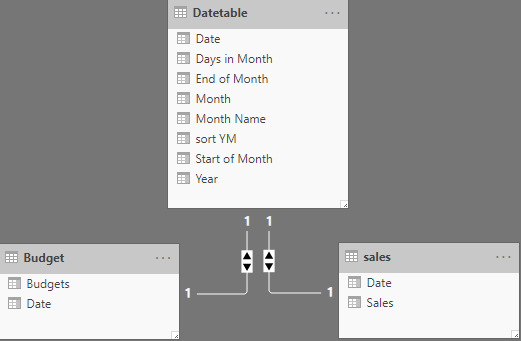
Consider the following three tables of data which we will load into Power BI. The first table is a date table, the second has sales values and the third table is a products table.
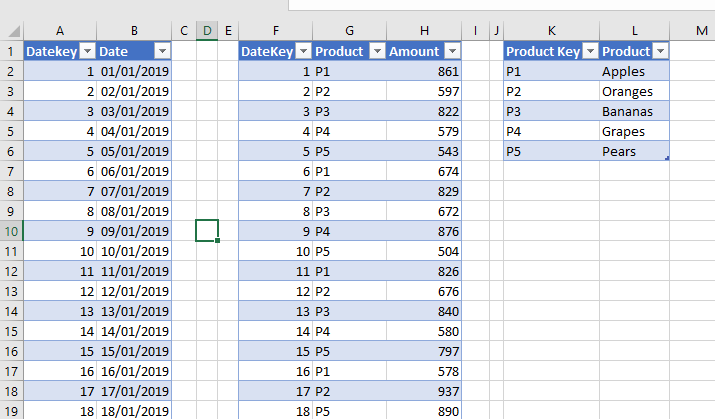
The date table contains a date key, and the sales table also contains a date key. Using Power Query, when I load this data into the model, I will add a new column to the date table for the year.
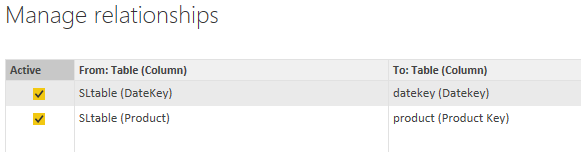
The relationships can be set up as follows
We will now create two measures, one to get the total sales, and the other to get the same period last year
t.sales = sum(SLtable[Amount ])
and
sply = CALCULATE([t.sales],SAMEPERIODLASTYEAR(datekey[Date]))
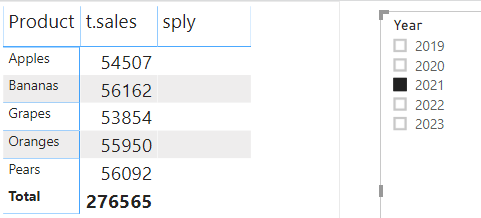
Next we will create a pivot table. We will add the product from the products table to the rows, and our measures for our values. We will also add a filter for the years.
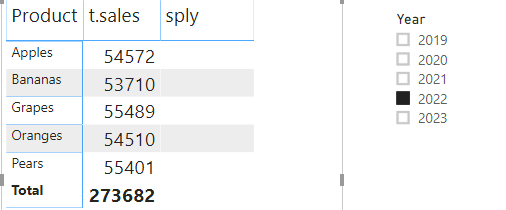
Note how the same period calculation is showing up blank, even though we have selected the year 2022. If we select 2021 we can see there are sales recorded for that period.
So why is this not working? Well because the date table has a date key, this column is the unique identifier and is used in the relationships. DAX does not know this is a date table and so it is unable to preform the calculations correctly. In cases like this, we need to mark a date table as a date table.
How to mark a date table
In the table view of PowerBI, Select the Date table. From the Modeling Ribbon select Mark as Data Table
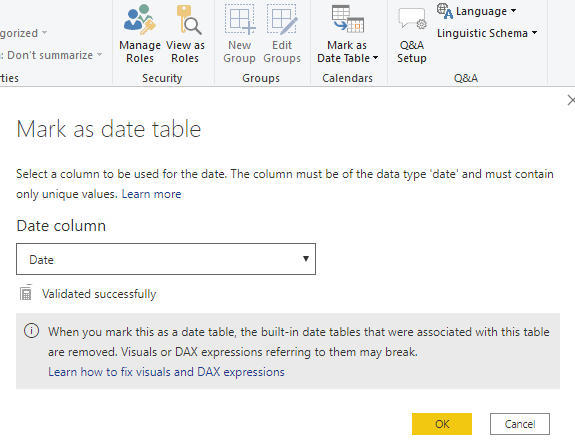
This will open the Mark as date table option box. From here you need to select the Date column so PowerBI knows which column contains the unique list of dates.
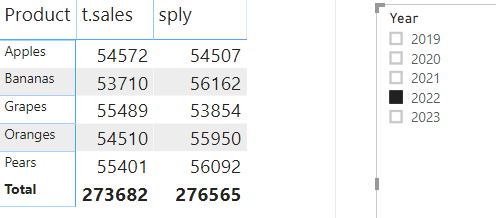
Now when we look at our Pivot table we can see the same period last year calculation works just fine.
Take A FREE course with us Today!

- includes XLOOKUP and will soon include Dynamic Arrays


Power Query Excel 365

Best Value Excel and Excel Power Tool Learning. Access All Areas, Unlimited Learning Subscription

SIGN UP
- includes XLOOKUP and will soon include Dynamic Arrays
Power Query Excel 365
SIGN UP
Conclusion
So there you have it. Plenty of whys and hows of using date tables in Power BI or in Power Pivot. For DAX users, Power Query is your friend. Don't be afraid to use it to optimist your DAX model, especially when you are creating date tables.
SIGN UP
Cross posted from my blog with SteemPress : https://theexcelclub.com/date-tables-for-dax-users-power-bi-and-power-pivot/