The Outline Feature in Excel
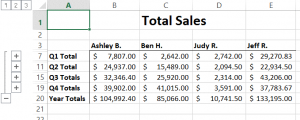
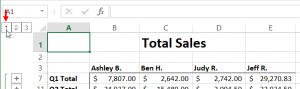
Excel’s automatic outlining feature makes outlining a worksheet easy. Automatic outlining works best with numerical data organized into groups and sub groups by formulas or functions. For example, the sample image below contains monthly sales data, organized into quarterly and yearly totals using formulas:
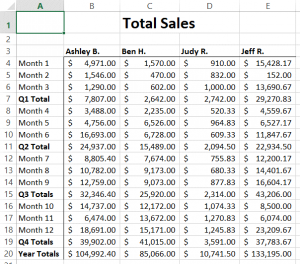
As you can see, it can be difficult to discern the quarterly and yearly totals at a glance because they blend in with the other data in the worksheet. To help get around this problem, you can outline the data. To start, click Data → Group → Auto Outline:
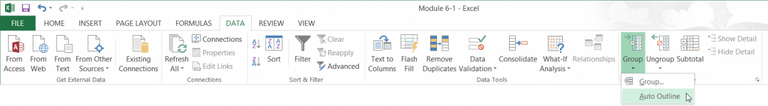
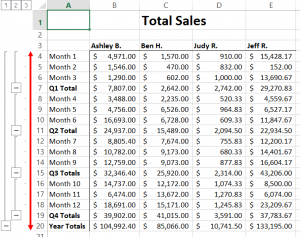
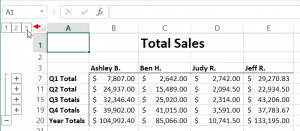
The results of Excel’s automatic outlining feature will now be displayed:

You will see that outline group indicators (the thick black lines that look like large brackets) and collapse buttons (marked with a minus sign) are now part of the worksheet:
Showing and Hiding Outline Details
In the sample worksheet, each quarter has been grouped with the other quarters. As well, each year has been grouped together. (In this case, there is only one year.)
Click the collapse buttons beside each quarter:
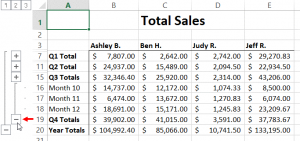
Now, only the quarterly and yearly totals are displayed:
Using this method, you can quickly hide the details of your spreadsheet and only view the totals. However, there is an even faster way of hiding and showing the details of an outlined spreadsheet.
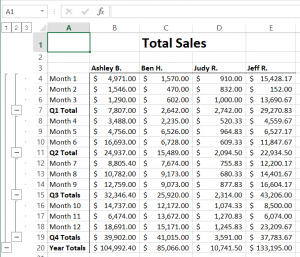
At the top of the worksheet, there are numbered buttons arranged in a row. Clicking on these buttons will expand or collapse all of the rows in a worksheet to show or hide the details. For example, click on the number 3 button:
You will now see the full details of your worksheet:
Click on the number 2 button:
This action will collapse the worksheet to only the second level of detail for the rows and/or columns. In this example, this means that only the quarterly totals will be shown:
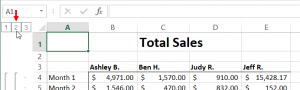
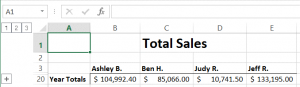
Click on the number 1 button:
This action will collapse the worksheet to only the first level of detail for the rows and/or columns. In this case, only the year total will be displayed:
Next week we will take a look at Grouping Data and creating subtotals.
Take A FREE course with us Today!

- includes XLOOKUP and will soon include Dynamic Arrays


Power Query Excel 365

Best Value Excel and Excel Power Tool Learning. Access All Areas, Unlimited Learning Subscription

Sign up Now
Cross posted from my blog with SteemPress : https://theexcelclub.com/its-rather-simple-to-use-the-outline-feature-excel/
very nice...