Hi guys and gals hope you're doing good. Cardano is the coin that is going for better than the Bitcoin in other top altcoins. Today we will try to understand the movement of the price action of ADA coin what it can do next.
The difference between Cardano’s move and other cryptocurrencies:
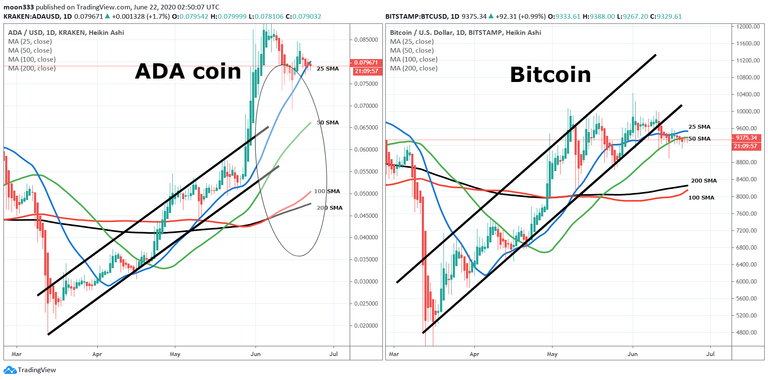
As in the below chart it can be easily observed that the ADA and Bitcoin both have formed up channels on daily charts after the mid of March 2020. And there were many more other cryptocurrencies that have formed same as like this up channel following the movement of the Bitcoin. But the difference between the Cardano and all other cryptocurrencies is that ADA has broke out the resistance of this channel on 30th of May but on the other side the Bitcoin and many other top altcoins have broken down the support of the channel.
I have also placed the simple moving averages with the time period of 25, 50, 100 and 200. And when the Cardano broke out the resistance of the channel then there was a big distance between the price action and all the simple moving averages. So there were two possibilities whether the price action starts a correction rally to the downside up to the nearest available moving average to have some support over the moving averages or the moving averages move up to provide the support to the price action. And finally the moving averages moved up to provide the support the price action and that is really very positive move. At this time the price action is at the support of 25 simple moving average and 50 simple moving average is also moving up. And if we watch the 100 and 200 simple moving averages then recently the 100 simple moving average has crossed up the 200 moving averages. After this cross a complete opened alligator mouth is formed by the simple moving averages. As now we have the smallest time period moving average above all other moving averages and the biggest time period moving average is below all the moving averages. On the other side on BTC chart we have the smallest moving average above all other MAs but the biggest time period moving average so far is not below all the moving averages therefore the ADA coin has potential to move against the market its mean that if the Bitcoin will be moving down then it is possible that Cardano will maintain its position.
The exponential moving averages and their synchronized movement with indicators:
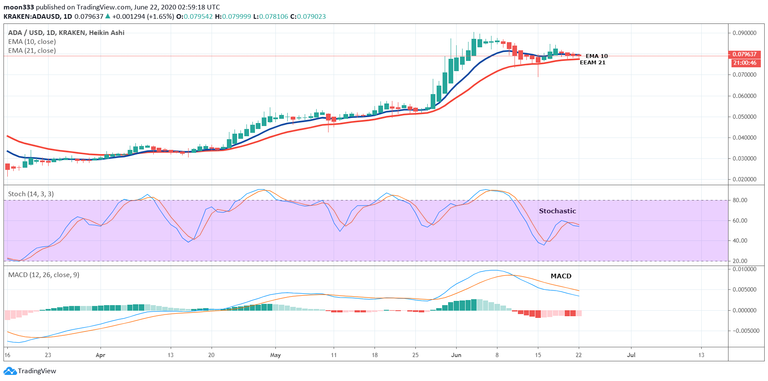
If you watch the exponential moving averages with time period of 10 and 21 then it can be easily observed that since the priceline of ADA has crossed up these two exponential moving averages then it is using them as good support. I have also observed the movement of the price action above these two EMAs is very much synchronized with stochastic and MACD indicators. Because whenever the price action touches the exponential moving averages and stochastic gives the bull cross and MACD also turns bullish then the price action starts next bullish rally until it re-tests the exponential moving averages again. This time when the price action again touched the EMAS then stochastic gave bull cross and MACD also truned weak bearish from strong bearish that is also a bullish signal. Then ADA tried to start the next rally. But again the stochastic has given bear cross and the MACD also turned strong bearish in the price action again moved at the support of these to EMAs. Now the MACD is again turning bullish. If the price action will be still on these EMAs and stochastic will again give the bull cross then it is possible that the price action of Cardano will start the next bullish rally.
Different support and resistance level and re-testing of resistance as support:
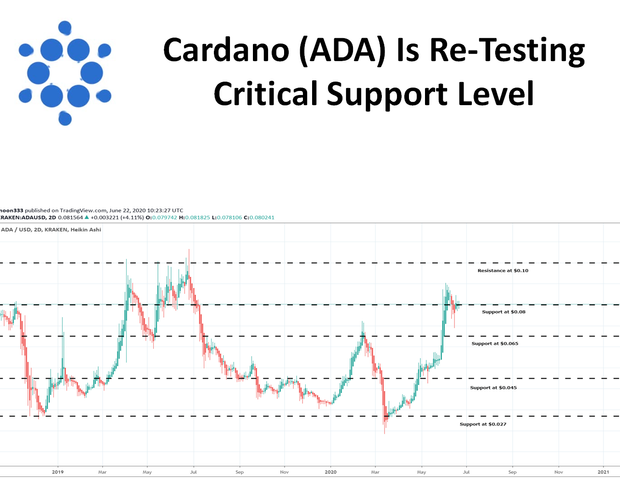
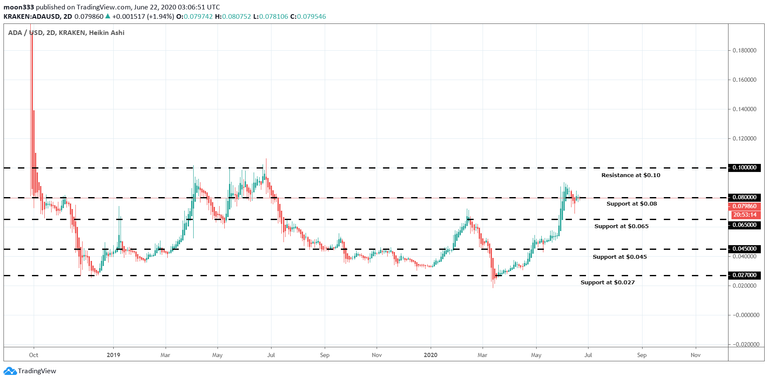
Now if we switch to the two day chart then on this chart the different support and resistance levels can be seen very clear. In the month of March 2020 the price action bounced from the last support of $0.027 and crossed up the next resistance of $0.045. The price action retested the previous resistance as support and crossed up the $0.065 resistance level and after breaking out the next resistance level the price action has broken out the $0.08 resistance level as well. At this time the price action is retesting $0.08 resistance as a support. If this retest will be successful then the priceline of ADA can move up to the next resistance level that is at 10 cents. Otherwise it can move back to the previous resistance level of $0.065 to re-test it as a support. Now the next move of the Cardano whether to the upside and downside depends on this retesting of previous resistance level as support.
Click here to create free account on tradingview to watch and play the chart on realtime
Conclusion:
So far the price action of Cardano is more bullish than Bitcoin and other top cryptocurrencies. Therefore we can expect that ADA can be a safe heaven at the time when the Bitcoin will start correction rally. However we can set a stop loss at next support level that is $0.065 to minimize the risk of investment.
Note: This idea is education purpose only and not intended to be investment advice, please seek a duly licensed professional and do you own research before any investment.