
Welcome to the daily financial report about the Hive blockchain.
All the information presented in this report is based on the data collected from the blockchain until 2022-04-11 midnight UTC. This report aims to provide you with a clear view of what is happening on the Hive blockchain.
 Este post está traducido al español - aquí
 Dieser Beitrag ist ins Deutsche übersetzt - hier
 Une version en français de ce post est disponible - ici
1. Price
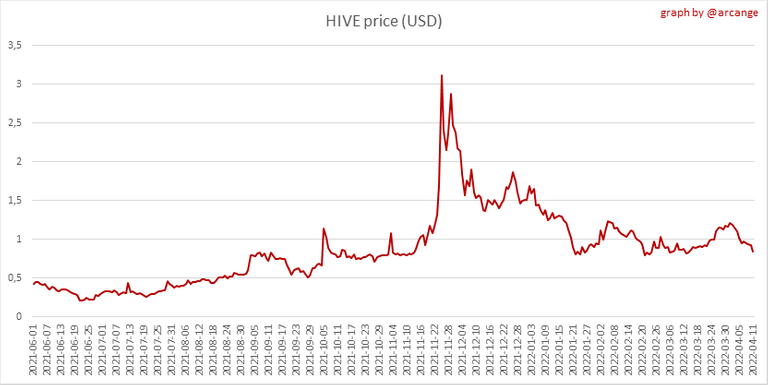 | 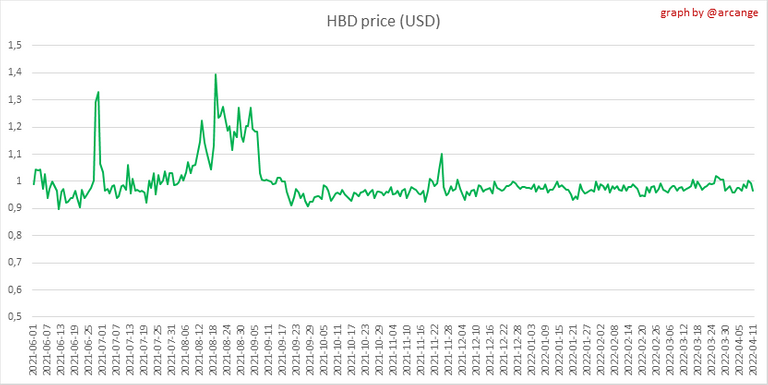 |
These graphs show the evolution of prices in USD for HIVE and HBD.
2. Supply
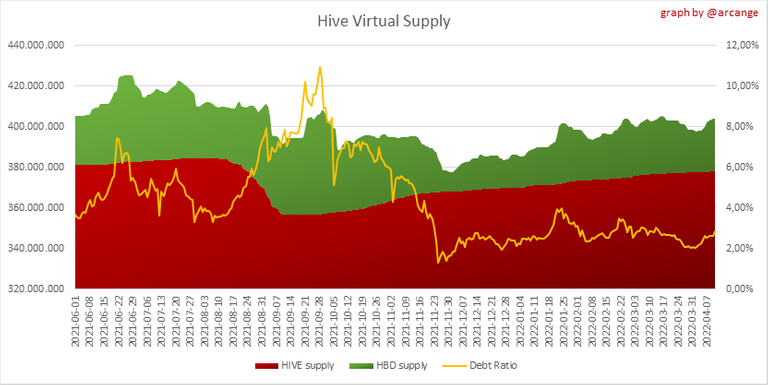
This graph shows the evolution of HIVE virtual Supply. The virtual supply is the sum of HIVE supply (liquid and staked HIVE) and HBD supply (converted into HIVE).
The graph also displays the debt ratio (HBD supply / HIVE virtual supply). Keep in mind that since hardfork 24 funds in the treasury (@hive.fund HBD balance) don't count towards the HBD debt ratio.
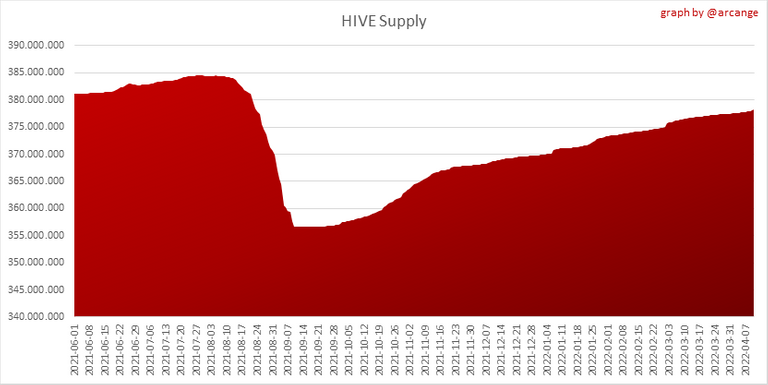 | 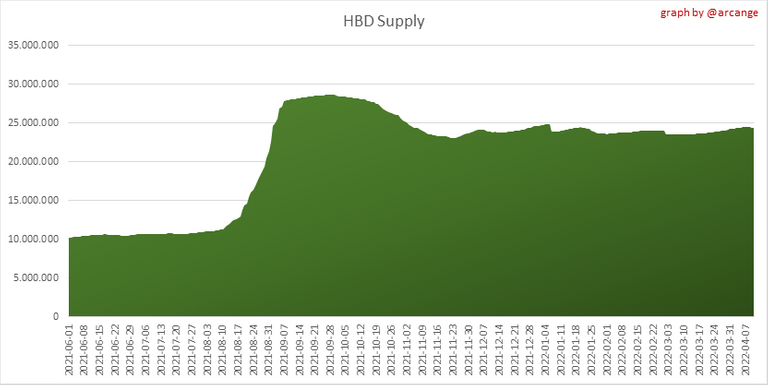 |
These graphs show the evolution of the HIVE Supply (both liquid and staked) and the HBD supply.
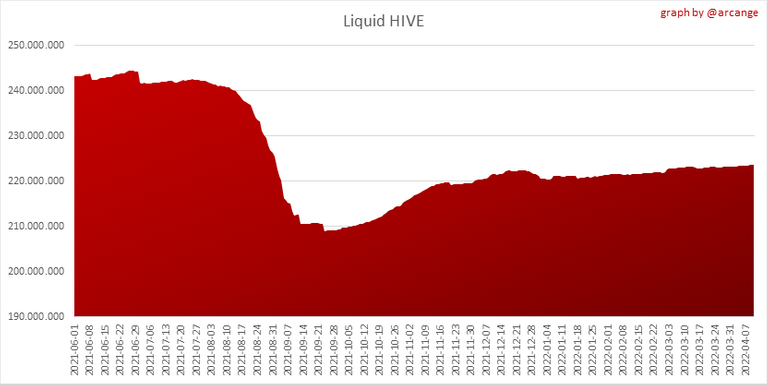 | 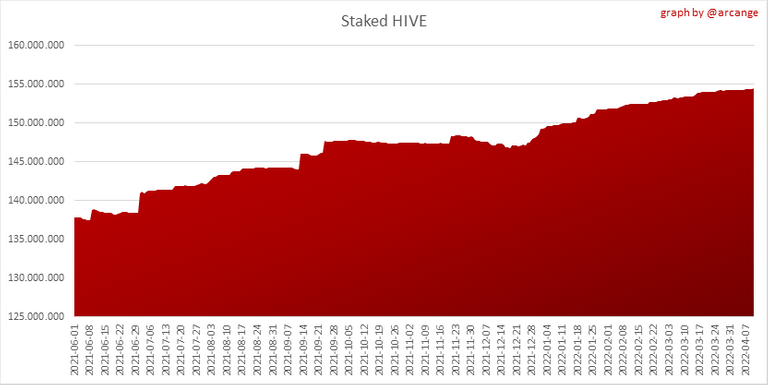 |
These charts show the evolution of the liquid HIVE and the staked HIVE (Hive Power).
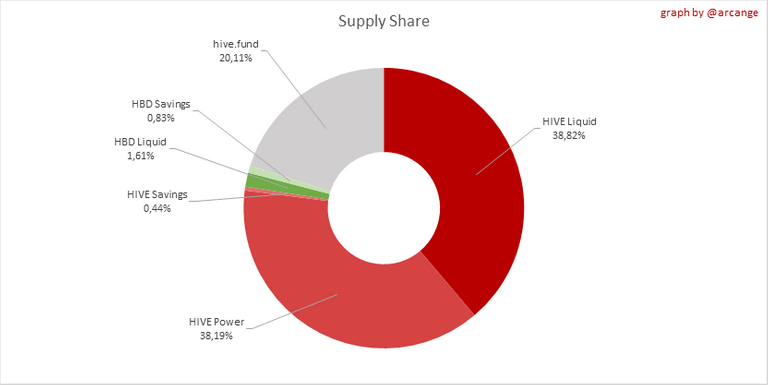
This graph shows the overall Hive tokens distribution.
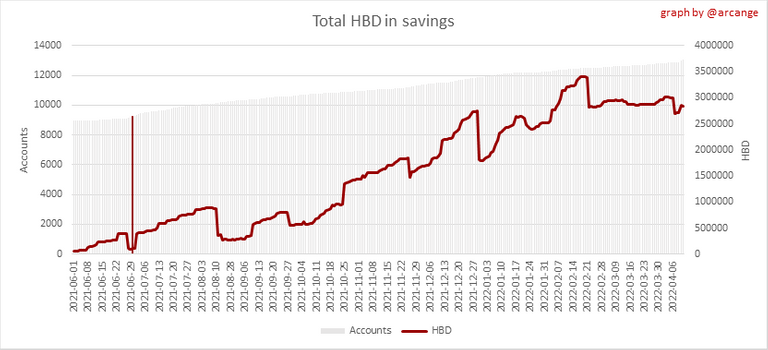
3. HBD Savings
| Account | Deposit | Account | Withdrawal |
|---|---|---|---|
| @hivelot | 4,397.352 HBD | @jywahaha | 3,000.000 HBD |
| @namelessnameless | 3,564.414 HBD | @dwarflordnoj | 1,317.544 HBD |
| @walterjay | 2,700.000 HBD | @kephler | 668.850 HBD |
| @apshamilton | 1,800.000 HBD | @hrichakar | 300.000 HBD |
| @galenkp | 1,093.544 HBD | @myfreebtc | 120.000 HBD |
| @reazuliqbal | 1,005.414 HBD | @sucal | 71.455 HBD |
| @teammo | 1,000.000 HBD | @rob23 | 42.204 HBD |
| @jywahaha | 1,000.000 HBD | @veteranforcrypto | 34.277 HBD |
| @hakeke | 800.000 HBD | @udabeu | 22.222 HBD |
| @ace108 | 800.000 HBD | @forykw | 17.655 HBD |
This graph shows how much and how many accounts store HBD in savings. The table below shows the topmost HBD deposits and withdrawals of the day.
Note: As of 2021-06-30 (HF25) interest is only paid for HBD which are stored in savings.
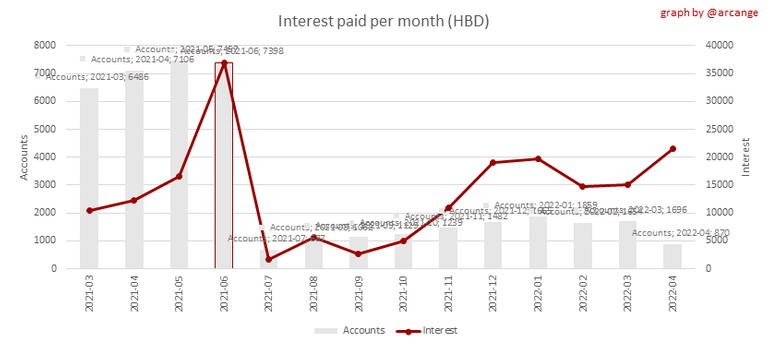
This chart shows the amount of interest paid each month for holding HBD and how many accounts received such interest.
4. Balances
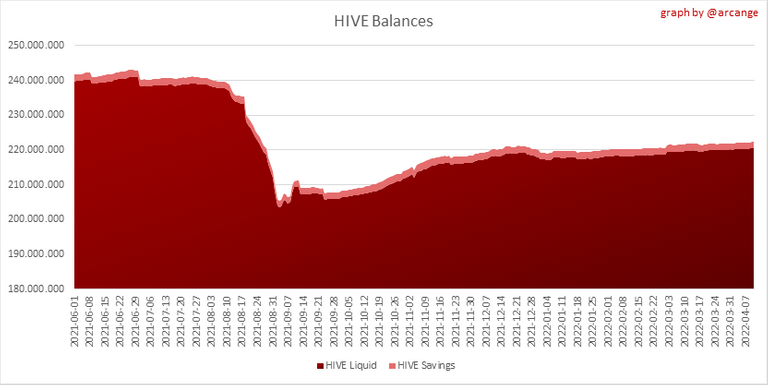
This graph shows the number of HIVE, both liquid and in savings, held by all accounts.
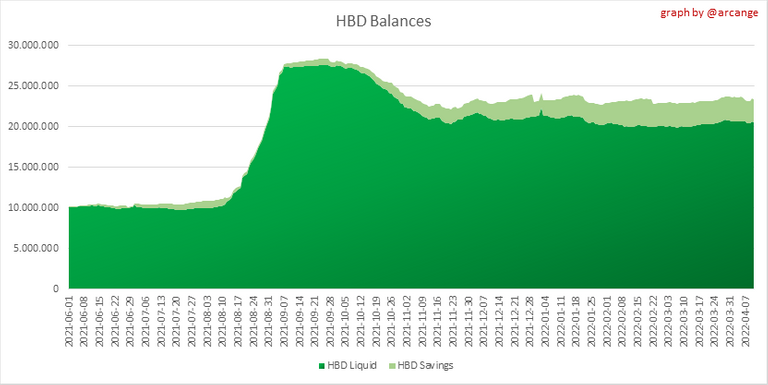
This graph shows the number of HBD, both liquid and in savings, held by all accounts.
5. Conversions
Note: As a reminder, conversion requests are only finalized after 3 days. It is only then that it is known exactly how many HIVE were burned in return for the HBD received at the time of the conversion request.
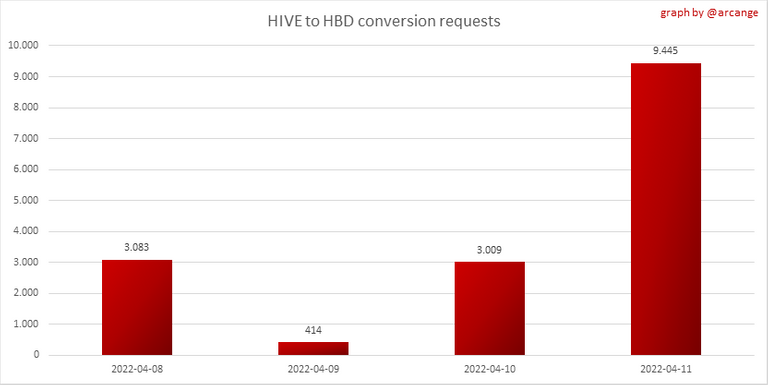
This graph shows the number of HIVE collateralized due to requests to convert HIVE to HBD over the past few days.
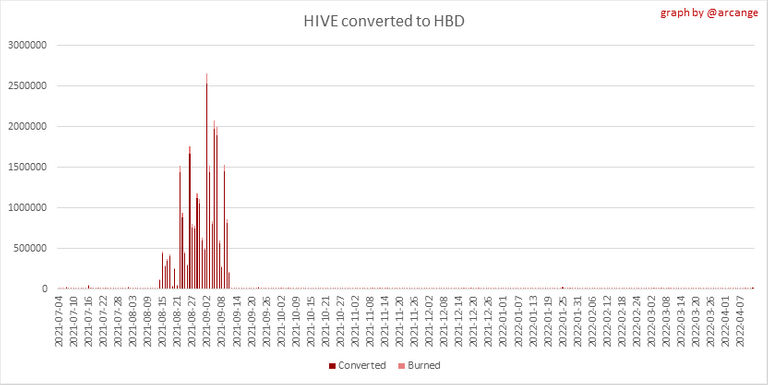 | 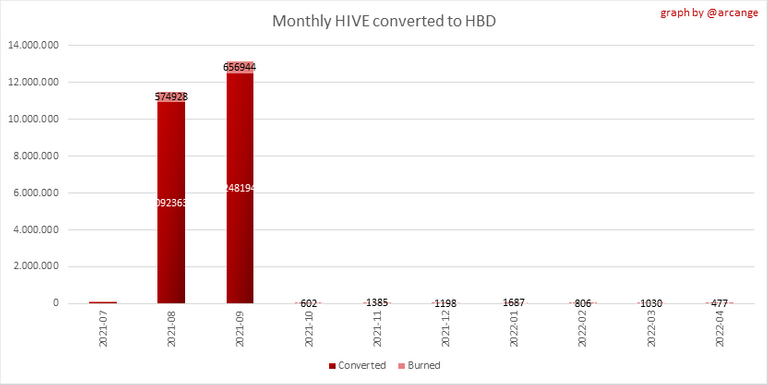 |
These graphs show the number of HIVE effectively used by the conversion process (HIVE converted and 5% HIVE fee which is burned) each day and month when requests to convert HIVE to HBD have been finalized.
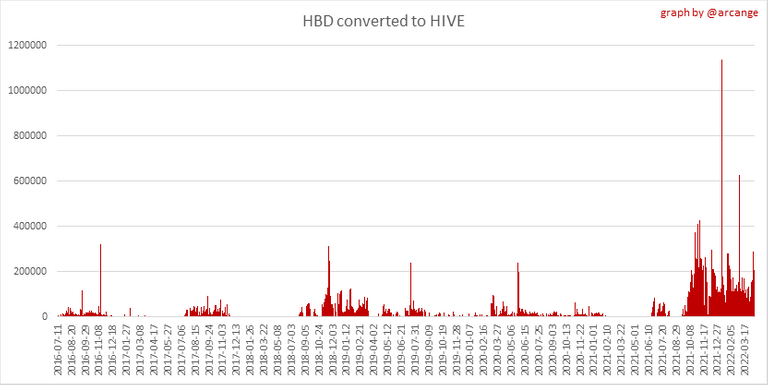 | 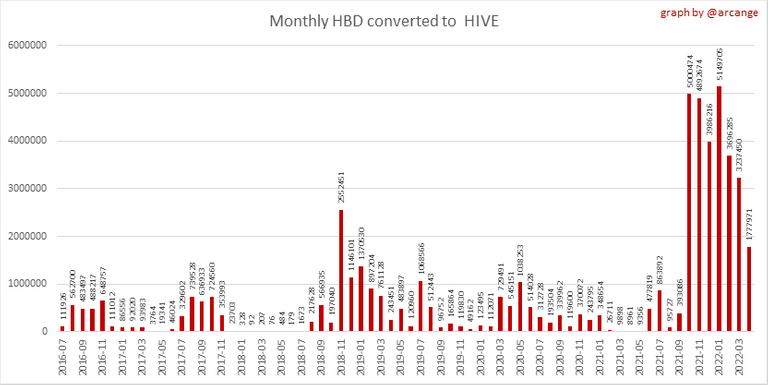 |
These graphs show the number of HBD burned, each day and each month, following requests to convert HBD to HIVE.
6. Powerup and Powerdown
| Date | Account | Amount |
|---|---|---|
| 2022-04-11 05:26:51 | @emrebeyler | 13,000.663 HIVE |
| 2022-04-11 02:33:00 | @aliento | 10,500.634 HIVE |
| 2022-04-11 02:33:39 | @eddiespino | 6,975.421 HIVE |
| 2022-04-11 12:39:54 | @martin.mikes | 6,955.664 HIVE |
| 2022-04-11 12:39:45 | @martin.mikes | 6,955.664 HIVE |
| 2022-04-11 05:03:45 | @luca1777 | 6,437.716 HIVE |
| 2022-04-11 02:31:48 | @offgridlife | 5,000.302 HIVE |
| 2022-04-11 07:32:45 | @samminator | 3,000.250 HIVE |
| 2022-04-11 11:22:54 | @teammo | 3,000.213 HIVE |
| 2022-04-11 03:03:12 | @zoidsoft | 2,352.142 HIVE |
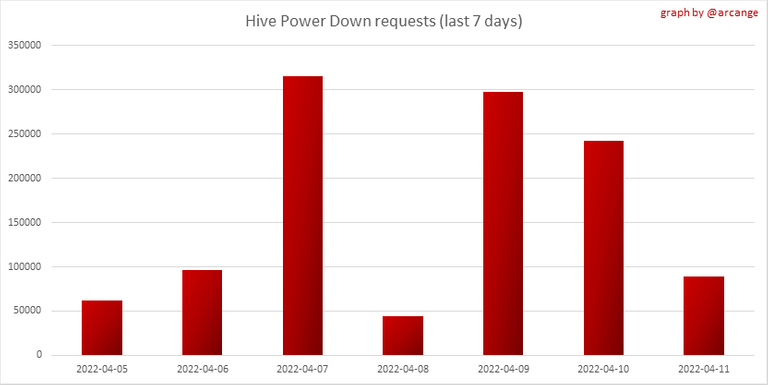
This graph and table show the amount of powerdown initiated over the last 7 days, and the largest initiated on this day.
| Account | Powerup | Account | Powerdown |
|---|---|---|---|
| @namelessnameless | 5,002.000 HIVE | @drbanner | 22,746.813 HIVE |
| @newsflash | 4,306.645 HIVE | @curatorhulk | 13,944.260 HIVE |
| @grootwr | 2,799.991 HIVE | @btu | 7,993.624 HIVE |
| @cryptodive | 1,097.980 HIVE | @trasto | 5,443.804 HIVE |
| @ecoinstats | 703.000 HIVE | @drorion | 3,933.407 HIVE |
| @howzat | 650.084 HIVE | @deathwing | 1,802.915 HIVE |
| @aljif7 | 499.504 HIVE | @nainaztengra | 1,786.537 HIVE |
| @balte | 400.000 HIVE | @curie | 1,405.347 HIVE |
| @padreelferenco | 300.000 HIVE | @omonomo | 1,289.133 HIVE |
| @oniriusz | 299.990 HIVE | @steempty | 1,200.822 HIVE |
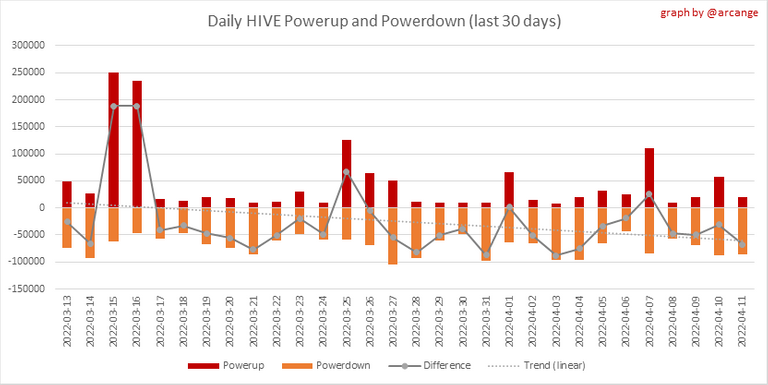
This graph shows the daily HIVE power-up, power-down, and the resulting variation over the last 30 days. The table shows the topmost power-ups and power-downs of the day.
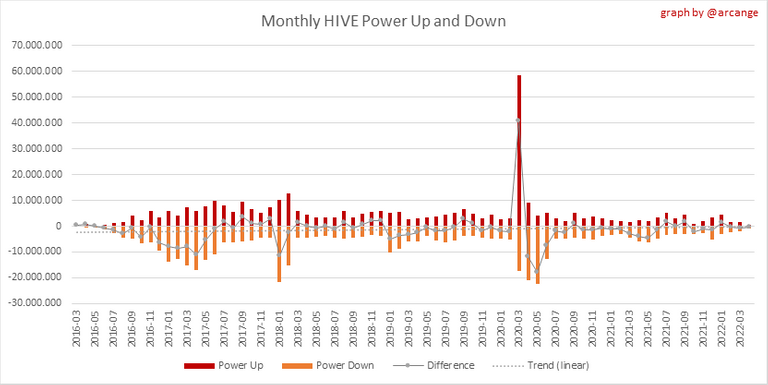
This graph shows the monthly HIVE power-up, power-down and the resulting variation.
Values for the last 3 months
| Period | Powerup | Powerdown | Difference |
|---|---|---|---|
| 2022-04 | 380,137.000 | 815,083.000 | -434,946.000 |
| 2022-03 | 1,495,982.000 | 2,097,310.000 | -601,328.000 |
| 2022-02 | 1,749,531.000 | 2,228,644.000 | -479,113.000 |
7. Transfers
These graphs show the volume (in USD) of HIVE and HBD transferred between accounts.
8. Exchanges
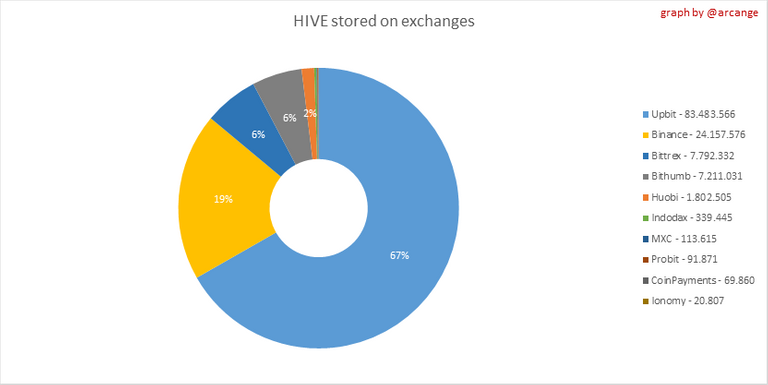 | 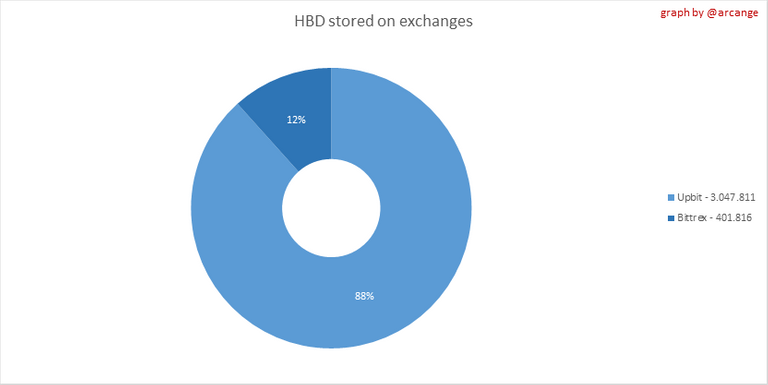 |
These graphs show the amount and distribution of HIVE and HBD stored on the exchanges where they are listed.
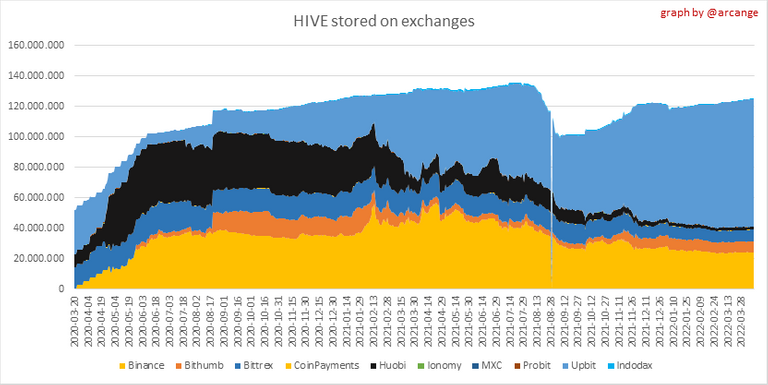 | 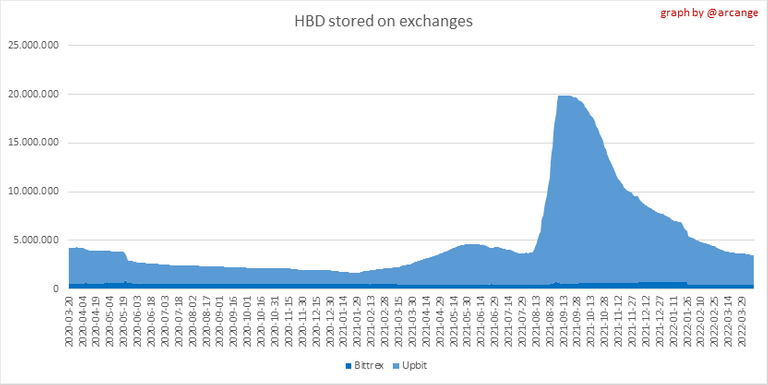 |
These graphs show the daily evolution of HIVE and HBD stored on the exchanges where they are listed.
I hope you find those stats useful. If you would like to see additional stats, feel free to drop me a comment. Your feedback is than welcome.
Thanks for reading.
Check out my apps and services


Do you know if UpBit pays Koreans anything extra for inflation on HIVE? Sounds crazy so much in there and if they don't pay, it's quite a big quantity they are getting for free at users' cost.
Exchanges (like upbit) don't benefit from HIVE inflation unless they do not power up the HIVE they hold. AFAIK, the only one who did was Binance when they got tricked by JS.
(I completely forgot it was not powered up) 🤦♂️ of course... But I wanted to know if they have some sort of scheme/option behind the scenes to offer people inflation via "lock" up. Not that it makes sense for anyone to do it, but to understand if they are coming up with any strategy.
I guess then lots of people are just holding to it there... with intentions of selling it higher. Not sure why people don't understand there is more benefit on having it either on HBD or Power Up.
I can only assume for trading volume (bots) or maybe JS has not yet given up.
As the power down period is quite long, I doubt any exchange would take the risk or propose to their customers to do so.
$WINE
Congratulations, @theguruasia You Successfully Shared 0.300 WINEX With @arcange.
You Earned 0.300 WINEX As Curation Reward.
You Utilized 3/3 Successful Calls.
Contact Us : WINEX Token Discord Channel
WINEX Current Market Price : 0.250
Swap Your Hive <=> Swap.Hive With Industry Lowest Fee (0.1%) : Click This Link
Read Latest Updates Or Contact Us