
Welcome to the daily financial report about the Hive blockchain.
All the information presented in this report is based on the data collected from the blockchain until 2022-06-30 midnight UTC. This report aims to provide you with a clear view of what is happening on the Hive blockchain.
 Este post está traducido al español - aquí
 Dieser Beitrag ist ins Deutsche übersetzt - hier
 Une version en français de ce post est disponible - ici
1. Price
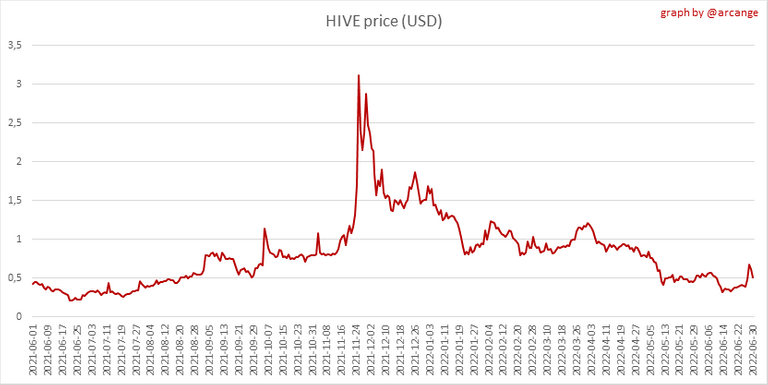 |  |
These graphs show the evolution of prices in USD for HIVE and HBD.
2. Supply
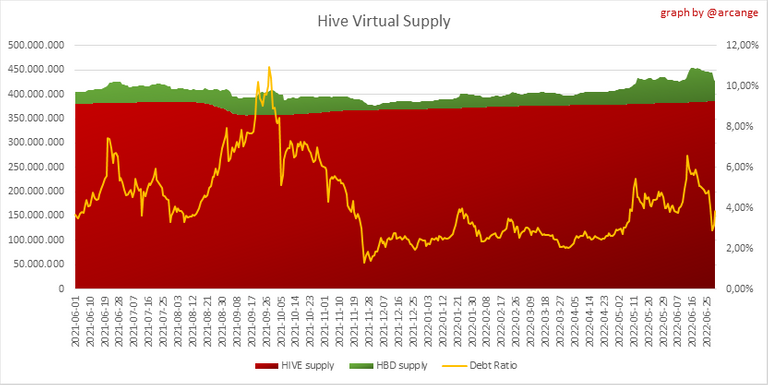
This graph shows the evolution of HIVE virtual Supply. The virtual supply is the sum of HIVE supply (liquid and staked HIVE) and HBD supply (converted into HIVE).
The graph also displays the debt ratio (HBD supply / HIVE virtual supply). Keep in mind that since hardfork 24 funds in the treasury (@hive.fund HBD balance) don't count towards the HBD debt ratio.
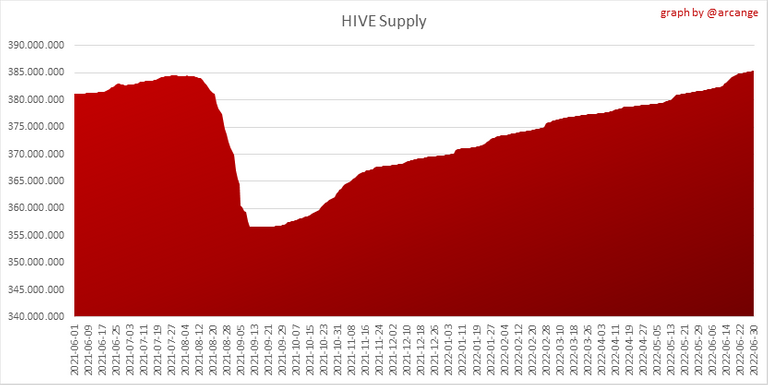 | 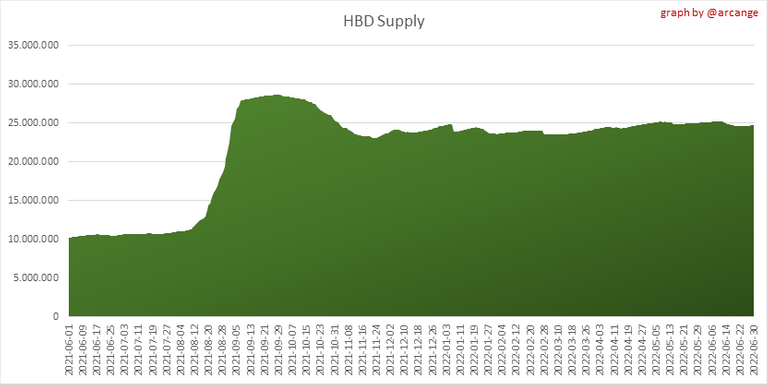 |
These graphs show the evolution of the HIVE Supply (both liquid and staked) and the HBD supply.
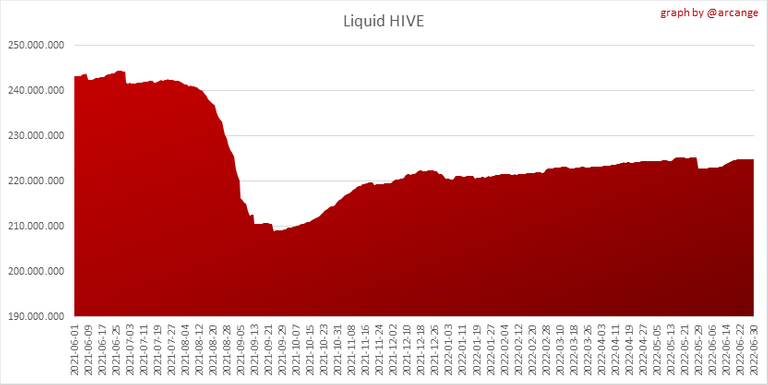 |  |
These charts show the evolution of the liquid HIVE and the staked HIVE (Hive Power).

This graph shows the overall Hive tokens distribution.
3. HBD Savings
| Account | Deposit | Account | Withdrawal |
|---|---|---|---|
| @bluerobo | 491.611 HBD | @ophibious | 860.000 HBD |
| @keychain | 394.450 HBD | @urun | 400.000 HBD |
| @hiveauth | 324.984 HBD | @phortun | 250.000 HBD |
| @mcsherriff | 273.241 HBD | @knowhow92 | 225.671 HBD |
| @phoenixskye | 227.682 HBD | @ifarmgirl | 200.000 HBD |
| @jazzhero | 200.053 HBD | @genesishealthy | 120.000 HBD |
| @bulldog1205 | 154.249 HBD | @rafa-noor | 75.490 HBD |
| @communitybank | 125.000 HBD | @urun1 | 63.509 HBD |
| @teesart | 101.055 HBD | @der-prophet | 40.111 HBD |
| @hivesql | 99.984 HBD | @from-mars | 32.907 HBD |
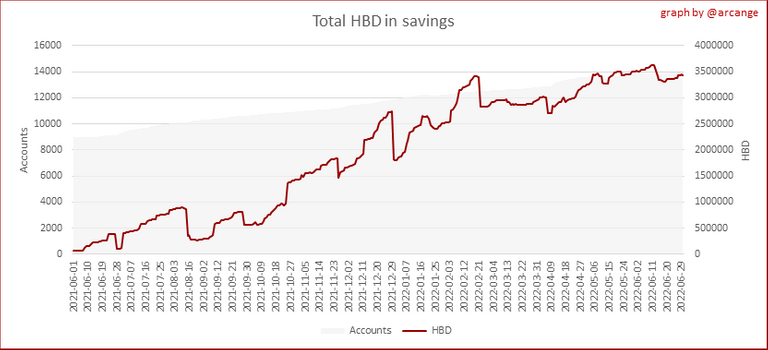
This graph shows how much and how many accounts store HBD in savings. The table below shows the topmost HBD deposits and withdrawals of the day.
Note: As of 2021-06-30 (HF25) interest is only paid for HBD which are stored in savings.
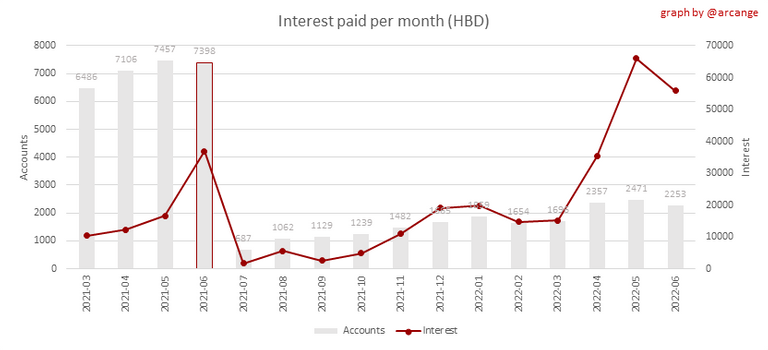
This chart shows the amount of interest paid each month for holding HBD and how many accounts received such interest.
4. Balances
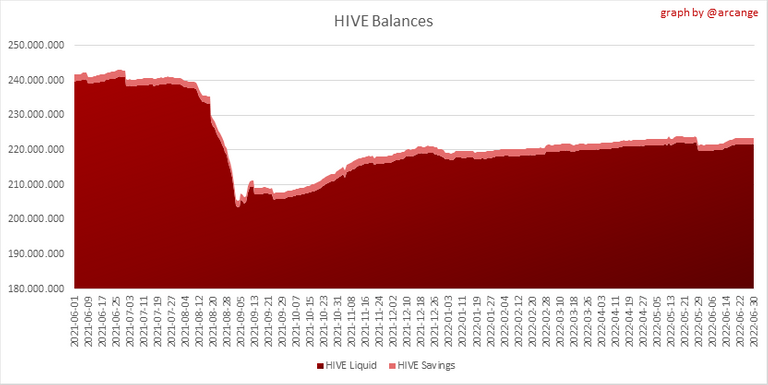
This graph shows the number of HIVE, both liquid and in savings, held by all accounts.
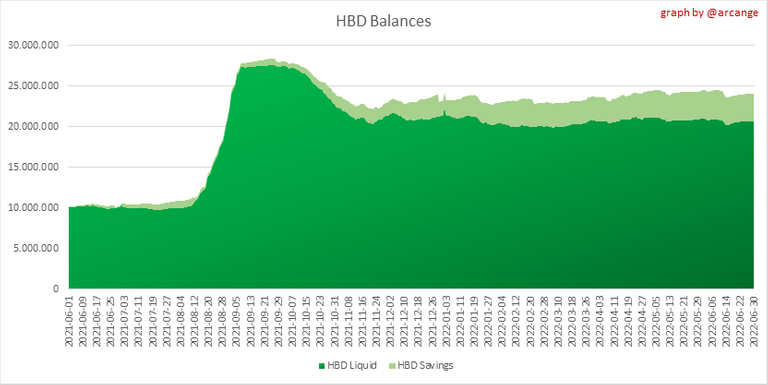
This graph shows the number of HBD, both liquid and in savings, held by all accounts.
5. Conversions
Note: As a reminder, conversion requests are only finalized after 3 days. It is only then that it is known exactly how many HIVE were burned in return for the HBD received at the time of the conversion request.
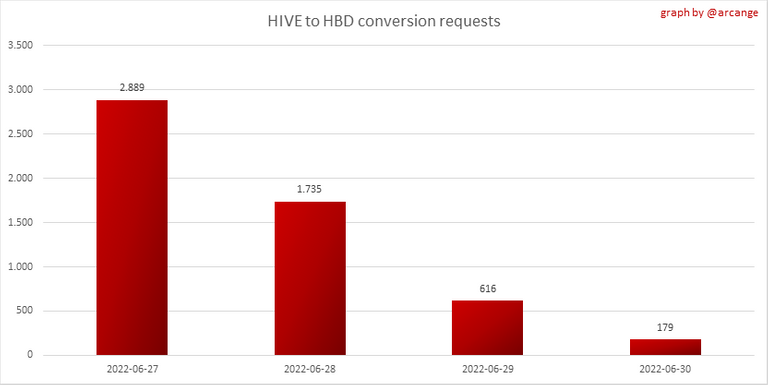
This graph shows the number of HIVE collateralized due to requests to convert HIVE to HBD over the past few days.
 | 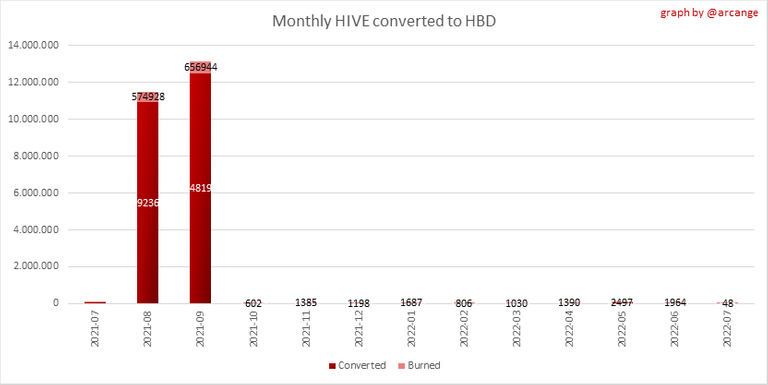 |
These graphs show the number of HIVE effectively used by the conversion process (HIVE converted and 5% HIVE fee which is burned) each day and month when requests to convert HIVE to HBD have been finalized.
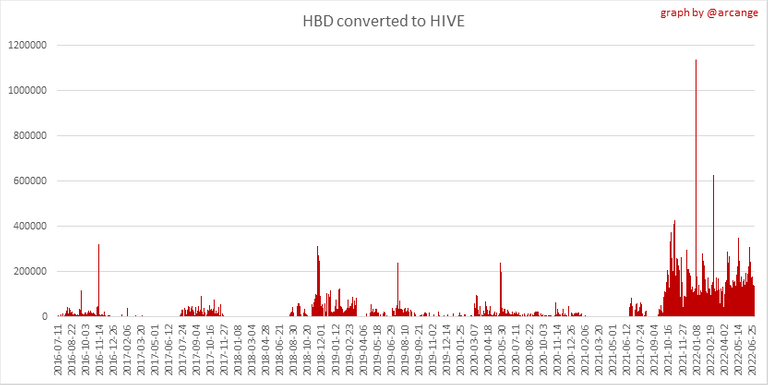 | 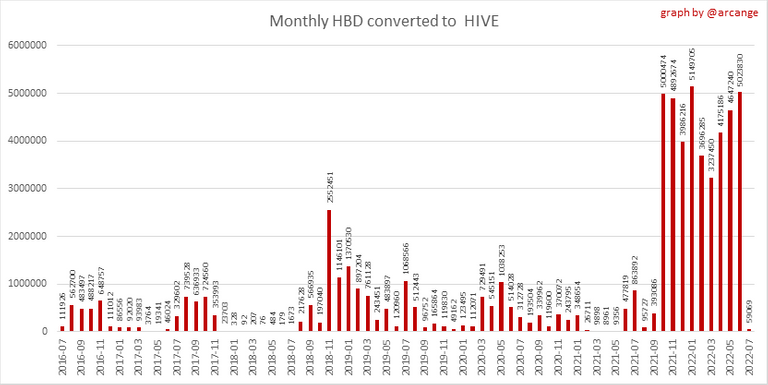 |
These graphs show the number of HBD burned, each day and each month, following requests to convert HBD to HIVE.
6. Powerup and Powerdown
| Date | Account | Amount |
|---|---|---|
| 2022-06-30 04:53:00 | @birdwatcher | 108,226.515 HIVE |
| 2022-06-30 09:30:39 | @unpopular | 66,288.091 HIVE |
| 2022-06-30 06:10:09 | @coinomite | 7,280.509 HIVE |
| 2022-06-30 03:01:42 | @leofinance | 5,516.057 HIVE |
| 2022-06-30 08:04:24 | @barge | 3,900.165 HIVE |
| 2022-06-30 04:45:45 | @iptrucs | 2,985.222 HIVE |
| 2022-06-30 02:27:18 | @lisfabian | 2,265.219 HIVE |
| 2022-06-30 03:01:21 | @khaleelkazi | 2,148.878 HIVE |
| 2022-06-30 06:32:39 | @monaenzio | 1,849.284 HIVE |
| 2022-06-30 06:34:12 | @monaenzio | 1,844.283 HIVE |
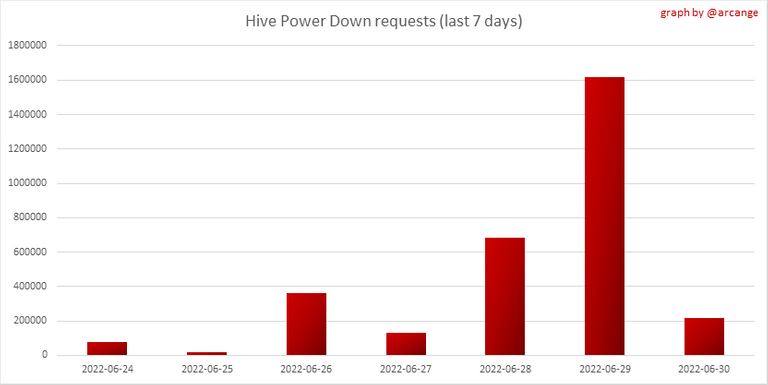
This graph and table show the amount of powerdown initiated over the last 7 days, and the largest initiated on this day.
| Account | Powerup | Account | Powerdown |
|---|---|---|---|
| @sepracore | 20,808.448 HIVE | @hbdstabilizer | 15,351.433 HIVE |
| @investing-dude | 6,599.453 HIVE | @curangel | 5,125.412 HIVE |
| @kiemurainen | 1,245.756 HIVE | @rocky1 | 4,605.967 HIVE |
| @drag33 | 1,000.000 HIVE | @itchyfeetdonica | 1,627.872 HIVE |
| @s101 | 643.276 HIVE | @aggroed | 1,539.336 HIVE |
| @buynano | 500.000 HIVE | @actifit | 1,403.972 HIVE |
| @superlotto | 350.827 HIVE | @tunnelmotions | 1,142.418 HIVE |
| @inpursuit | 191.790 HIVE | @solarwarrior | 1,000.567 HIVE |
| @pursuant | 191.710 HIVE | @ssjsasha | 971.070 HIVE |
| @dazed-wanderer | 190.334 HIVE | @conformity | 905.432 HIVE |
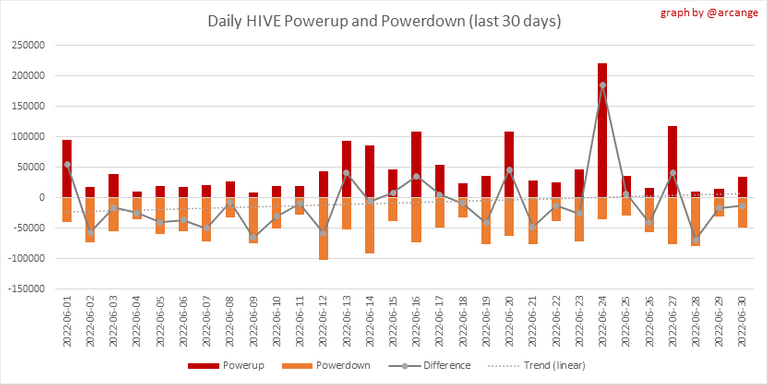
This graph shows the daily HIVE power-up, power-down, and the resulting variation over the last 30 days. The table shows the topmost power-ups and power-downs of the day.
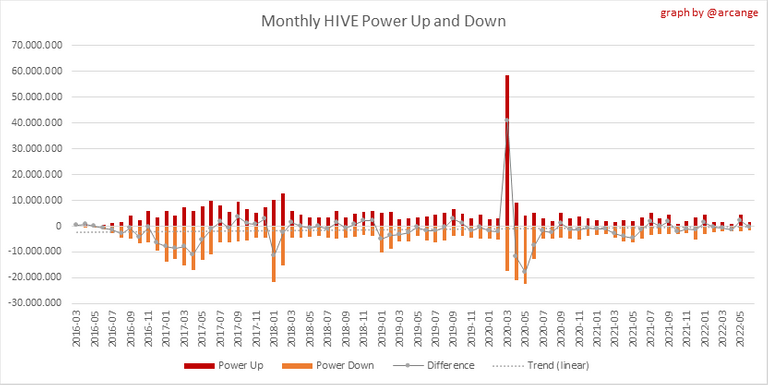
This graph shows the monthly HIVE power-up, power-down and the resulting variation.
Values for the last 3 months
| Period | Powerup | Powerdown | Difference |
|---|---|---|---|
| 2022-06 | 1,444,478.000 | 1,698,001.000 | -253,523.000 |
| 2022-05 | 4,321,244.000 | 2,069,335.000 | 2,251,909.000 |
| 2022-04 | 828,563.000 | 2,116,994.000 | -1,288,431.000 |
7. Transfers
These graphs show the volume (in USD) of HIVE and HBD transferred between accounts.
8. Exchanges
 | 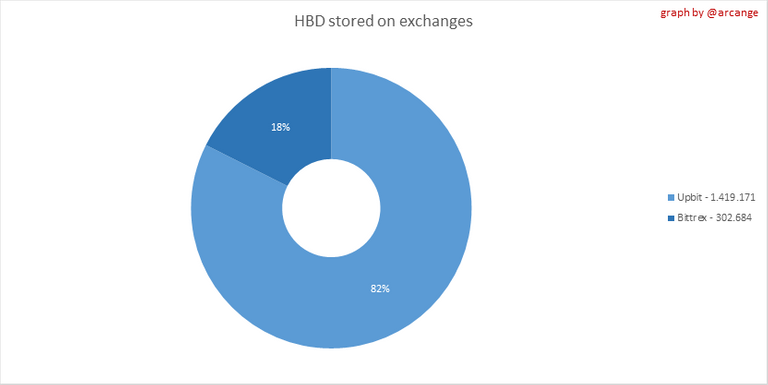 |
These graphs show the amount and distribution of HIVE and HBD stored on the exchanges where they are listed.
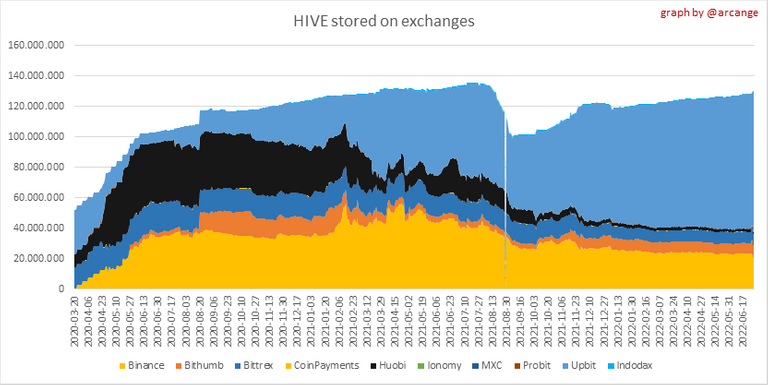 | 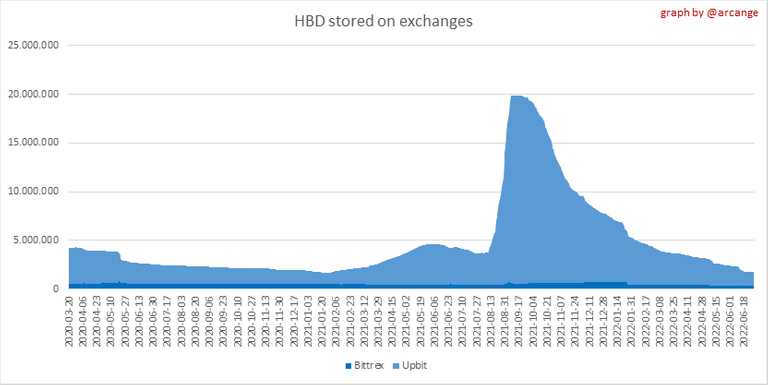 |
These graphs show the daily evolution of HIVE and HBD stored on the exchanges where they are listed.
I hope you find those stats useful. If you would like to see additional stats, feel free to drop me a comment. Your feedback is than welcome.
Thanks for reading.
Check out my apps and services


Congratulations @arcange! You received a personal badge!
Participate in the next Power Up Day and try to power-up more HIVE to get a bigger Power-Bee.
May the Hive Power be with you!
You can view your badges on your board and compare yourself to others in the Ranking
Check out the last post from @hivebuzz:
@pixresteemer(4/10) gave you LUV. H-E tools | discord | community | <><
HiveBuzz.me NFT for Peace
Read how this all have started with Toruk
Posted Using LeoFinance Beta