
Welcome to the daily financial report about the Hive blockchain.
All the information presented in this report is based on the data collected from the blockchain until 2022-11-24 midnight UTC. This report aims to provide you with a clear view of what is happening on the Hive blockchain.
 Este post está traducido al español - aquí
 Dieser Beitrag ist ins Deutsche übersetzt - hier
 Une version en français de ce post est disponible - ici
1. Price
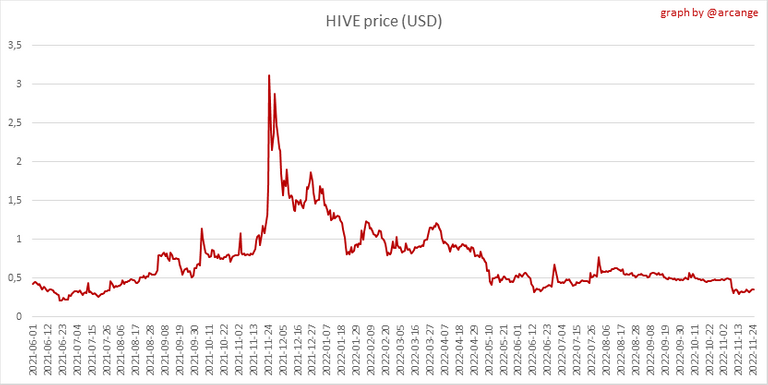 |  |
These graphs show the evolution of prices in USD for HIVE and HBD.
2. Supply
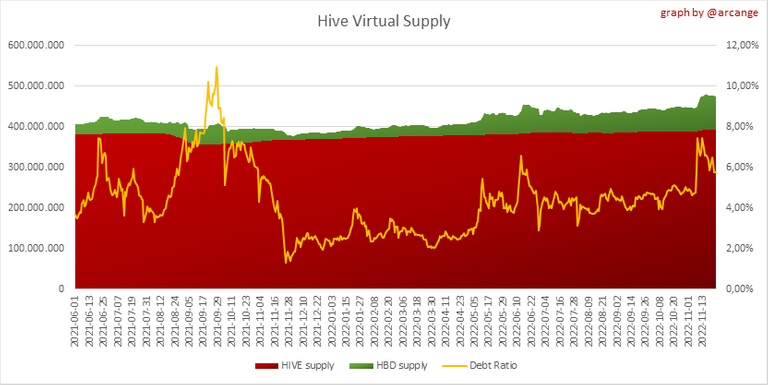
This graph shows the evolution of HIVE virtual Supply. The virtual supply is the sum of HIVE supply (liquid and staked HIVE) and HBD supply (converted into HIVE).
The graph also displays the debt ratio (HBD supply / HIVE virtual supply). Keep in mind that since hardfork 24 funds in the treasury (@hive.fund HBD balance) don't count towards the HBD debt ratio.
 | 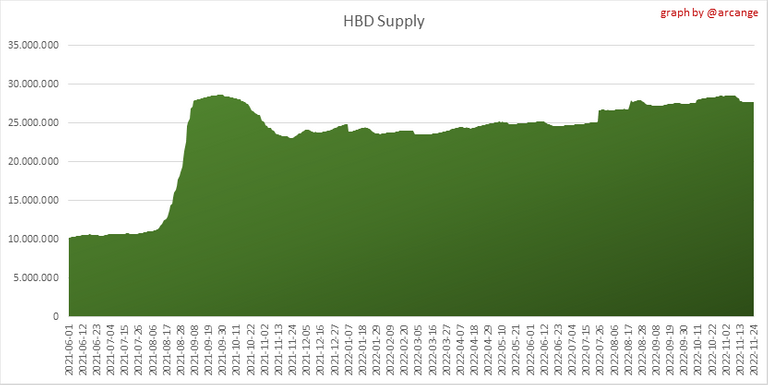 |
These graphs show the evolution of the HIVE Supply (both liquid and staked) and the HBD supply.
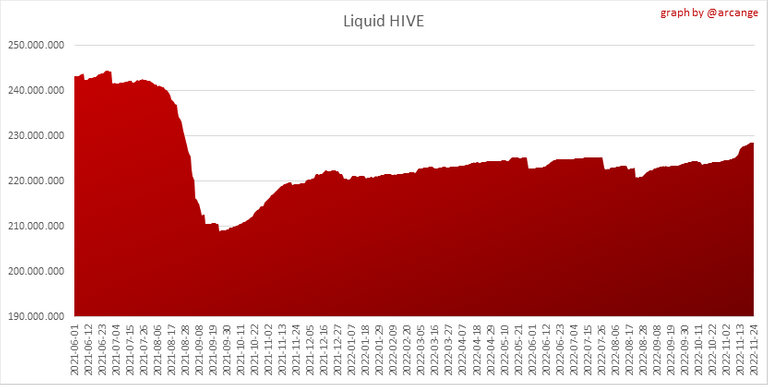 | 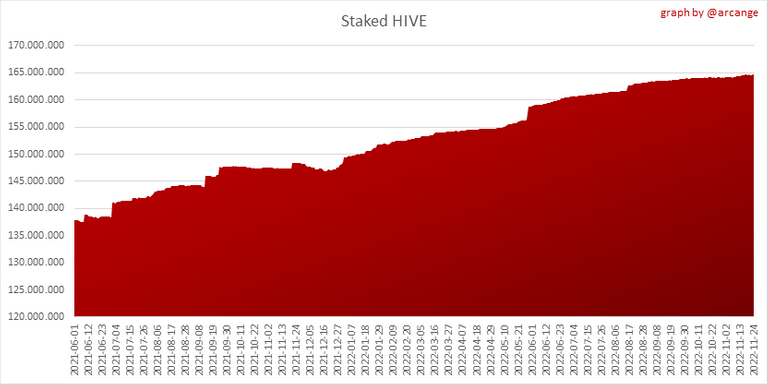 |
These charts show the evolution of the liquid HIVE and the staked HIVE (Hive Power).
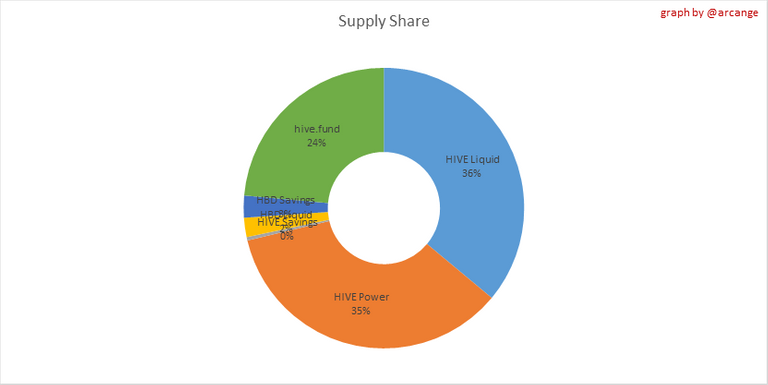
This graph shows the overall Hive tokens distribution.
3. HBD Savings
| Account | Deposit | Account | Withdrawal |
|---|---|---|---|
| @lazy-panda | 39,736.296 HBD | @poshtoken | 1,880.626 HBD |
| @valdiva | 985.062 HBD | @dagger212 | 1,000.000 HBD |
| @nemo.bank | 325.852 HBD | @joscha | 680.915 HBD |
| @hiveauth | 324.984 HBD | @xgerard | 200.000 HBD |
| @klye | 319.375 HBD | @roadtrip.prepper | 116.371 HBD |
| @wearelegion | 211.889 HBD | @cliffblank | 100.000 HBD |
| @keigrerii | 198.414 HBD | @drhueso | 78.000 HBD |
| @hivechain.app | 189.984 HBD | @kronias | 66.629 HBD |
| @drnoobpro | 166.133 HBD | @pardostories | 60.000 HBD |
| @soushi888 | 155.787 HBD | @carolinacardoza | 31.082 HBD |
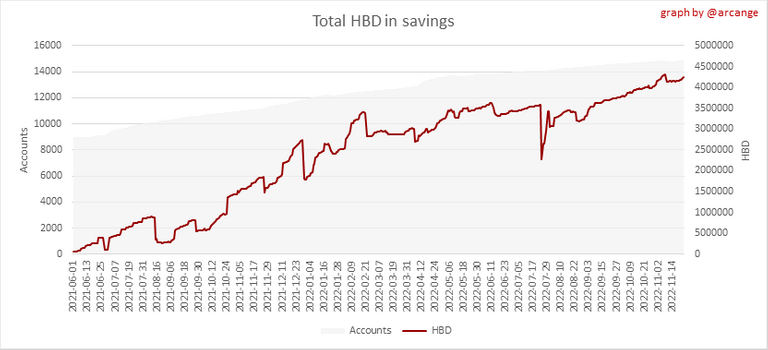
This graph shows how much and how many accounts store HBD in savings. The table below shows the topmost HBD deposits and withdrawals of the day.
Note: As of 2021-06-30 (HF25) interest is only paid for HBD which are stored in savings.
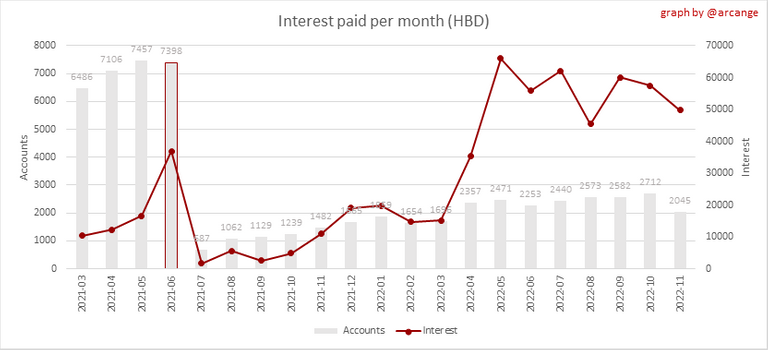
This chart shows the amount of interest paid each month for holding HBD and how many accounts received such interest.
4. Balances
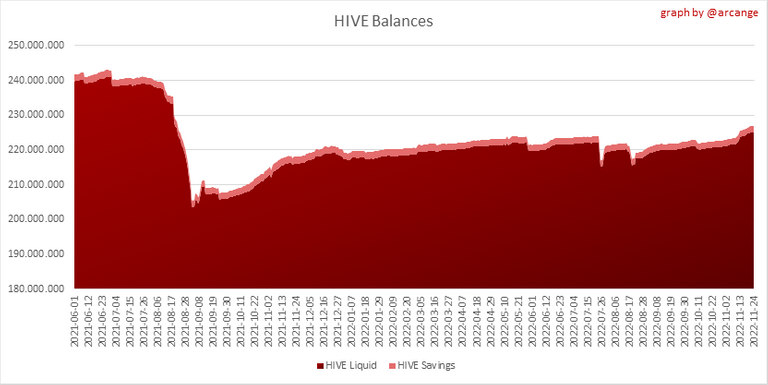
This graph shows the number of HIVE, both liquid and in savings, held by all accounts.
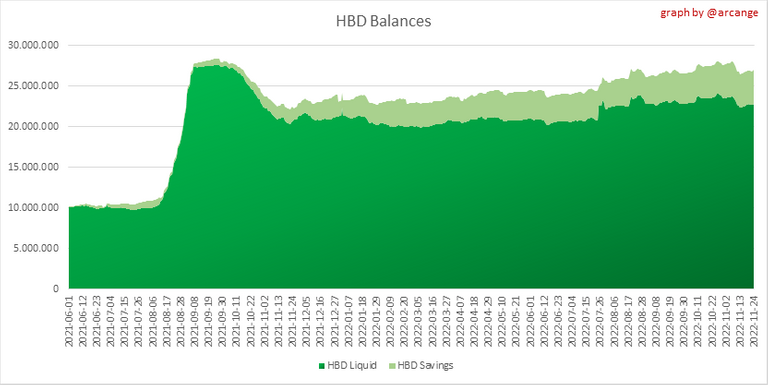
This graph shows the number of HBD, both liquid and in savings, held by all accounts.
5. Conversions
Note: As a reminder, conversion requests are only finalized after 3 days. It is only then that it is known exactly how many HIVE were burned in return for the HBD received at the time of the conversion request.
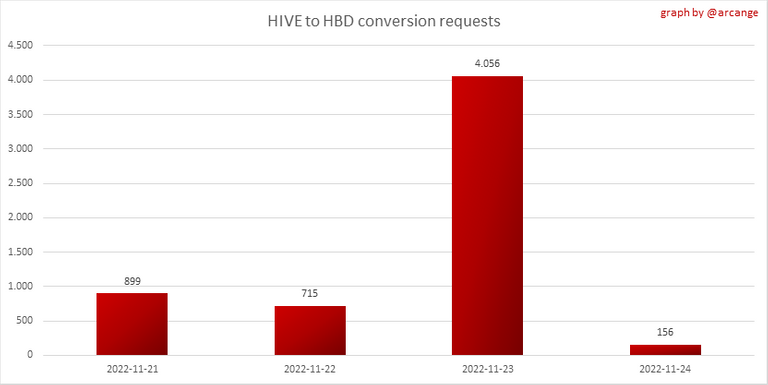
This graph shows the number of HIVE collateralized due to requests to convert HIVE to HBD over the past few days.
 |  |
These graphs show the number of HIVE effectively used by the conversion process (HIVE converted and 5% HIVE fee which is burned) each day and month when requests to convert HIVE to HBD have been finalized.
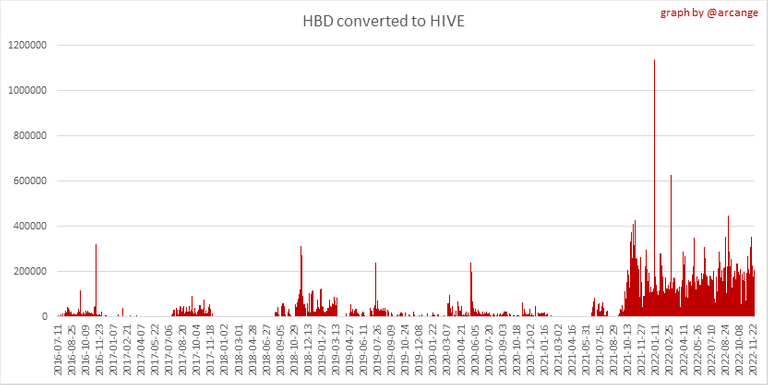 | 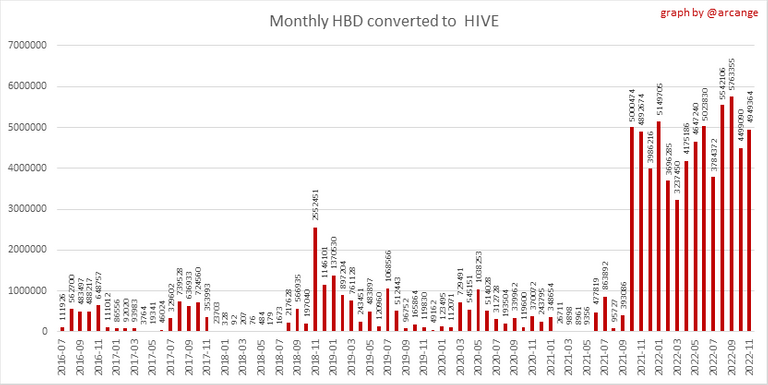 |
These graphs show the number of HBD burned, each day and each month, following requests to convert HBD to HIVE.
6. Powerup and Powerdown
| Date | Account | Amount |
|---|---|---|
| 2022-11-24 03:29:12 | @haejin | 6,674.548 HIVE |
| 2022-11-24 02:49:18 | @actioncats | 4,520.191 HIVE |
| 2022-11-24 09:06:45 | @macchiata | 4,008.864 HIVE |
| 2022-11-24 03:46:03 | @gabygonz | 1,531.123 HIVE |
| 2022-11-24 08:47:03 | @jasonmunapasee | 1,375.187 HIVE |
| 2022-11-24 11:49:51 | @samostically | 1,002.713 HIVE |
| 2022-11-24 09:10:12 | @artsyjose | 893.019 HIVE |
| 2022-11-24 09:38:00 | @deltasteem | 774.726 HIVE |
| 2022-11-24 05:36:51 | @skatehive | 678.022 HIVE |
| 2022-11-24 12:28:33 | @mayifiestas | 659.273 HIVE |
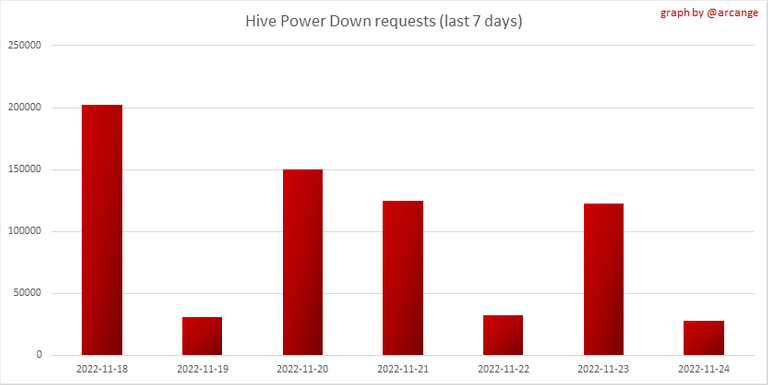
This graph and table show the amount of powerdown initiated over the last 7 days, and the largest initiated on this day.

| Account | Powerup | Account | Powerdown |
|---|---|---|---|
| @rofrogyptio | 12,950.000 HIVE | @hbdstabilizer | 21,197.377 HIVE |
| @god0 | 10,000.000 HIVE | @waivio.acc | 12,202.889 HIVE |
| @someeoracle | 5,000.000 HIVE | @gcalex | 7,056.470 HIVE |
| @carcio84 | 2,695.712 HIVE | @hivelot | 5,084.009 HIVE |
| @ace108 | 888.000 HIVE | @rocky1 | 4,680.489 HIVE |
| @slothbuzz | 500.000 HIVE | @unpopular | 3,805.462 HIVE |
| @ph1102 | 358.313 HIVE | @deanliu | 2,502.897 HIVE |
| @peter.goki | 206.724 HIVE | @v01dch41n | 1,480.444 HIVE |
| @dond | 200.000 HIVE | @postpromoter | 1,003.357 HIVE |
| @eddie-earner | 193.791 HIVE | @brotherhood | 975.049 HIVE |
This graph shows the daily HIVE power-up, power-down, and the resulting variation over the last 30 days. The table shows the topmost power-ups and power-downs of the day.
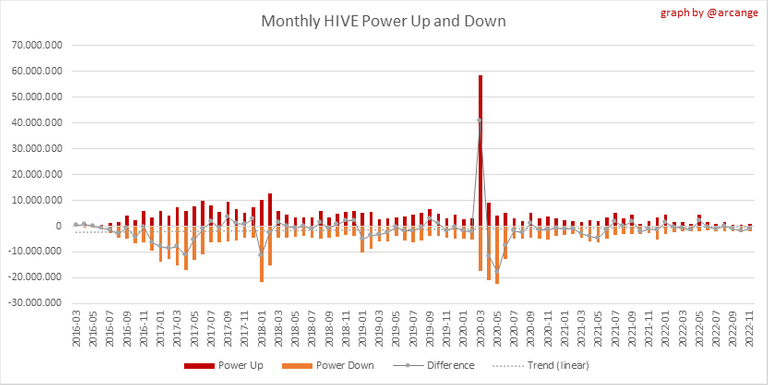
This graph shows the monthly HIVE power-up, power-down and the resulting variation.
Values for the last 3 months
| Period | Powerup | Powerdown | Difference |
|---|---|---|---|
| 2022-11 | 989,265.000 | 1,885,567.000 | -896,302.000 |
| 2022-10 | 606,941.000 | 2,422,080.000 | -1,815,139.000 |
| 2022-09 | 677,489.000 | 1,911,436.000 | -1,233,947.000 |
7. Transfers
These graphs show the volume (in USD) of HIVE and HBD transferred between accounts.
8. Exchanges
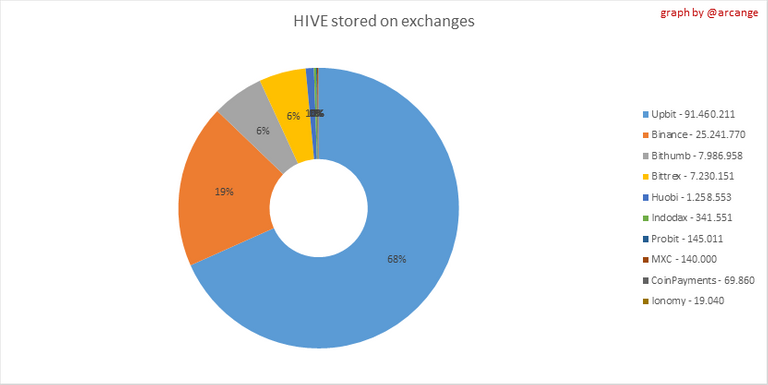 | 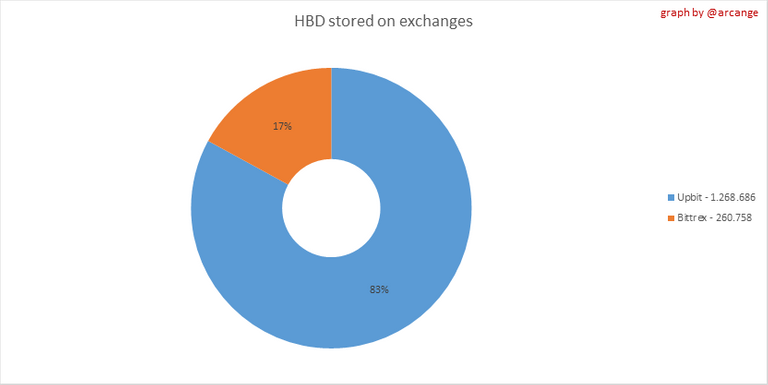 |
These graphs show the amount and distribution of HIVE and HBD stored on the exchanges where they are listed.
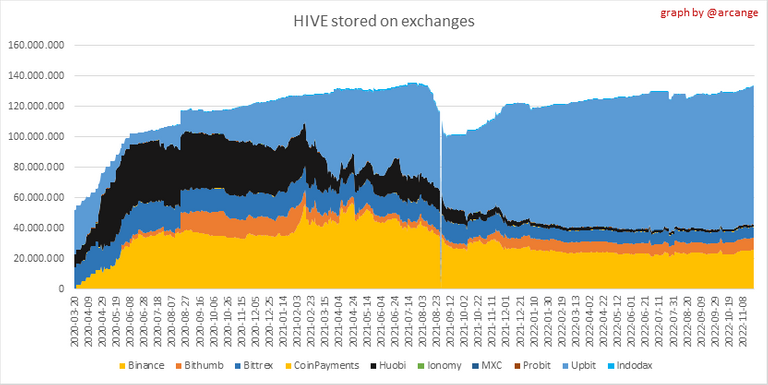 | 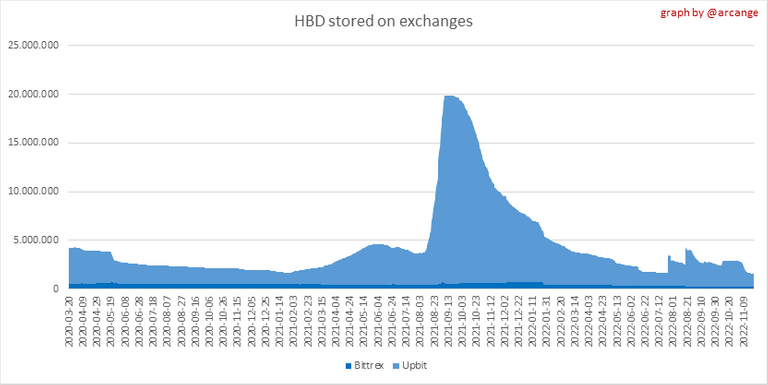 |
These graphs show the daily evolution of HIVE and HBD stored on the exchanges where they are listed.
I hope you find those stats useful. If you would like to see additional stats, feel free to drop me a comment. Your feedback is than welcome.
Thanks for reading.
Check out my apps and services


I gifted $PIZZA slices here:
@pixresteemer(2/5) tipped @arcange (x1)
Please vote for pizza.witness!
The value of the HIVE coin has dropped a lot but it has done what other coins have done. Instead, I am happy to see that HBD in savings are increasing
Click on the badge to view your board. Click [here](https://hivebuzz.me/rankingWC) to check your ranking.
Thank you to our sponsors. Please consider supporting them.
Check out the last post from @hivebuzz:
Some awesome charts and info there!
SlothBuzz is indeed powering up! Especially now our Witness Node has gone live! (Any votes are much appreciated) 2 Months into our Hive journey, we're glad to be making waves!