Welcome to my Hive vs Steem Stats Report for Saturday, February 6, 2021. All data is collected directly from the Steem and Hive blockchains and is based on UTC time.
1. Posts, including comments
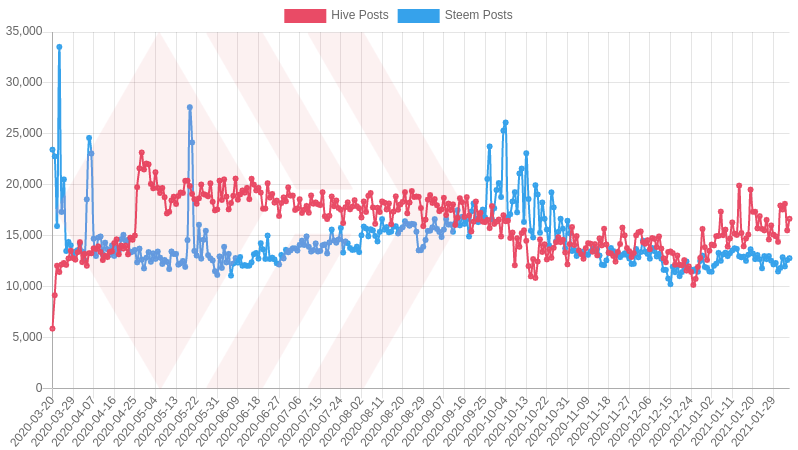
| Date | Hive Posts | Steem Posts |
|---|---|---|
| 2021-02-05 | 16,654 | 12,786 |
| 2021-02-04 | 15,516 | 12,598 |
| 2021-02-03 | 18,126 | 11,977 |
| 2021-02-02 | 17,569 | 12,878 |
| 2021-02-01 | 17,956 | 11,827 |
| 2021-01-31 | 14,388 | 11,477 |
| 2021-01-30 | 14,936 | 12,314 |
| 2021-01-29 | 15,096 | 12,173 |

2. Posts, excluding comments
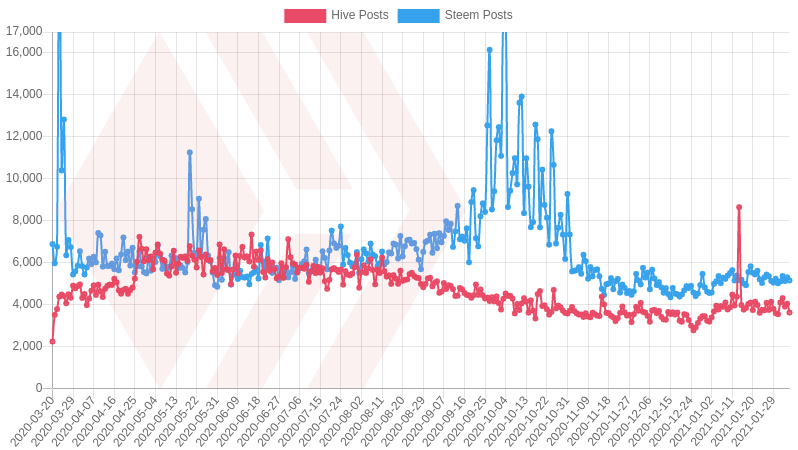
| Date | Hive Posts | Steem Posts |
|---|---|---|
| 2021-02-05 | 3,616 | 5,150 |
| 2021-02-04 | 4,036 | 5,298 |
| 2021-02-03 | 3,900 | 5,118 |
| 2021-02-02 | 4,305 | 5,359 |
| 2021-02-01 | 4,099 | 5,104 |
| 2021-01-31 | 3,535 | 5,014 |
| 2021-01-30 | 3,586 | 5,229 |
| 2021-01-29 | 3,793 | 5,044 |
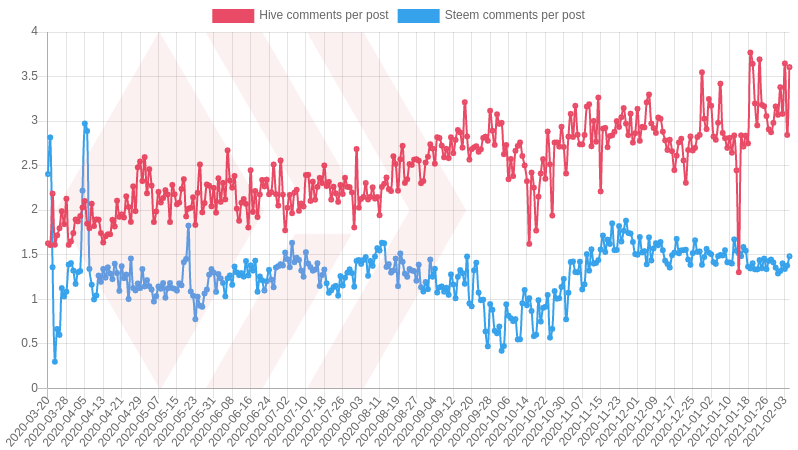
3. Average number of comments per post
4. Daily number of votes
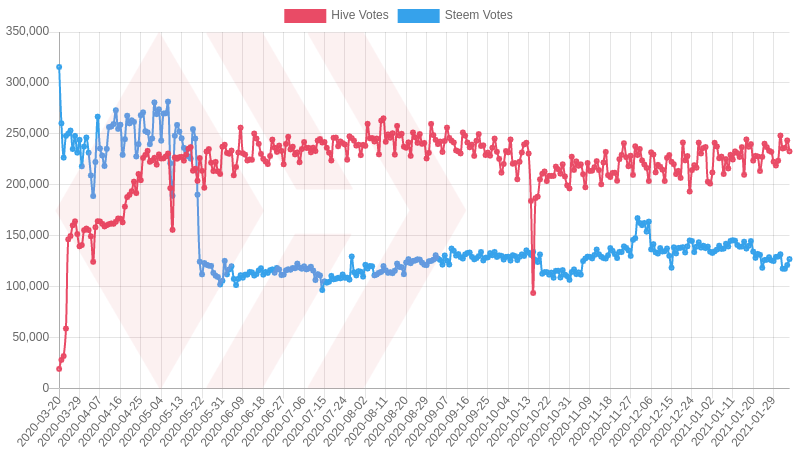
| Date | Hive Votes | Steem Votes |
|---|---|---|
| 2021-02-05 | 232,787 | 126,954 |
| 2021-02-04 | 243,519 | 121,144 |
| 2021-02-03 | 236,235 | 117,436 |
| 2021-02-02 | 235,601 | 117,532 |
| 2021-02-01 | 248,259 | 131,689 |
| 2021-01-31 | 223,585 | 129,467 |
| 2021-01-30 | 218,872 | 129,094 |
| 2021-01-29 | 222,555 | 125,031 |
5. Daily accounts transacting
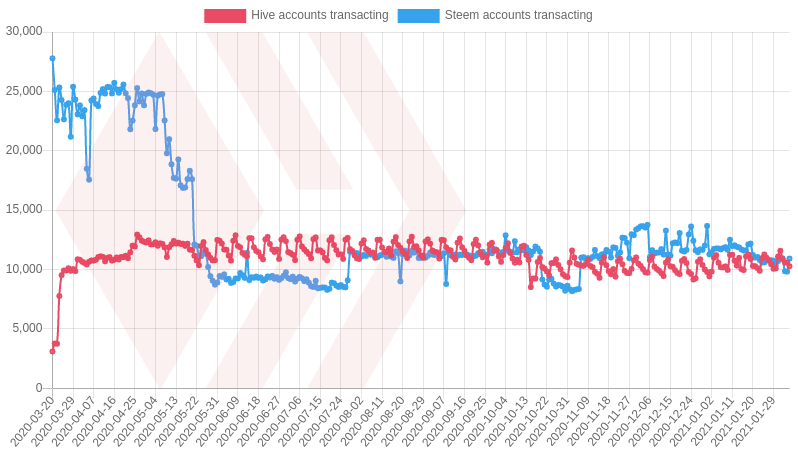
| Date | Hive accounts transacting | Steem accounts transacting |
|---|---|---|
| 2021-02-05 | 10,287 | 10,922 |
| 2021-02-04 | 10,582 | 9,825 |
| 2021-02-03 | 10,597 | 9,858 |
| 2021-02-02 | 10,866 | 10,945 |
| 2021-02-01 | 11,582 | 10,986 |
| 2021-01-31 | 11,100 | 10,712 |
| 2021-01-30 | 10,092 | 10,365 |
| 2021-01-29 | 10,068 | 10,746 |
6. Daily number of users that are posting
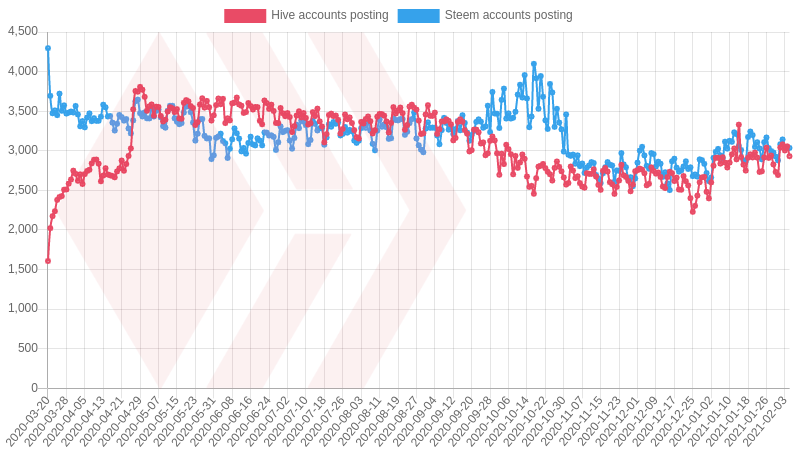
| Date | Hive accounts posting | Steem accounts posting |
|---|---|---|
| 2021-02-05 | 2,932 | 3,036 |
| 2021-02-04 | 3,056 | 3,034 |
| 2021-02-03 | 3,004 | 3,043 |
| 2021-02-02 | 3,081 | 3,143 |
| 2021-02-01 | 3,042 | 3,083 |
| 2021-01-31 | 2,694 | 2,879 |
| 2021-01-30 | 2,733 | 2,927 |
| 2021-01-29 | 2,828 | 2,979 |
7. New accounts created
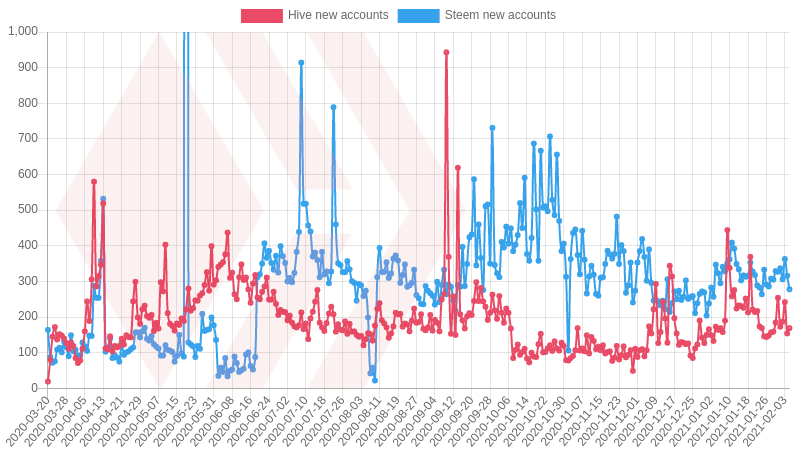
| Date | Hive new accounts | Steem new accounts |
|---|---|---|
| 2021-02-05 | 169 | 278 |
| 2021-02-04 | 154 | 316 |
| 2021-02-03 | 242 | 363 |
| 2021-02-02 | 187 | 306 |
| 2021-02-01 | 173 | 337 |
| 2021-01-31 | 254 | 327 |
| 2021-01-30 | 185 | 329 |
| 2021-01-29 | 159 | 305 |
8. Vesting / Power UP
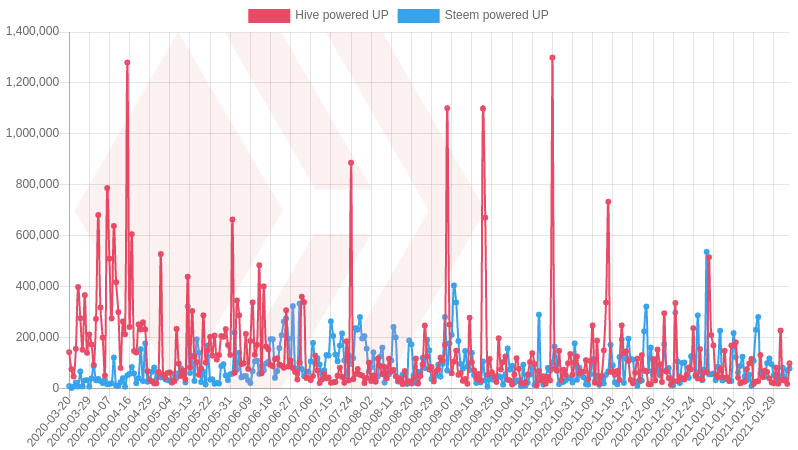
| Date | Hive powered UP | Steem powered UP |
|---|---|---|
| 2021-02-05 | 98,422 | 77,913 |
| 2021-02-04 | 17,459 | 71,085 |
| 2021-02-03 | 33,516 | 29,616 |
| 2021-02-02 | 32,322 | 80,878 |
| 2021-02-01 | 226,918 | 44,144 |
| 2021-01-31 | 18,105 | 26,682 |
| 2021-01-30 | 81,366 | 41,683 |
| 2021-01-29 | 20,243 | 51,673 |
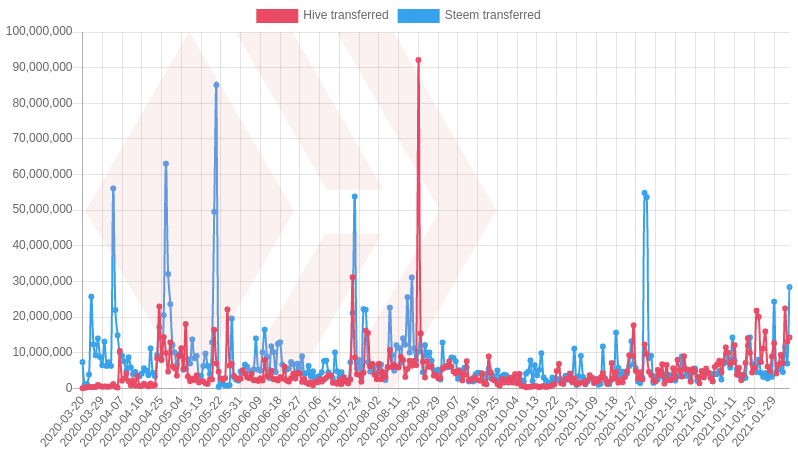
9. HIVE & STEEM transferred
10. HIVE & STEEM Transfers to and from exchanges
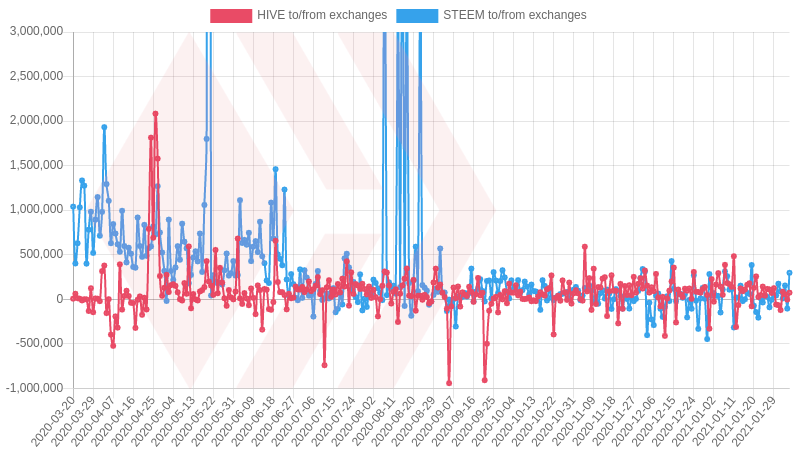
This chart shows the difference between deposits and withdrawals on all exchanges. Transfers from one exchange to another are excluded. A negative number means more withdrawn than deposited.
¯\___(ツ)____/¯ Follow me @penguinpablo for daily Hive statistics.
What is the point of publishing these comprising charts for a year now? We're not steem.
It's hard to think that this is not a shit posting and reward pool milking.
Posted Using LeoFinance Beta
I think there's still people interested in comparing the two platforms. We all want to know when Steem is going under, right? :)
I'm interested in it, see development between the old and the new.