
Mural in Ixelles, Belgium, thanking hospital staff during the COVID-19 crisis. The mural, unveiled in July 2020, faces the Etterbeek-Ixelles hospital.
Image credit: Miguel Discart CC 2.0 license

The impact of the COVID-19 pandemic has been devastating to many economies. Even so, it is difficult to discuss this challenge because people have wildly divergent views about mitigation strategies--and about the lethality of the disease. Tempers flare. Because of the subject's potential volatility, I'm not going to write about mitigation or lethality. I'll venture instead into the emotionally neutral universe of numbers.
Two charts are presented in this blog. Each chart has a list of countries. These were selected because they represent, more or less, Hiveans with whom I communicate on this platform. For each country, I present a set of statistics.
The Charts

Image credit: ArtTower on Pixabay.
It has been suggested that smoking increases the risk of contracting severe COVID-19. (For more information on these risks see: Economic Times: Panache, and The Lancet.)
Do numbers tell a COVID-19 story? Do they at least offer insight?
I began constructing my charts by looking at mortality rates (deaths from COVID-19 per 100,000). I first considered healthcare expenditures in each of the countries to see if there was a relationship between expenditure and COVID-19 mortality rate. I looked at absolute expenditure and relative expenditure (as a percent of GDP).
_in_2014.svg)
Image credit: Ali Zifan. Released into the public domain.
I wondered, is the COVID-19 mortality rate related to available healthcare resources? These (beds, physicians, etc.) are not necessarily proportional to expenditures. Check out the U. S. for example.
Included in Chart #1 is the Gini wealth coefficient for each country. Perhaps wealth inequality, I thought, might help to explain variable COVID-19 mortality rates.
As an illustration of how the charts are supposed to work, look at the statistics for Brazil. Brazil has a high mortality rate (77.9 per 10000 people), a low physician ratio (1.8 physicians per 1000 people) and a relatively low number of hospital beds (2.1 per thousand). Also, Brazil's Gini coefficient is high (.849 --indicates strongly unequal distribution of wealth), and its obesity rate is on the high side (22.1). However, the country spends a decent percent of GDP on healthcare (9.47 %) and the median age of the population is low (33.2-- the younger the population, the less vulnerable to the virus), as is the smoking rate. How do these numbers correlate with other countries that have a high mortality rate? Which factor, if any, contributes to the high mortality rate?
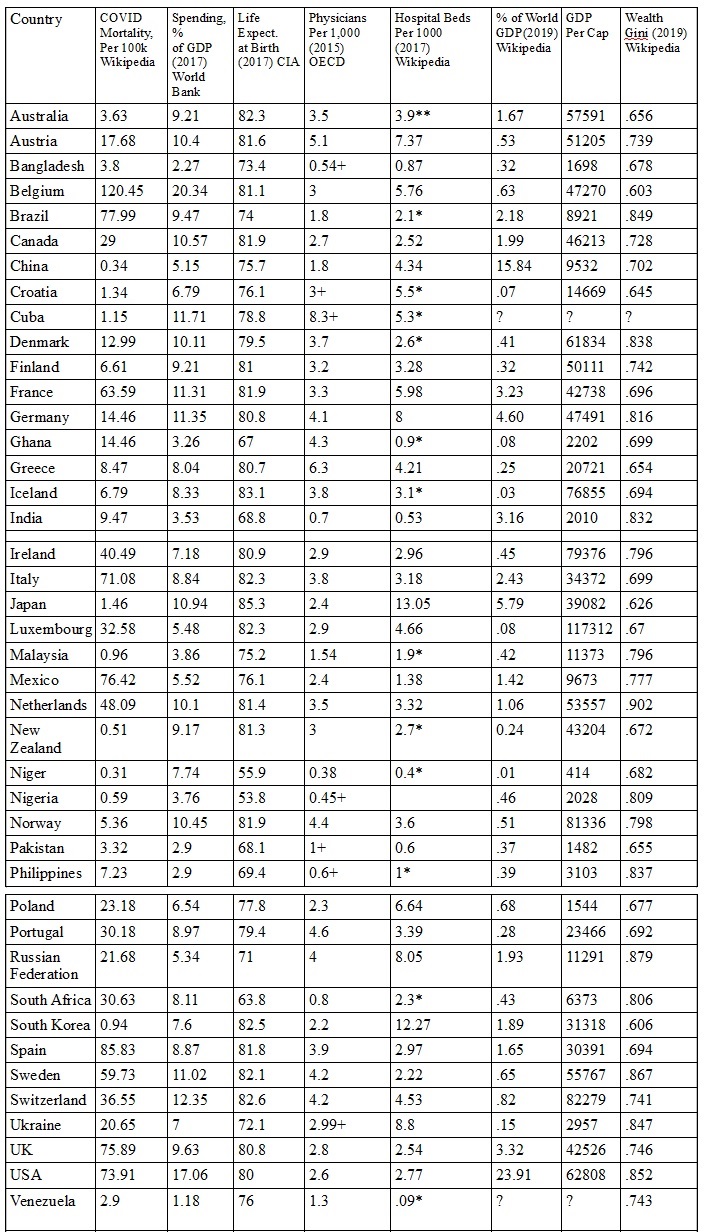
Image credit: agmoore, constructed from a variety of sources for my Hive/LeoFinance readers.
Some of the numbers listed in the charts were obtained from sources other than those cited in the chart. The additional sources will be given at the end of the blog. Some numbers (for Venezuela and Cuba) I couldn't find.
In order for chart #1 to have greater utility, I thought other factors (that might affect mortality rate) ought to be considered: median age, obesity rate, and smoking rate. Each of these--advanced age, obesity and smoking--has been associated with increased COVID-19 mortality.
I wondered, what if a country had a lot of healthcare resources, but a high obesity rate? Or an aging population? Or a population that smokes a lot? How would each of these factors skew the numbers?

Image credit: Ettarh R et al., in "Preventing Chronic Disease Journal" Public domain
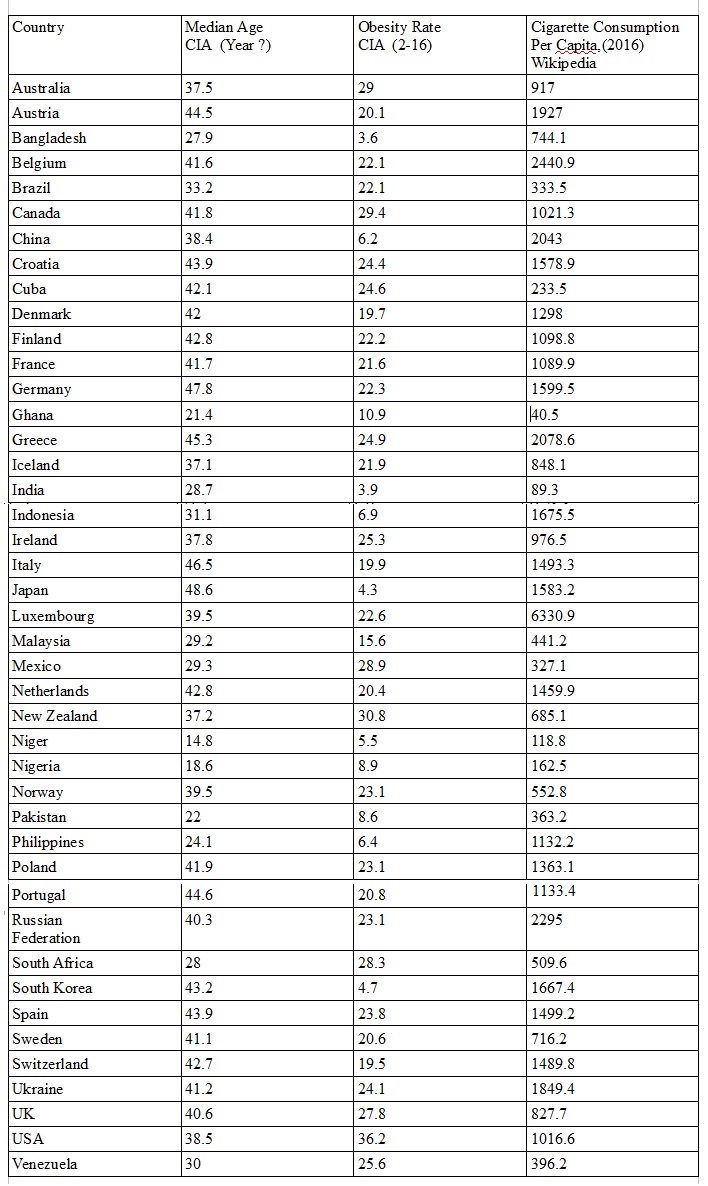
Image credit: agmoore, constructed from a variety of sources for my Hive/LeoFinance readers.
I'm not a statistician, nor am I a mathematician. Perhaps someone skilled in these areas might make something of the numbers. Countries with similar cultures, from similar geographic areas, should of course be considered together (in order to limit undefined variables).
There were some surprises for me as I collected data. Among these: the U. S. has a modest supply of physicians and hospital beds despite its enormous expenditure (17.6% of GDP) on healthcare, and, Luxembourg consumes a jaw-dropping 6330.9 cigarettes per capita.
Conclusion
Feel free to challenge the numbers. I have no way to evaluate them, but one has to start somewhere and these might offer an approximate truth.
Sources used besides those cited:
Kaiser Family Foundation
COVID Observer
KNOEMA
Trading Economics
Australian Institute of Health and Welfare

Posted Using LeoFinance Beta
so many aspects to be considered
!discovery 40
Yes, so many. I had to stop myself from adding columns--pollution, population density...etc,, etc. Maybe leading nowhere. But still, some of those stats were interesting.
Thank you very much for stopping by and supporting my blog.
This post was shared and voted inside the discord by the curators team of discovery-it
Join our community! hive-193212
Discovery-it is also a Witness, vote for us here
Delegate to us for passive income. Check our 80% fee-back Program
Thank you, @discover-it. Very heartening to get your support.
if you have free votes consider to vote our witness!!
I use @lemouth as proxy because I don't really know much about the witnesses. Though I would vote for you if I had the votes.
I understand, we hope that @lemouth thinks like you then!
I think the countries with low median age have other pressing issues along with the pandemic.
I wouldn't, for a moment, think their other issues before the virus suddenly disappeared.
Rather sobering charts to compile. Median age, body weight, physician ratio... No, the other issues will not disappear.