EN:
Hello again. We continue the graphic analysis from where we left off. I haven't published Bitcoin, Ethereum analysis for a while. I didn't have time to analyze because I traded more. In this post, we will examine BTC, ETH, HIVE and SPS charts. I will share the graphics that I follow with you as they are. All of the charts were analyzed in the daily time frame. But some drawings are weekly, four-hour, etc. may have been made in time.
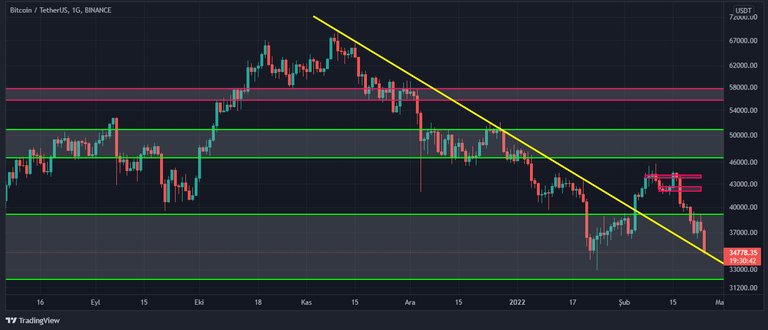
The first chart is from BTC/USDT. We are located in a large supply-demand region. If the price range is $39,000-$32,000 Uptrend, the above-drawn zones will act as resistance. If there is a downward trend, I will follow the $19,000 level that peaked in 2018.
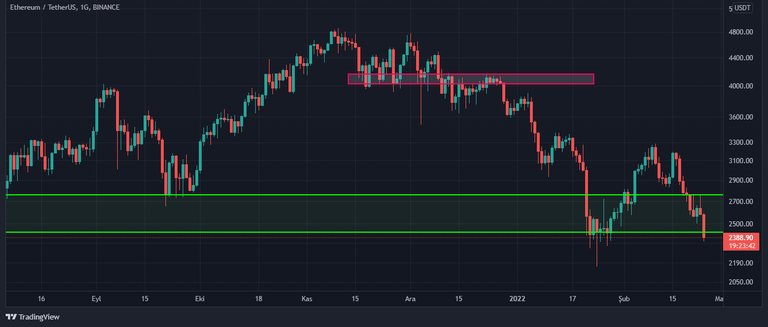
Our next chart is from the Ethereum screenshot. We are examining the ETH/USDT parity. It is located in the $2750-$2400 supply-demand zone. However, it was drooping when taking screenshots. If there is an upside break, our first target is the $4000 level. If the downward movement continues, I will follow the $1900-$1420 supply-demand area.
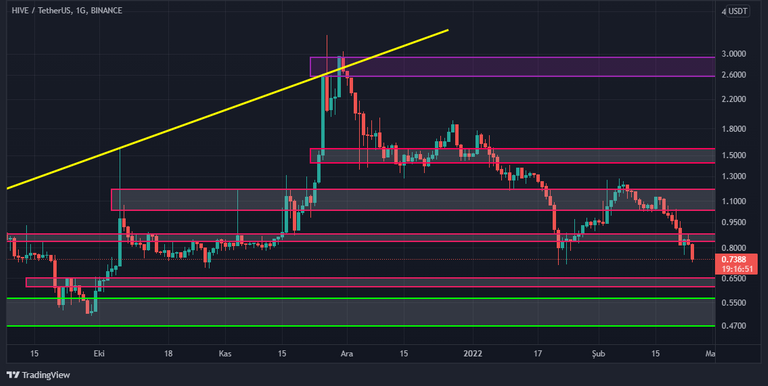
The next screenshot is taken from the Hive graph. Even though I am trading on HIVE/BUSD, I am still following the HIVE/USDT chart. There is a supply-demand zone around the $0.85 price level above. This level shows the price at which Hive Coin opened trading on the Binance exchange. Below is the $0.65-$0.60 supply-demand zone. There was a price drop up to these two zone ranges. The supply-demand regions I mentioned need to be followed closely.
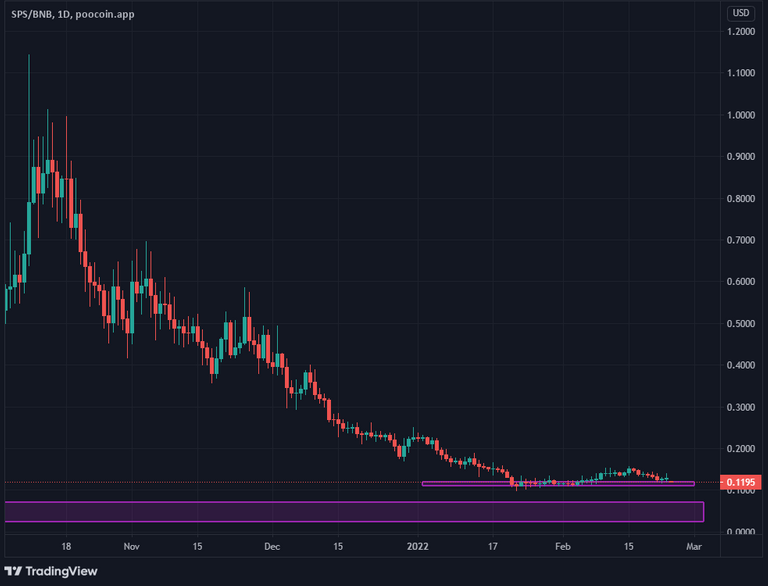
There is a bottom attempt at $0.11 price level. The $0.1 price is important to us. If there is a downward price move, there is a wide area up to $0.029. This price is the lowest transaction level in the BSC network of SPS Token. I hope there will be no sagging up to these levels.
I usually share my charts about cryptocurrencies listed on Binance and Houbi exchanges. I get data from these exchanges. If you are not a member of these exchanges, you can become a member by following the links below.
Binance: https://accounts.binance.com/en/register?ref=D2P1JVRK You get 10% commission discount.
Houbi: https://www.huobi.com/en-us/topic/double-reward/?invite_code=m9454223 You will get 10% commission discount.
I am not an investment advisor. For this reason, it will be more beneficial for you to see my graphic posts as an educational work. See you later.
TR:
Tekrar merhaba. Grafik analizlerine kaldığımız yerden devam ediyoruuz. Bir süredir Bitcoin, Ethereum analizi yayınlamadım. Daha fazla ticaret yaptığım için analiz yapmaya vakit bulamadım. Bu paylaşımda BTC, ETH, HIVE ve SPS grafiklerini inceleyeceğiz. Takip ettiğim grafikleri olduğu gibi sizlerle paylaşacağım. Grafiklerin tamamı günlük zaman diliminde incelendi. Ancak bazı çizimler haftalık, dört saatlik vb. zaman dilimlerinde yapılmış olabilir.
İlk grafik BTC/USDT paritesinden. Geniş bir arz-talep bölgesinde bulunuyoruz. Fiyat aralığı 39.000$-32.000$ Yükselme eğilimine girerse yukarıda çizilmiş bölgeler direnç görevi yapacak. Aşağıya bir yöneliş gerçekleşirse 2018 yılında zirve yapmış olan 19.000$ seviyesini takip edeceğim.
Sıradaki grafiğimiz Ethereum ekran görüntüsünden. ETH/USDT paritesini inceliyoruz. 2750$-2400$ arz-talep bölgesinde bulunuyor. Ancak ekran görüntüsü alırken aşağı sarkma söz konusuydu. Yukarı yönlü bir kırılım gerçekleşirse ilk hedefimiz 4000$ seviyesi. Aşağı yönlü hareket devam ederse 1900$-1420$ arz-talep bölgesini takip edeceğim.
Sıradaki ekran görüntüsü Hive grafiğinden alındı. HIVE/BUSD paritesinde ticaret yapmama rağmen hala HIVE/USDT grafiğini takip ediyorum. Yukarıda 0.85$ fiyat seviyesinin etrafında bir arz-talep bölgesi bulunuyor. Bu seviye Hive Coin'in Binance borsasında işleme açılış yaptığı fiyatı gösteriyor. Aşağıda ise 0.65$-0.60$ arz-talep bölgesi bulunuyor. Bu iki bölge aralığına kadar bir fiyat düşüşü gerçekleşti. Bahsettiğim arz-talep bölgelerinin iyi takip edilmesi gerekiyor.
0.11$ fiyat seviyesinde bir dip yapma çalışması var. 0.1$ fiyatı bizim için önemli. Aşağı yönlü bir fiyat hareketi gerçekleşirse 0.029$ fiyatına kadar bir geniş alan söz konusu. Bu fiyat, SPS Token'in BSC ağındaki en düşük işlem seviyesi. Umarım bu seviyelere kadar bir sarkma gerçekleşmez.
Genelde Binance ve Houbi borsalarında listelenen kripto para birimleriyle ilgili çizelgelerimi paylaşırım. Bu borsalardan veri alıyorum. Bu borsalara üye değilseniz aşağıdaki linkleri takip ederek üye olabilirsiniz.
Binance: https://accounts.binance.com/en/register?ref=D2P1JVRK %10 komisyon indirimi alırsınız.
Houbi: https://www.huobi.com/en-us/topic/double-reward/?invite_code=m9454223 %10 komisyon indirimi alacaksınız.
Ben bir yatırım danışmanı değilim. Bu nedenle grafik yazılarımı eğitici bir çalışma olarak görmeniz sizin için daha faydalı olacaktır. Sonra görüşürüz.