It's time again to look at the bitcoin
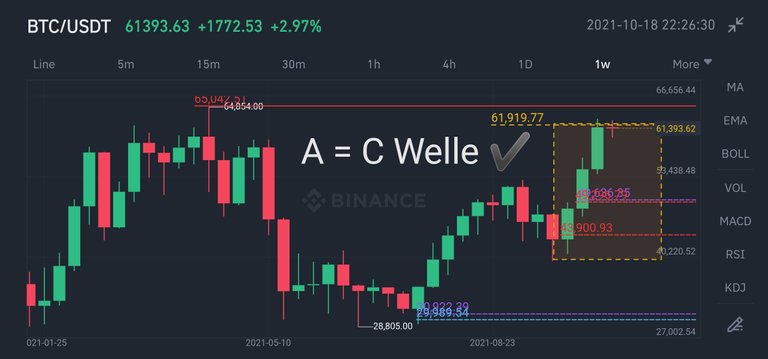
The first target on the upper side has now been reached, here I have defined a target in the last post. At the same time, the zone around the 62K is well contested, so now again well seen in the charts. Here, the first profits are now taken and the question is whether it remains.
The double power on two time units
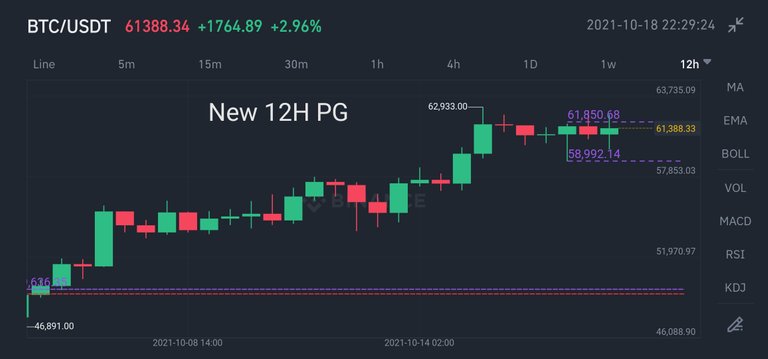
Bitcoin and and the other tokens are 24 hour markets and therefore some time units work better than others. Signals in bitcoin often occur on the 6 and 12 hour charts, these are a quarter and half of a trading day respectively. The combination of two different time units is one of the basics in active trading.
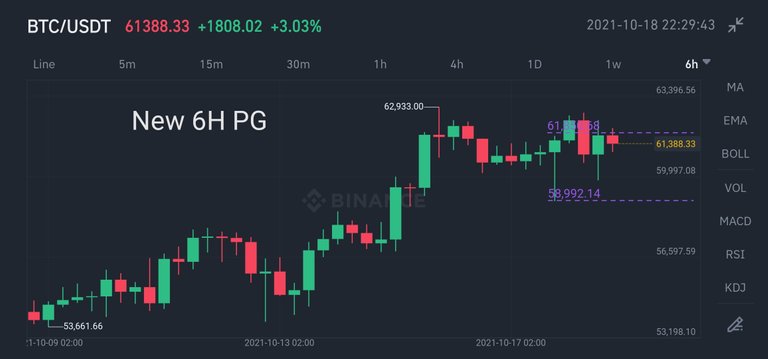
The new PGs on the 6 and 12 hour charts even have the same triggers and this is not seen too often. The situation is once again coming to a head and that is not unexpected. We are in front of important highs and there just starts with many the tingling in the finger.
Also, many hedges will be on the bottom, the danger increases just the closer you get to the high. No matter which direction is played now, the trigger points are in the market.
Translated with www.DeepL.com/Translator (free version)
Es ist mal wieder Zeit um auf den Bitcoin zu schauen
Das erste Ziel auf der Oberseite wurde jetzt erreicht, hier habe ich ja im letzten Post ein Ziel definiert. Gleichzeitig ist die Zone rund um die 62K gut umkämpfte, so auch jetzt wieder gut zu sehen in den Charts. Hier werden jetzt die ersten Gewinne genommen und die Frage ist ob es dabei bleibt.
Die doppelte Power auf zwei Zeiteinheiten
Bitcoin und und die anderen Token sind 24 Stunden Märkte und deshalb funktionieren einige Zeiteinheiten besser als andere. Signale im Bitcoin treten oft auf dem 6 und 12 Stundenchart auf, dies sind jeweils ein viertel und die Hälfte eines Handelstags. Die Kombination aus zwei unterschiedlichen Zeiteinheiten gehört zu den Basics beim aktiven Handel.
Die neuen PGs auf dem 6 und 12 Stundenchart besitzen sogar die gleichen Trigger und das sieht man auch nicht allzu oft. Die Lage spitzt sich mal wieder zu und das kommt ja auch nicht unerwartet. Wir befinden uns vor wichtigen Höchstständen und da fängt halt bei vielen das kribbeln im Finger an.
Auch werden auf der Unterseite viele Absicherungen liegen, die Gefahr steigt halt je näher man dem Hoch kommt. Egal welche Richtung jetzt gespielt wird, die Triggerpunkte sind im Markt.
Source/Quelle Charts: (Guidants/Godmode Trader) & JFD Broker & Binance
Für mehr Informationen rund ums Trading empfehle ich meinen
Discord Channel: https://discord.gg/j5A3CUq
Twitter: https://mobile.twitter.com/TraderOut
Risikohinweis:
Dieser Post stellt keine Anlageberatung oder sonstige Empfehlung dar.
Die dargestellten Analysen, Techniken und Methoden dienen ausschließlich Informationszwecken
und stellen weder eine individuelle Anlageempfehlung noch ein Angebot zum Kauf oder Verkauf
von Finanzinstrumenten dar, sondern spiegeln lediglich die Meinung des Referenten wider.
Eine Haftung ist ausgeschlossen.
Legal Disclaimer:
I am not a financial advisor
nor is any content in this article presented
as financial advice. Never invest more
than what you can afford to lose.
This post is my personal opinion,
do your own research before making any investment decisions.
If you make any trades after reading this post,
it is completely in your responsibility.
Posted Using LeoFinance Beta