Similar to Sports Betting tipsters, nearly all online Technical Analysts that post predictions don't keep them any kind of track record whatsoever. When they turn out to be right they usually shout it through the rooftops when they are were wrong it is never mentioned again. Unless you follow them for a longer time and do your own tracking, there is basically no way to know if they are actually any good. My aim over time is to become better and post predictions while keeping a close record on them.
These are the charts that stand out to me for upside potential vs BTC, I didn't actually make any trades and the main purpose is for me to actually learn. Blogging about it in that regard certainly helps.
This project is similar to Binance (BNB) and Crypto.com (CRO) as it is an European based Exchange that has their own coin (CHSB) which provides certain benefits like lower fees, earning rewards, voting rights,... Along with DeFi platforms it has been very hot as it's a relatively low cap coin and everyone is gambling on potential moonshots at the moment.
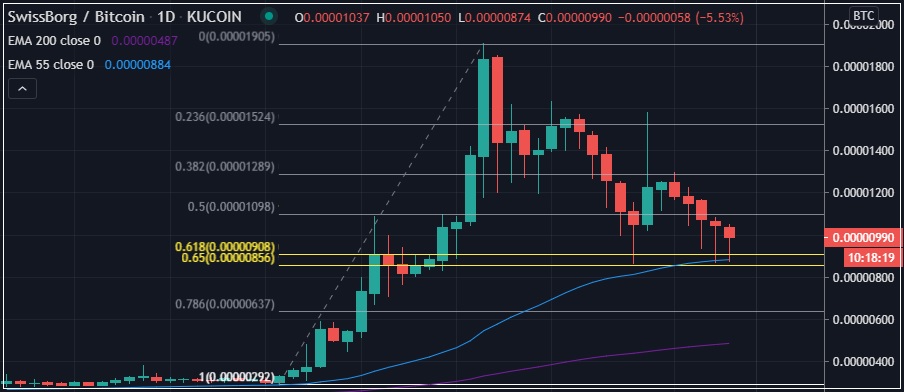
The chart Saw a huge jump in price around +500% in 2 weeks followed by a correction all the way to the golden pocked 0.618 Fibonacci range where it has seen some strong support with what looks like 3 bullish hammer candles with the latest coming at the 55-day moving average. With a market cap of 63 Million and 70%+ of tokens into circulation, it feels like it is ready to go higher again also since the Defi Hype seems to continue.
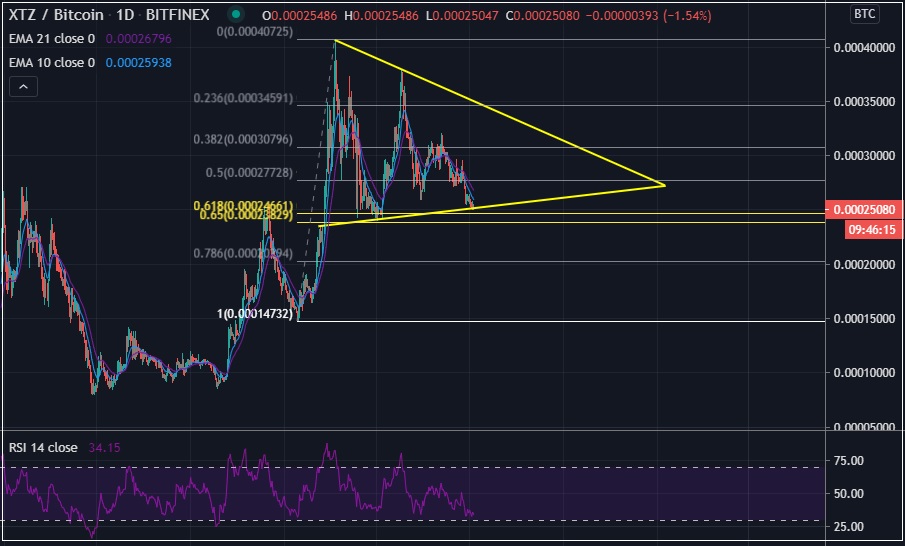
Tezos (XTZ) also seems to be hitting close to a support range based on the 0.618 Fibonacci retracements and looks overbought on the RSI. If it drops a bit more I might take a long position with a tight stop loss
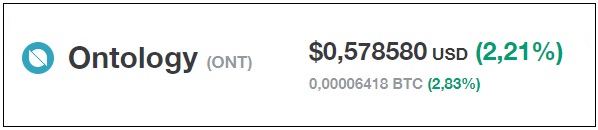

Ontology seems to be in a parallel upward moving channel just having hit the 3rd point of support. The next resistance line also fits with the previous support/resistance zone and the MACD is moving back to the positive on the daily chart. 9 days for +14% vs BTC in case it plays out this way.
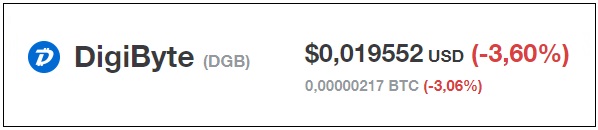

Digibyte seems to be in a symmetrical Triangle Patters with the range getting tighter making it so that there should be a move up or down within the next 2 weeks. The volume aside from the day the Binance listing was announced also has been decreasing. The price seems to be finding support above the 10 and 21-day moving averages with the 10-day being above which is a bullish indication.
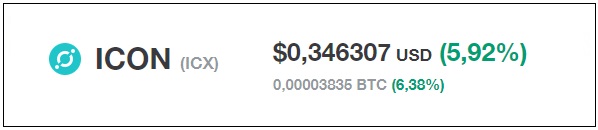
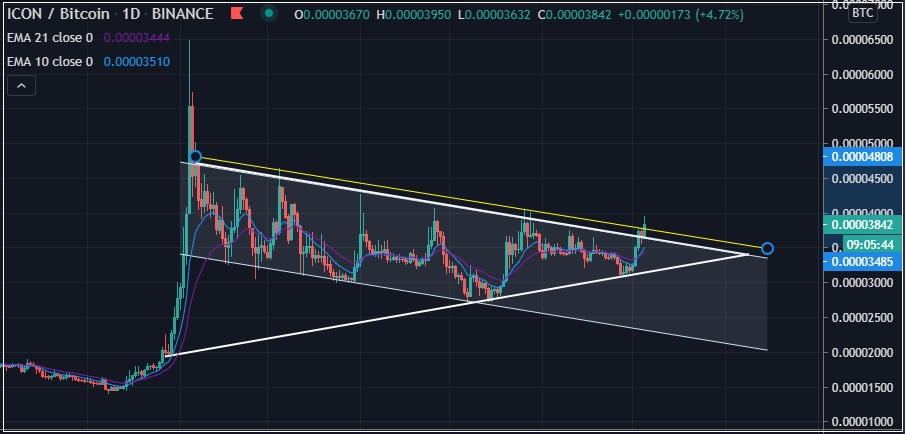
Icon (ICX) is currently looking to break out of a symmetrical triangle / downward-moving parallel channel, the main thing that is missing right now is volume an conviction. Looking at how fast and high the previous move up went, this one could have a lot of potential once it gets going. On the flip side, there is a 40% move down potential if it would break down and hit the support of the downward channel. Yesterday, the 55 Moving average formed a golden cross with the 200 moving average on the 4-hour chart which tends to be bullish.
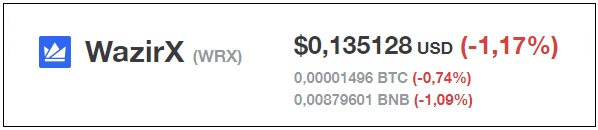
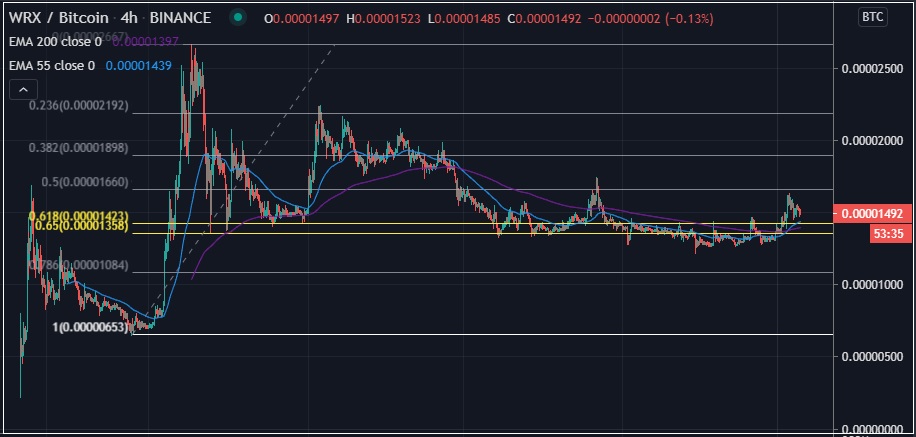
WazirX is the fastest growing Crypto Exchange based in India, it had a big move up and found support on the 0.618 Fibonacci retracement golden pocket zone. Yesterday, the 55 moving average and the 200 moving average on the 4-hour chart formed a golden crossover.
Technical Analysis Lessons I learned So Far
Technical Analysis #01 | Basics
Technical Analysis #02 | Trends
Technical Analysis #03 | Bearish Patterns
Technical Analysis #04 | Bullish Patterns
Technical Analysis #05 | Symmetrical Triangles
Technical Analysis #06 | Volume Indicator
Technical Analysis #07 | Moving Averages
Technical Analysis #08 | MACD
Technical Analysis #09 | RSI
Technical Analysis #10 | Fibonacci Retracements
Technical Analysis #11 | Candlestick Patterns
Free Software I use for Charts Tradingview | The Platform I use for Trading Binance |
|---|
 |
 |
Posted Using LeoFinance