My dCity Dashboard
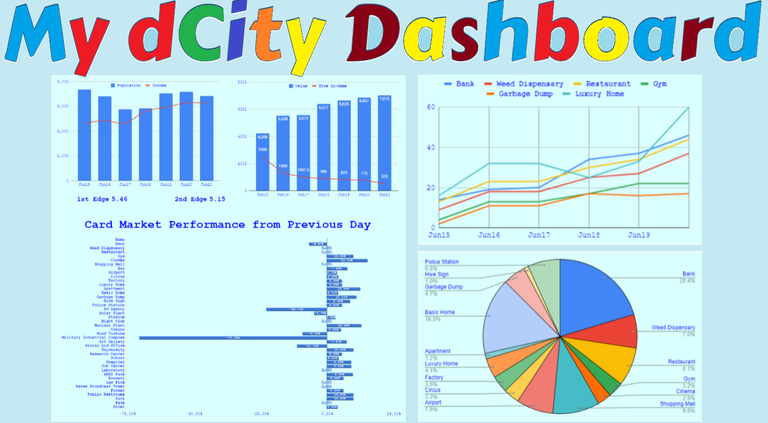
Yesterday's Dashboard
*Expandable View - 6/22/2020
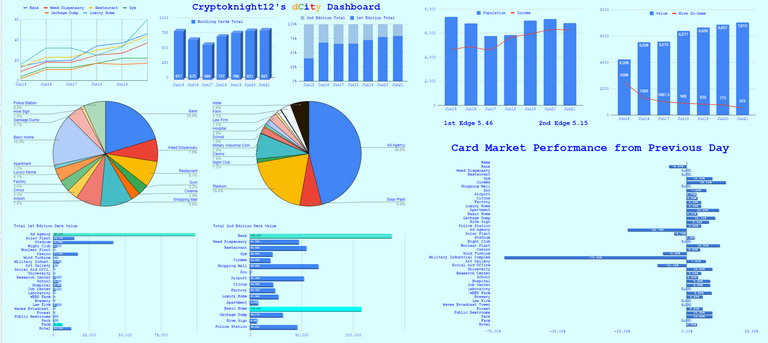
Today's Dashboard
*Expandable View - 6/23/2020
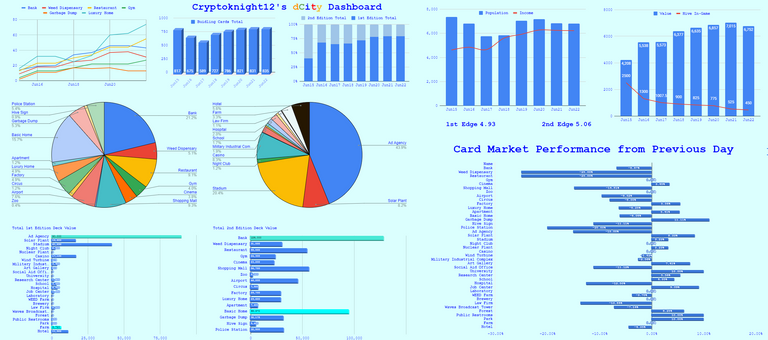
My Performance Summary
Players that were watching yesterday's market saw many low priced 1st edition cards, this was likely due to a recent surge of new sellers dumping the market. As a result, many players experienced a big decrease in their deck value, especially those holding a larger share of 1st edition cards in their city like me!
Overall, I personally banked about 75 Hive but sacrificed both population and SIM income. My deck value went way down too by about 10% because of the low price cards selling currently on the market, which is all factored an updated in my dashboard above.
Hopefully the market picks back up today after the payout here in a couple hours!
My Current dCity Strategy
My current strategy is to start focusing more on re-balance and become more of a passive player overtime while focusing more on dCity community engagement. Personally, I think dCity is a great way to not just have an awesome gaming experience, but leverage gaming experiences with other players to enhance my overall Hive presence!
Since I've started playing dCity, I've actually been taking quite a bit out to increase my Hive Power. My goal currently is to get my HP to around 10k, this way I am much more noticeable and compound my current Hive reputation.
Explanation of Metrics in My Dashboard
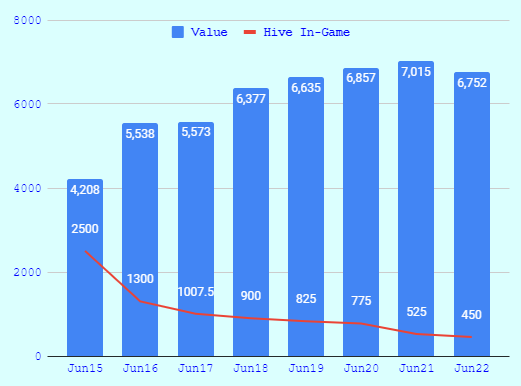
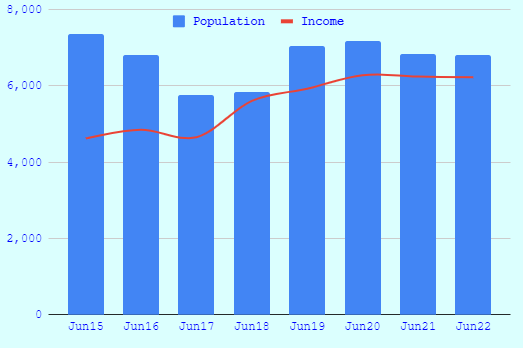
- The bars are the total value of the cards I currently hold
- The red line shows how much HIVE I started with when I was 100% vested into the game with 2,500 Hive
This is actually my favorite diagram... Jun15 in the graph actually represents my baseline which is June 7 or the launch of 2nd edition cards. I this point I had already about 1k HIVE in 1st edition cards, so the value of my deck then was 4,208 HIVE which I also valued off market prices then too.
*self-explanatory
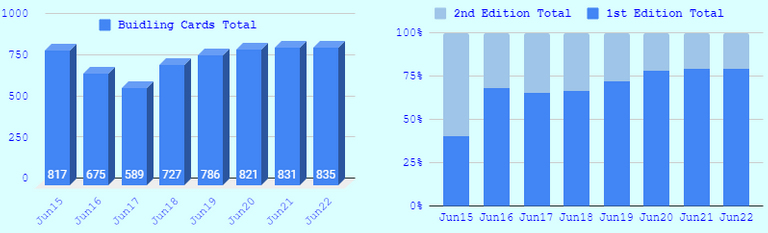
These are good ways to make sure the balance of my deck is not falling below the averages that would be in line with my strategy of the time. E.g. I am going to focus more on balance now, so I would expect to see the percent of 2nd edition cards begin to rise. This helps me stay honest with the strategy I set forth for myself as well.
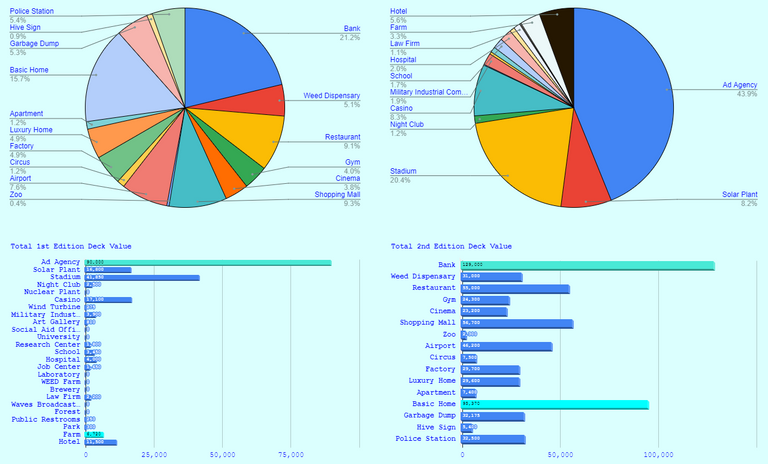
So I decided to represent the value of my deck by the sum of the qty of each card's total value in SIM. This way, the pie chart and data wouldn't be skewed since basic-homes would drive any diagram off that uses quantity of the card. My goal was to have no Wind Turbines or Art Galleries, as you can see, I've succeeded!
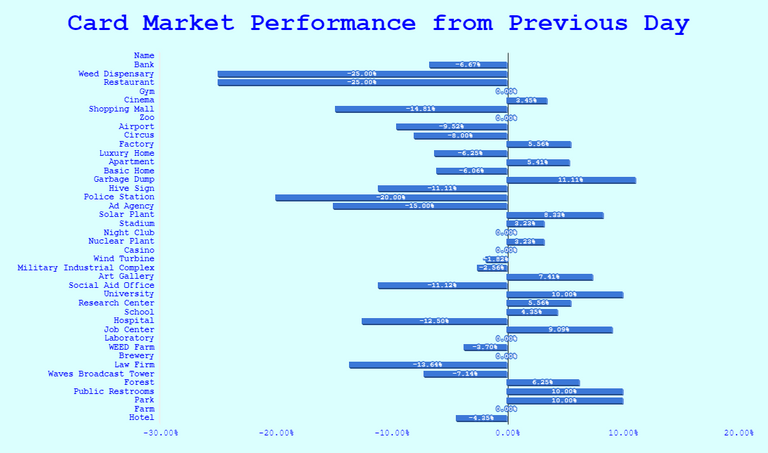
This is another chart I update, and I make the inputs that drive the numbers from my own market assessment of average pricing. I base my pricing extremely conservative from most common sale prices I witness. For the most part, it's pretty accurate!
Want Your City Stats Tracked Like Mine?
Please comment below or DM me on discord if you're a dCity player and would like me to track your stats in the same type of dashboard...
I would require some type of fair compensation ofcourse!


Posted Using LeoFinance
This post has been manually curated by @sayee from Indiaunited community. Join us on our Discord Server.
Do you know that you can earn a passive income by delegating to @indiaunited. We share 80 % of the curation rewards with the delegators.
Here are some handy links for delegations: 100HP, 250HP, 500HP, 1000HP.
Read our latest announcement post to get more information.
Please contribute to the community by upvoting this comment and posts made by @indiaunited.