The Hive blockchain went live on March 21, 2020. The majority of the community migrated to the new blockchain along with the majority of dApps.
How is activity doing on the blockchains? Here we will be looking in the numbers and not just in terms of posting but other activities as well, like custom JSONS that are mainly driven by games.

Before we continue with the analysis just a note on the activities. Unlike the good old Bitcoin, that has only one operation (transfer coins), Hive has a lot of them.
Usually when talked about activity on these blockchains a lot of the users have in mind posting and commenting. Here we will be looking in the top 4 activity on the blockchains. They consist the majority of all activity:
- Posts
- Comments
- Votes
- Transfers
- Custom JSON operations
The above consist more than 95% of all the activities on the blockchain.
Number of Posts and Comments
Here is the chart for the number of posts and comments on the Hive blockchain.
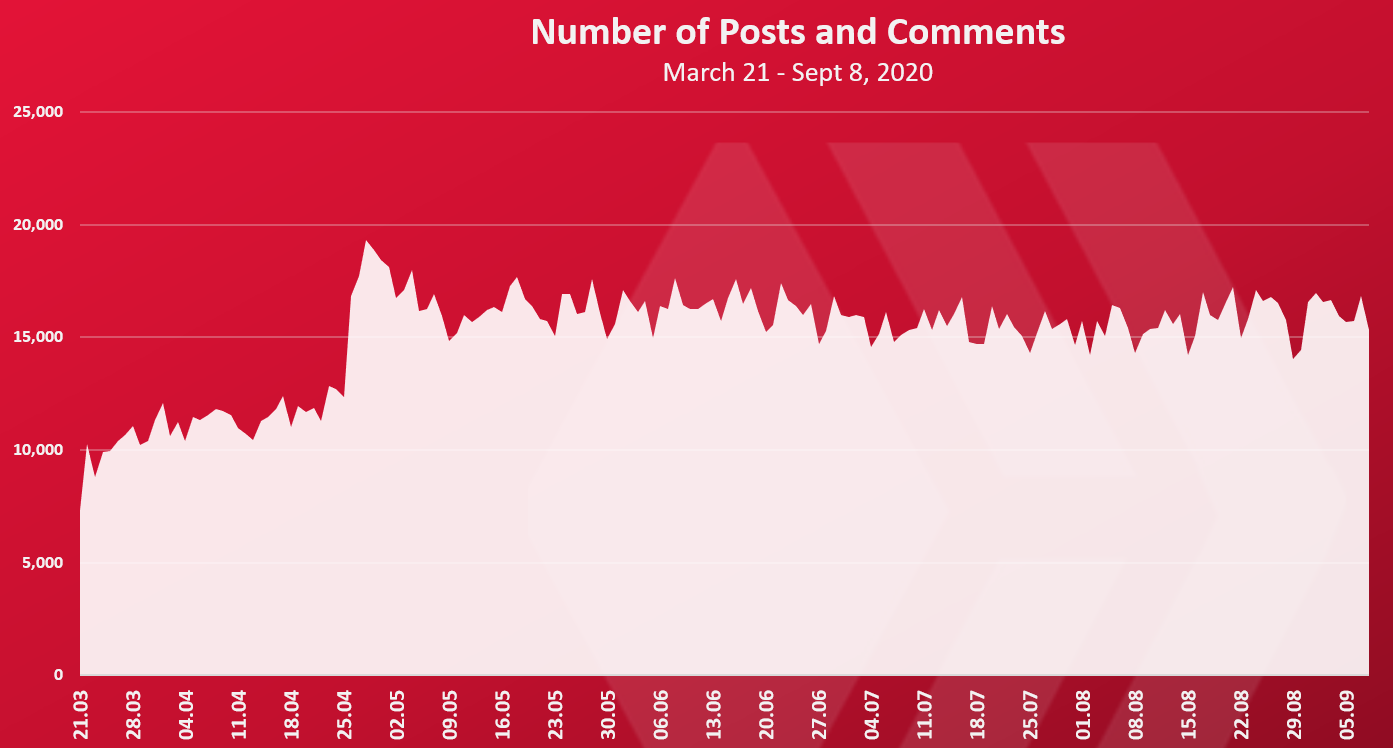
The number of posts and comments has been pretty stable in the past period. Around 16k in the last few months. In the begging, just after the HardFork the numbers were a bit lower with around 10k, but they have grown in the first month and stayed at that level ever since. The numbers of posts only are around 5k per day.
Number of Votes
The chart for the votes looks like this.
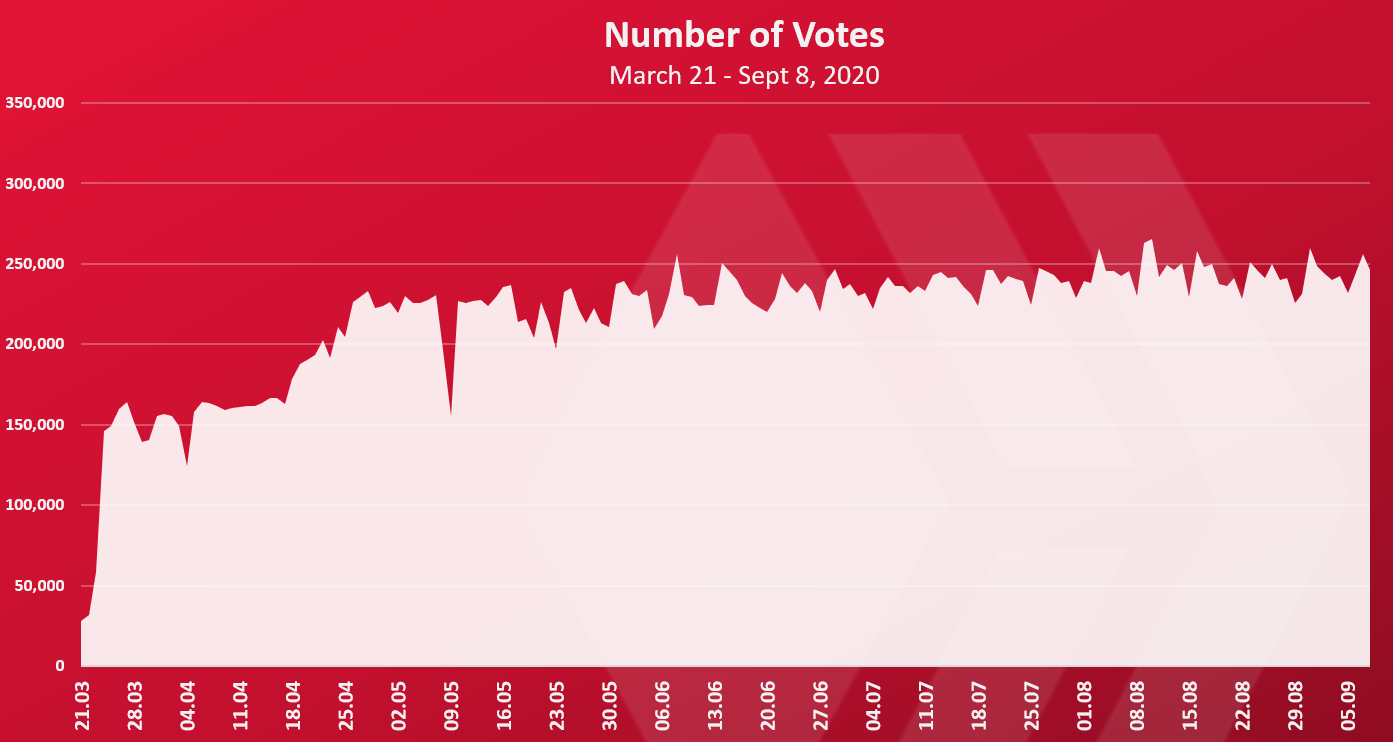
Votes are one of the core operations on the Hive blockchain. That how rewards are distributed. The Proof Of Brain mechanism (PoB) 😊.
The number of votes was started with around 150k per day, then reached above 200k, and it has been slightly growing in the last months with just a small growth to a 250k votes per day.
Number of Transactions
The chart for the transactions looks like this.
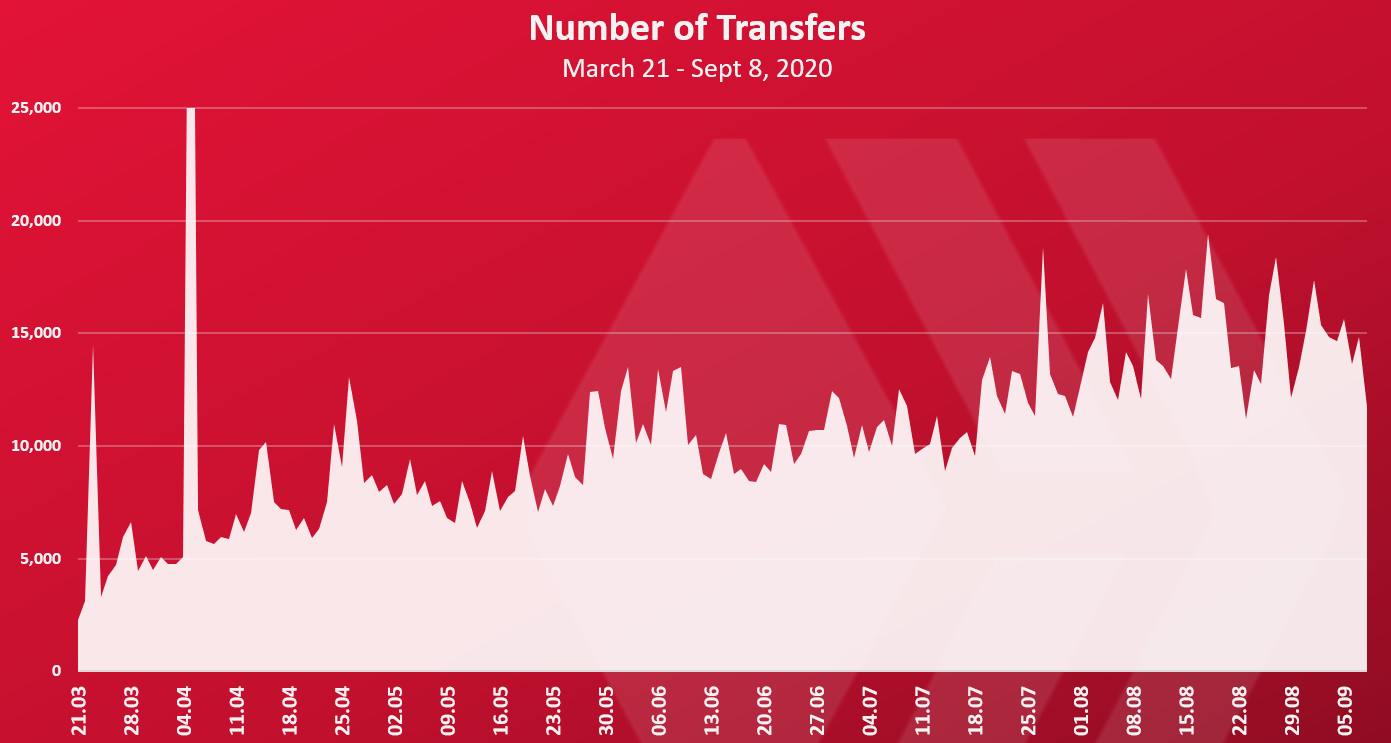
The number of Hive transfers has grown steadily since the creation of the blockchain. It started with around 5k per day and these days is around 15k daily Hive transfers. This means 15k per day people are sending and receiving Hive. Gas free 😊.
Number of Custom JSONs operations
The chart for custom JSONs operations.
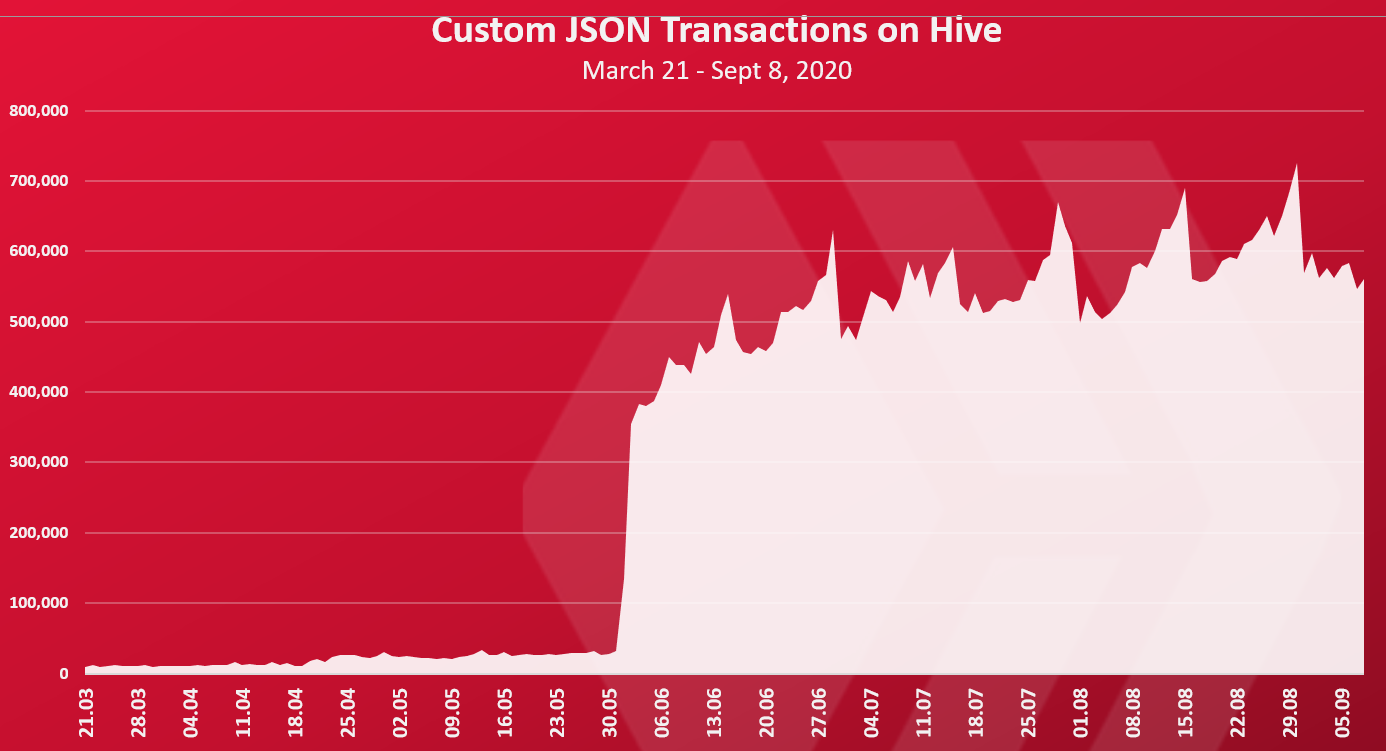
This is the most interesting chart of them all. With the big jump in the start of June. As mentioned, custom jsons are mostly used from the games on Hive.
Starting from June, Splinterlands migrated from Steem to Hive and increased the numbers of custom jsons operations by a lot. From around 25k per day to more than 400k per day.
Interesting the number of this operations keeps on growing and it has reached a record high of 700k per day. Splinterlands is behind most of the operations but other games are there to.
The nature of Splinterlands is like that. Its heavy on activity.
Overall Activity on Hive
When we combine all the charts above we get this.
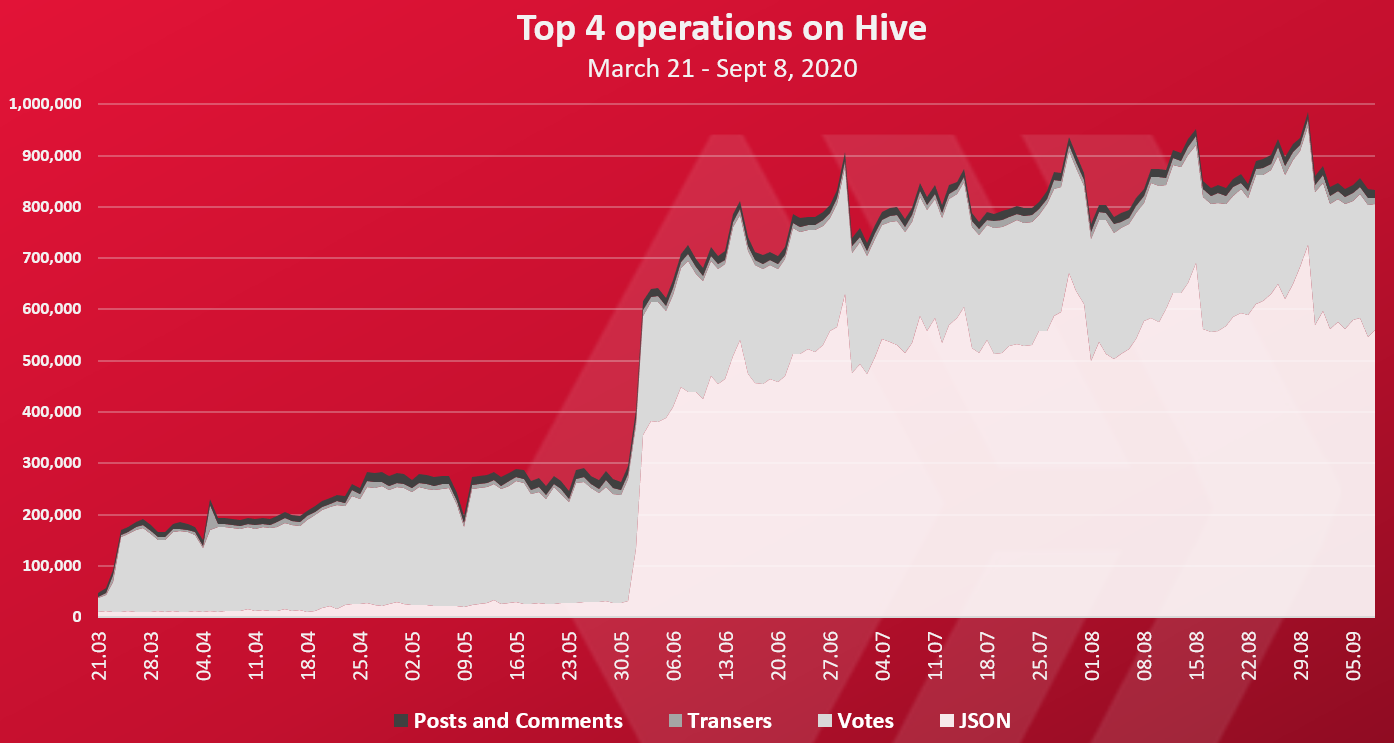
As we can see the custom jsons operation are now dominating the Hive blockchain. In the last period more than 65% of all the operations on the Hive blockchain are custom jsosn.
Although we should mention that the “weight” of these operations is not the same, so its not totally comparable.
Posts have the largest weight, as they require a lot of texts. Also, in the most cases they require some intellectual power behind them 😊.
Overall, all the operations are showing some growth except posts and comments. They are on the same level in the last months. At least not going down. The number of votes has increased, but just a bit. The number of hive transfers is showing a constant growth. The number of custom jsons has a massive growth since the Splinterlands migration and its continuing to increase further.
All the best
@dalz
Posted Using LeoFinance Beta
😂
Nice one!
Its highly subjective thing :)
Tweet:
Posted Using LeoFinance
Nice post with interesting statistics. Thanks you
Thanks!
One of my favorite posts that you do.
I wonder, would it be possible to break out the custom JSON based upon each game or does the search only reveal that one exists and cant see which game it came from.
It might be good to start a baseline of where gaming stands since it is taking up the large portion of the transactions. We know Splinterlands is the dominant one but some of the others could start to grow.
Charting the progress of the other games could be another way to see how things are going. For example, if @cryptobrewmaster doubled its custom JSONs in a month, that tells us something.
Posted Using LeoFinance Beta
Thanks!
Yes that can be done, and I will go into it in the next days/weeks :)
Also I'm planing to dive into the new accounts that starts gaming.
That would be very interesting to see how the people who sign up for gaming, if they stick around.
It is great to see stuff like this knowing many of the games on Hive are either in Alpha or Beta. They have not even reached full release.
Posted Using LeoFinance Beta
Thanks for statistics.
I've expected things within HIVE are a bit better.
Have spent lots of my time lately with APPICS
Oh its not as bad :)
Stagnant number of posts, increase in the gaming activity.
One thing I think people overlook is the latest change in the author/curation rewards.
Curation is now more profitable and a lot of hivers are curating only, that has led to smaller numbers of posts.