Let’s take a look at the HIVE tokenomics for May 2023.
The projected inflation for Hive for 2023 is 6.5% on a yearly basis, or 0.55% on a monthly basis.
Hive has a double currency system, HIVE and HBD, with conversions between them that add or remove HIVE from circulation on top of the regular inflation. Furthermore, the decentralized hive fund DHF, that serves as a DAO converts the HIVE that is in the DHF.
The @hbdstabilizer has also grown and it is playing an important role in the overall tokenomics, making conversions and trading on the internal market.
Because of this additional mechanics the HIVE inflation and supply can be drastically different in real time than the regular/projected one.
To be able to follow the HIVE supply we need to take a look at all the different ways HIVE is created, author, curation, witness rewards, conversions etc, then net that out with the HIVE burned from conversions, accounts fees, null transfers etc. To get the virtual supply we need to do the same for the HBD supply as well.
HIVE Created
Here is the chart.
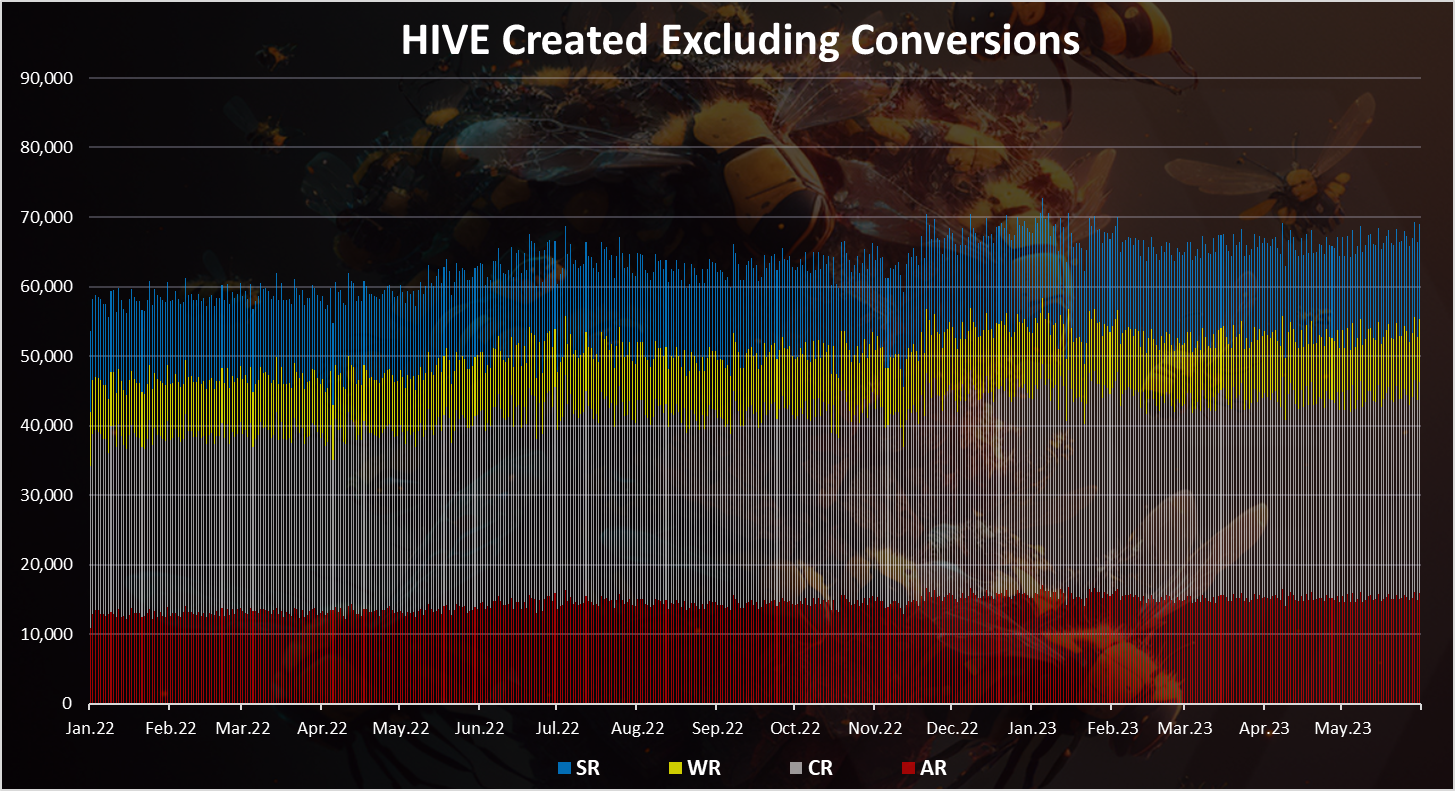
The chart above includes:
- Author rewards
- Curation rewards
- Witness rewards
- Staking rewards
These are the regular ways new Hive enters circulation, and all of them are through vested HIVE, aka powered up. You can notice the slight fluctuations in the daily amounts that is connected with the virtual hive supply, or the base for the inflation. When the price of HIVE is low, the virtual hive supply increases, and when it is up, the virtual hive supply decreases.
The thing is the conversions are playing a major role in the ecosystem. Here is the chart again, including conversions.
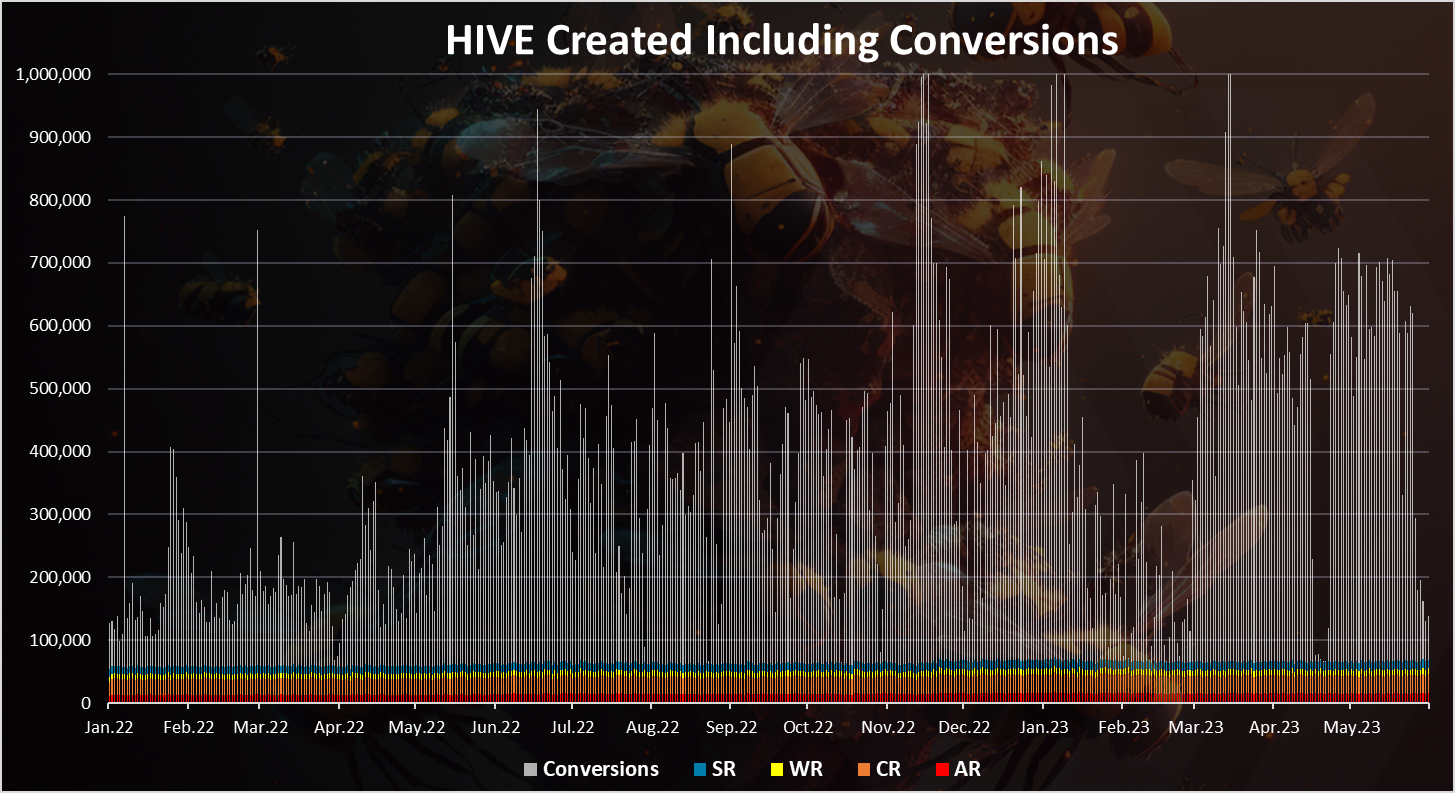
We can notice that the HBD to HIVE conversions are the dominant in the chart. This works in both ways and a big part of them is converted back to HIVE, especially through the work of the stabilizer.
The regular inflation is around 65k HIVE per day. On the other hand, the conversions averaged around 450k per day, although as noted a lot of them are converted back to HBD.
We can notice the drop towards the end of the month. This is because the stabilizer has changed its funding from the DHF and has reduced the daily amount of funds it receives and sends them back to the DHF.
HIVE Removed From Circulation
Here is the chart.
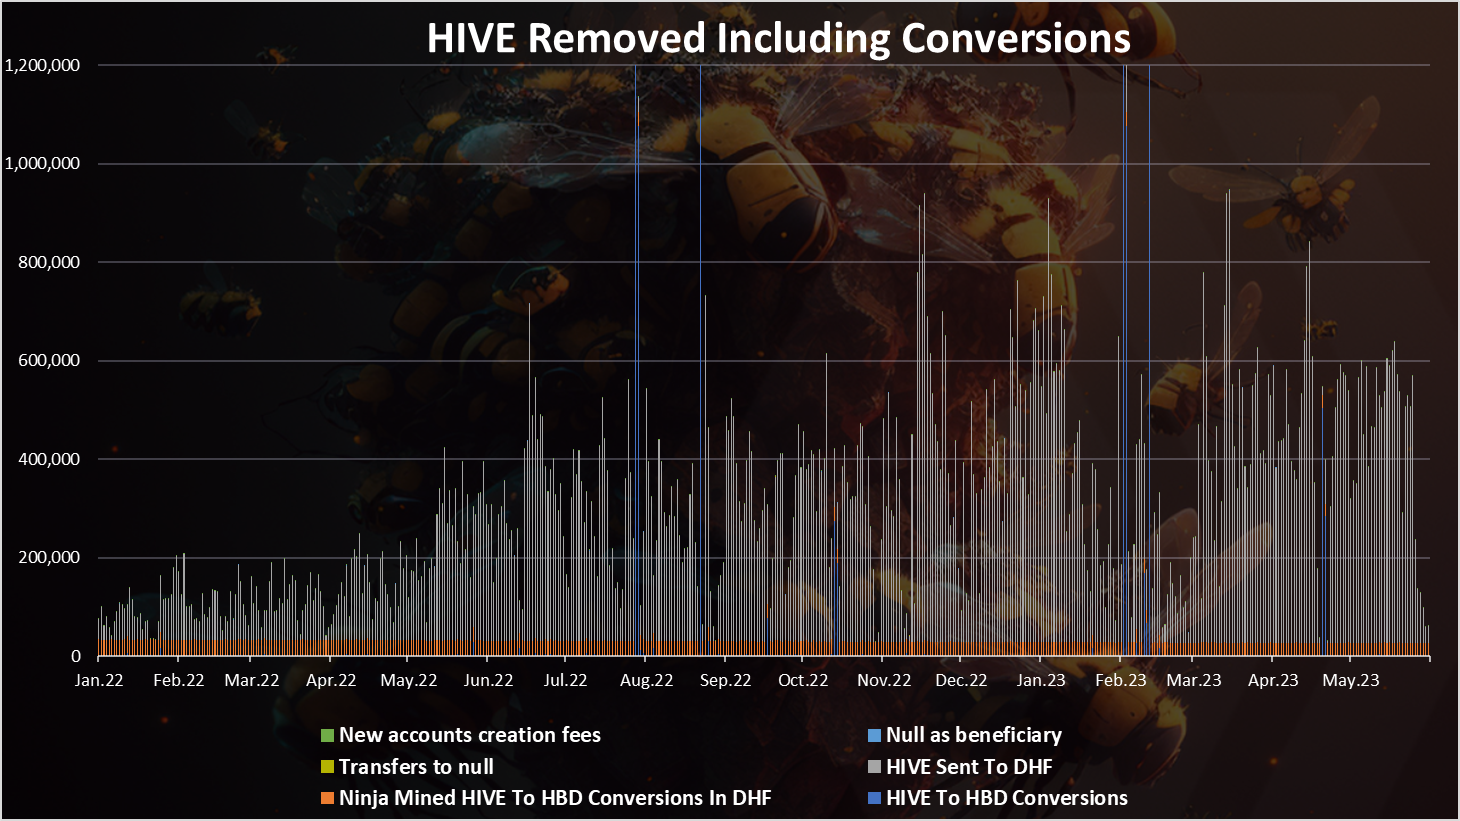
The above takes into consideration six different ways of HIVE removed
- Ninja Mined HIVE To HBD Conversions In DHF
- HIVE transfers to DHF and converted to HBD
- Transfers to null
- Null as post beneficiary
- New accounts creation fee
- HIVE to HBD conversions
The HIVE transfers to the DHF are now dominant. These are transfers made by the stabilizer. We can see a few spikes in the HIVE to HBD conversions (blue) in February and again recently in April 2023. These were due to the increase in the HBD price.
Historical HIVE Supply
When all the above is added and removed, we get this chart for the all-time HIVE supply.
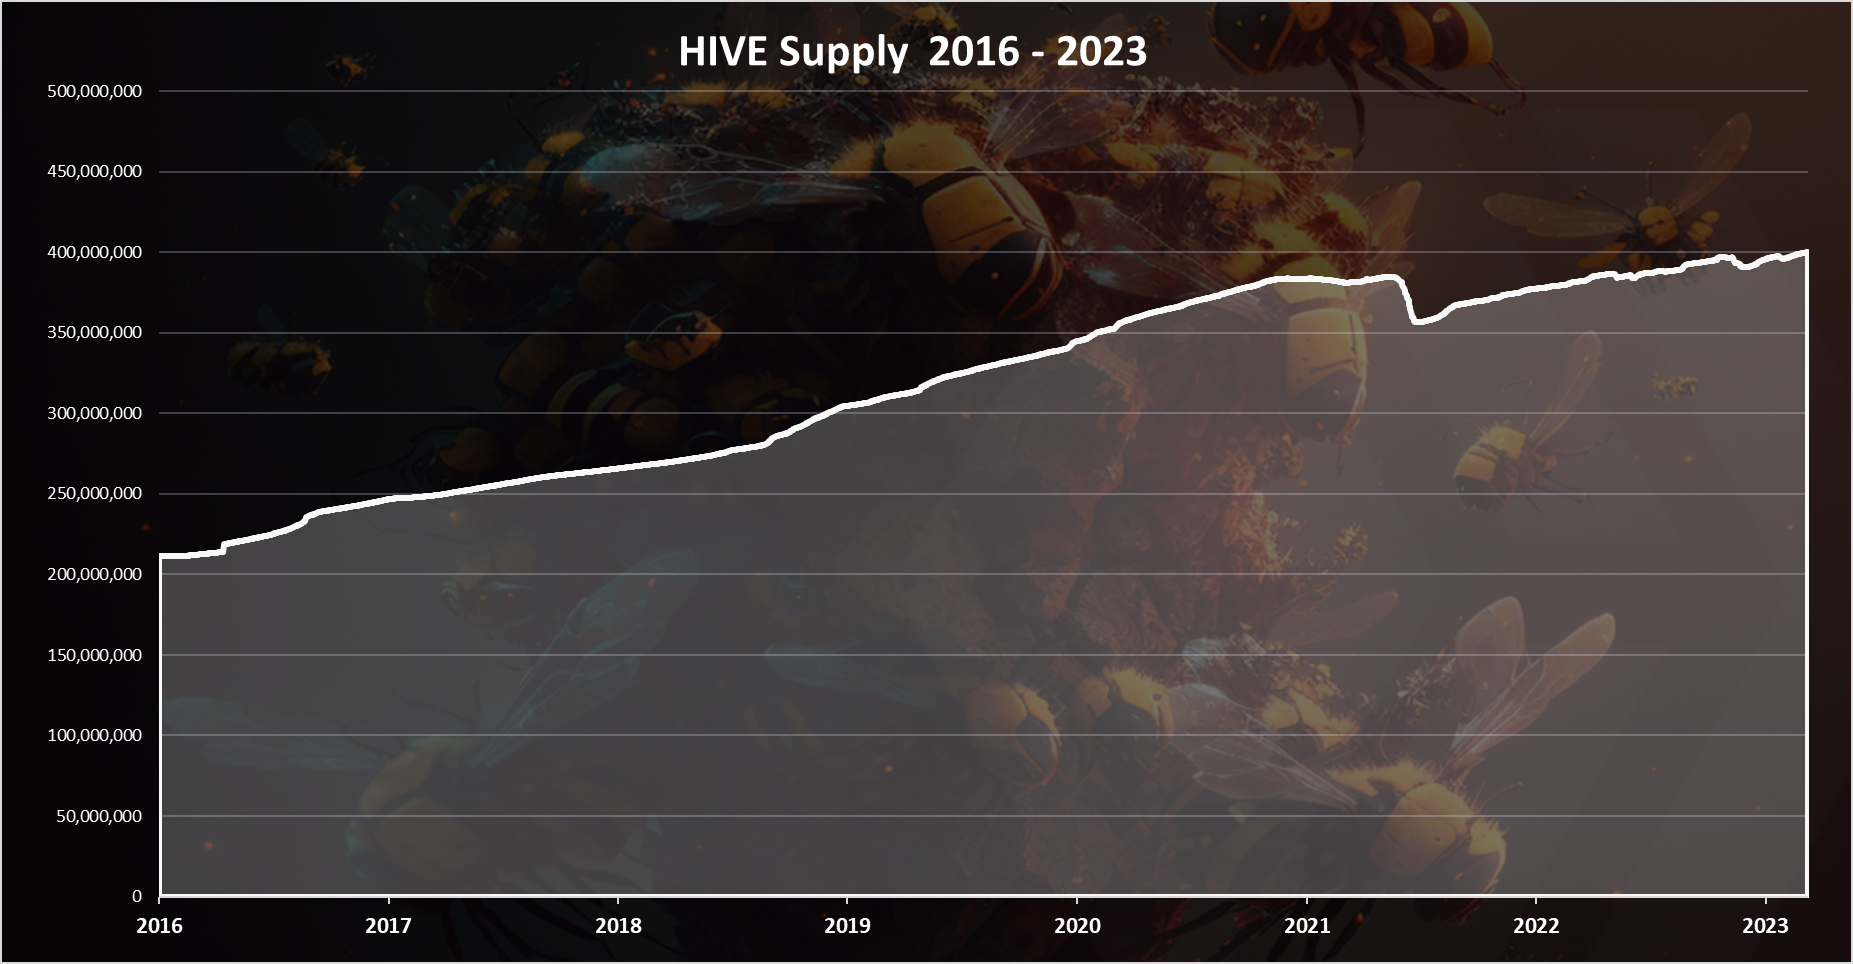
Up until August 2021, the supply was almost steadily increasing with a small fluctuation. Then a drop in the supply in September 2021. Since then, from time to time we can see some drops in the supply with the recent happening in February and April 2023.
HBD Supply
Here is the chart for the HBD supply.
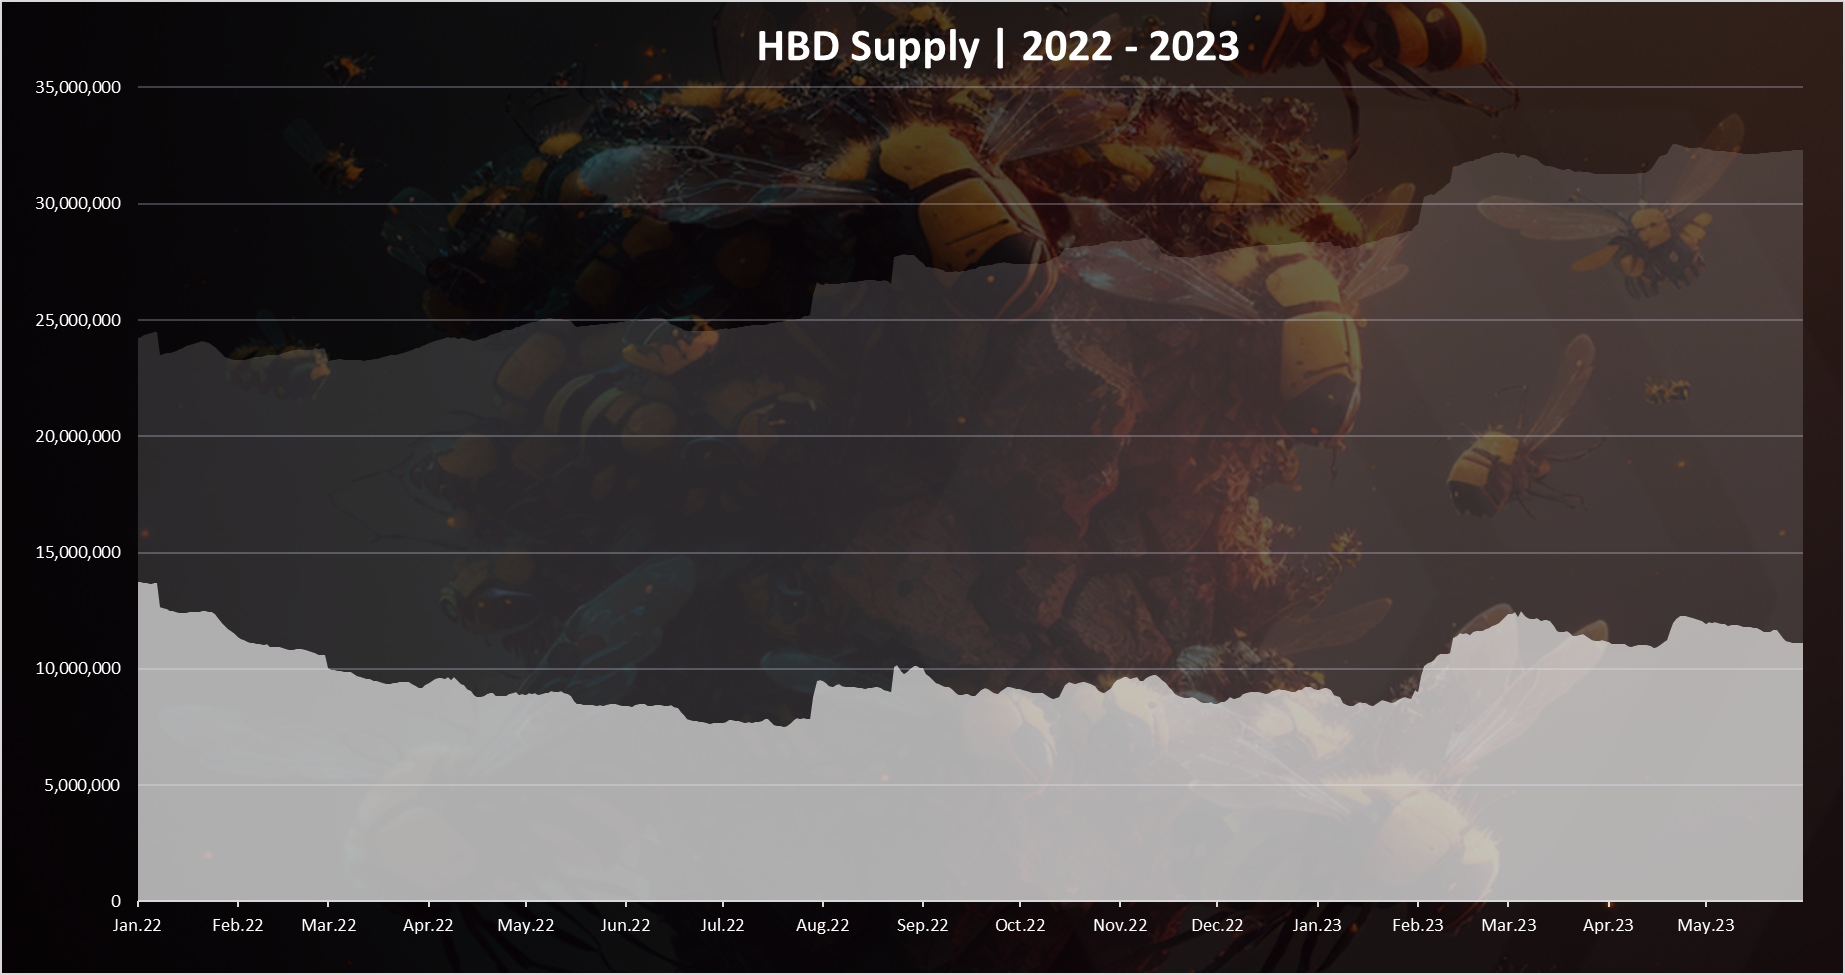
This is a chart starting from 2022.
The light color is HBD in the DHF. The HBD in the DHF is not freely circulating HBD and only enters circulation when payouts to the DHF workers are made.
HBD is being created and removed in a various way, but the conversions play the major role here in both directions. Other ways HBD is created is DHF proposal payouts, author rewards and interest.
We can see that after a downtrend in 2022, but in 2023 there was an increase in the HBD supply in February, a small decrease in March and again a small increase in April.
In May the HBD supply decreased almost for 800k HBD from 11.9M to 11.1M HBD.
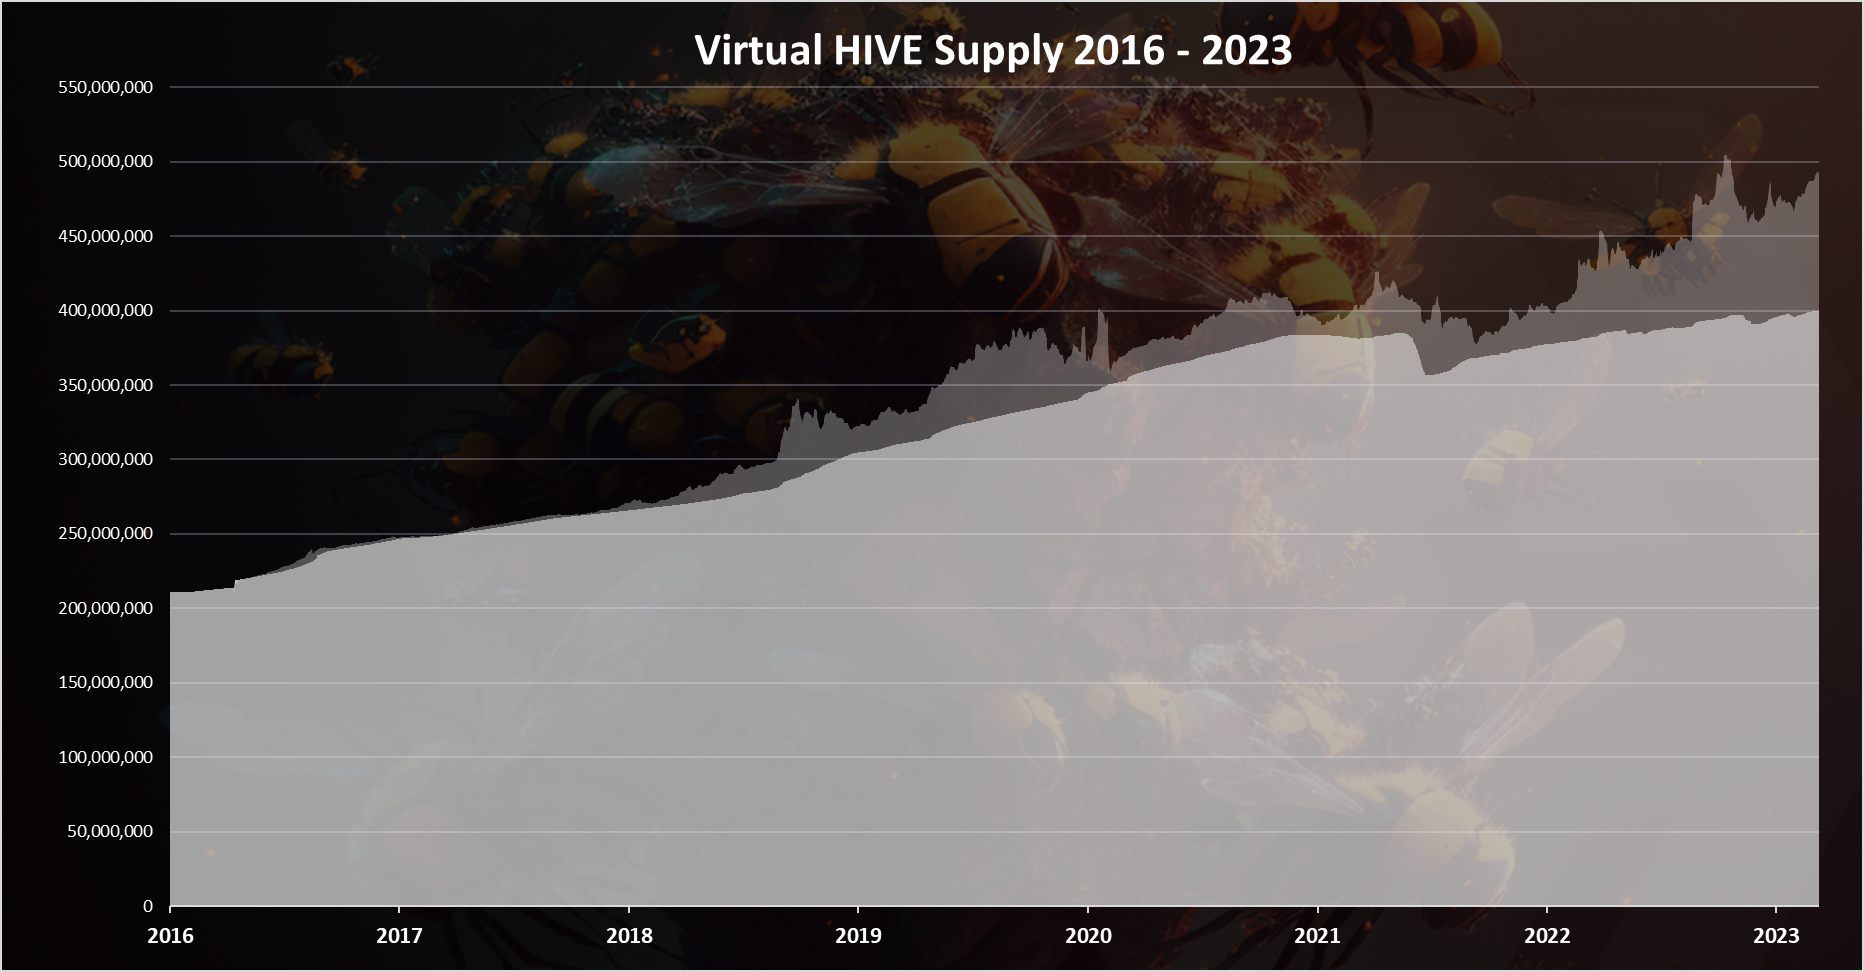
Virtual HIVE Supply
When we add the HIVE equivalent supply from the HBD to the HIVE supply we get the chart bellow.
When we zoom in 2022 - 2023 we get this:
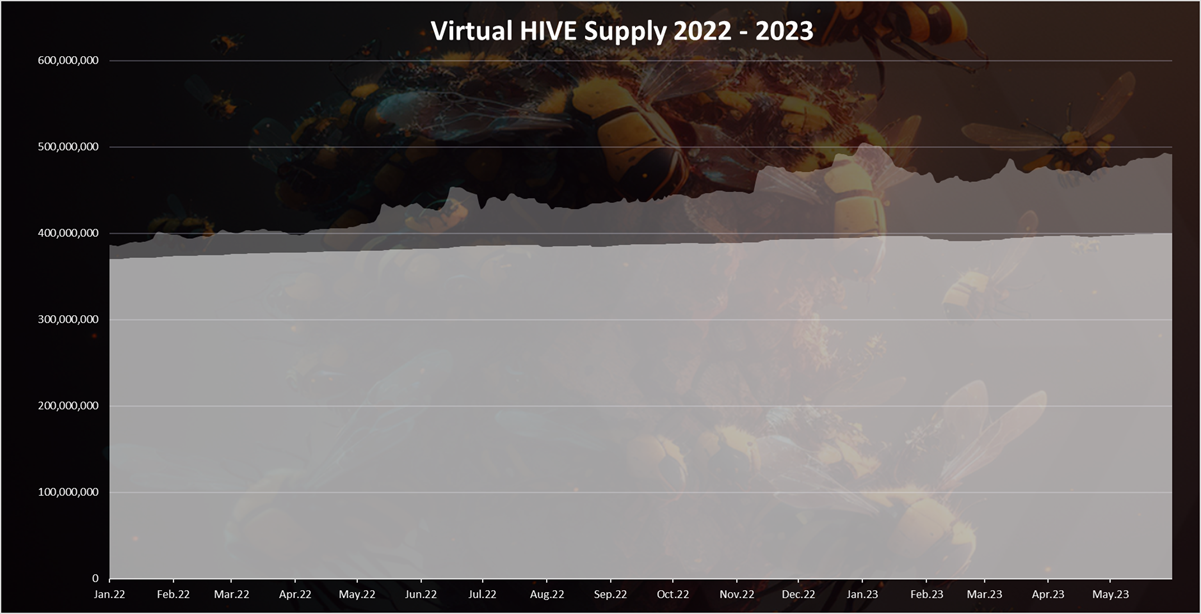
The light color is HIVE that in theory can be converted from HBD at the current market prices for HIVE.
We can see that the virtual supply fluctuates a lot, mostly because it is tied to the price of HIVE. As the price of HIVE drops, the virtual supply increases and the opposite.
In 2022 the virtual supply has increased because of the drop in the HIVE price. In the last month we can see a slight increase in the virtual supply because of the drop in the HIVE price.
Projected VS Realized HIVE Inflation In 2023
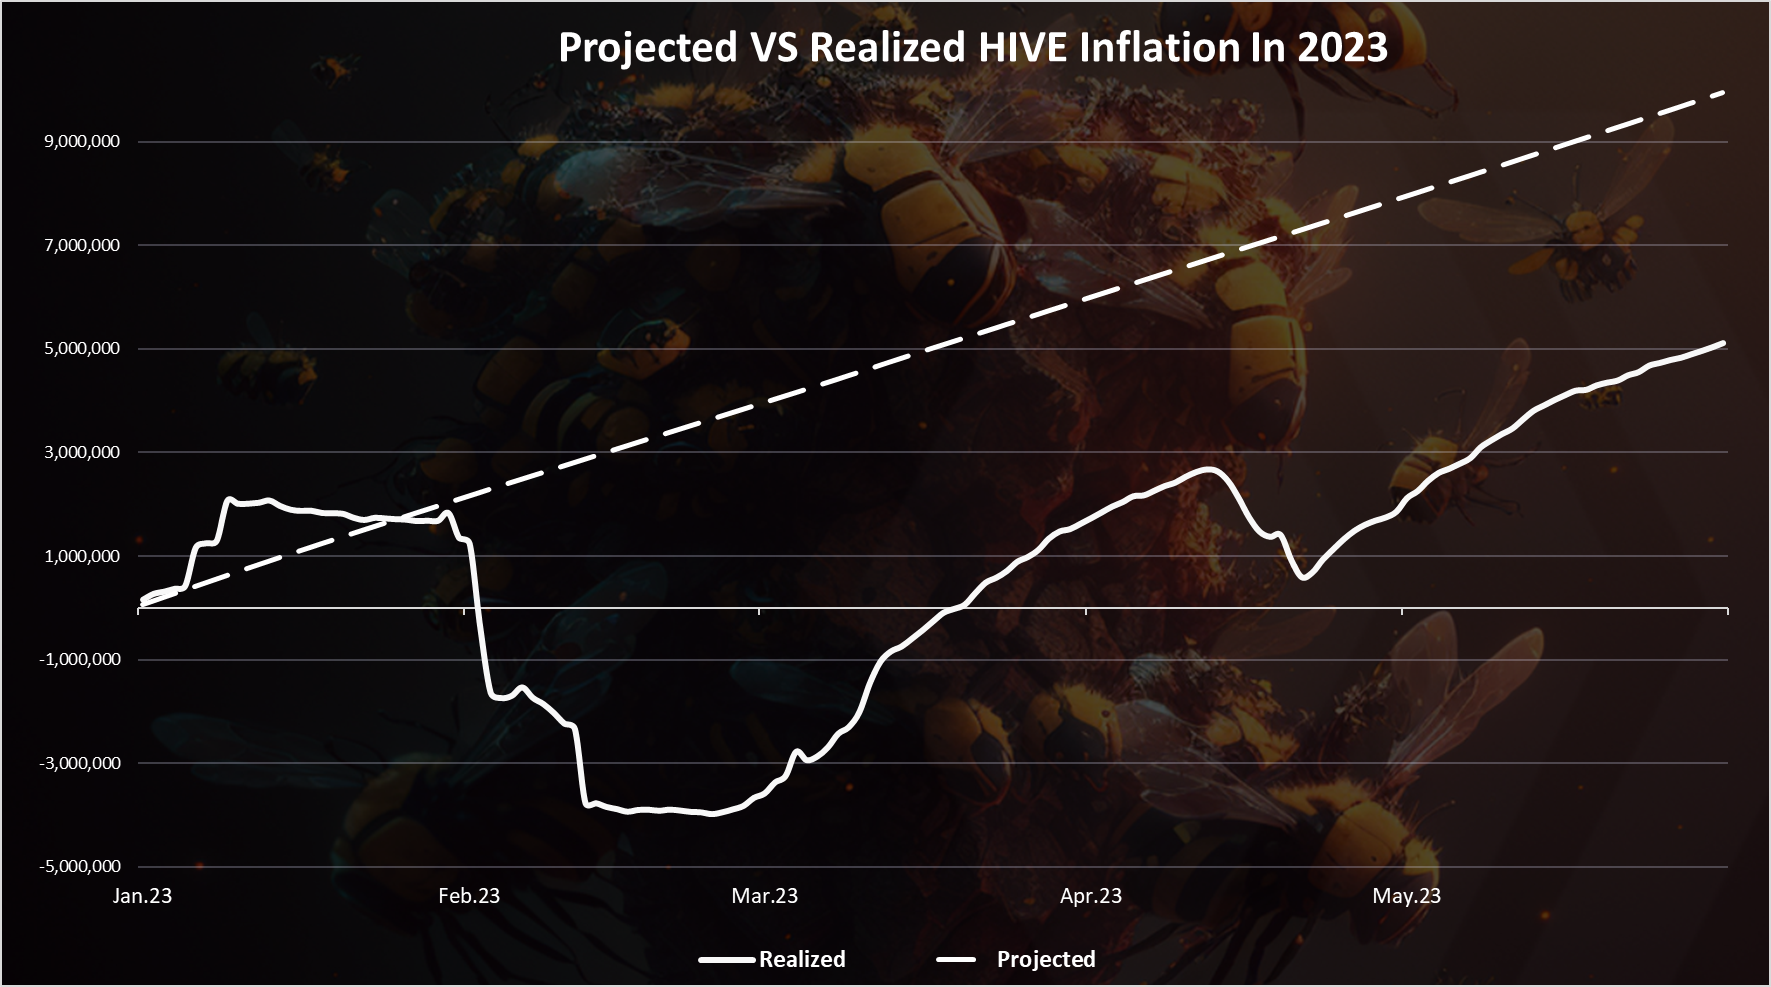
This chart is telling the story of the new HIVE entering circulation in 2023.
There was some uptrend in the first week of the year, a slow downtrend since then, and a sharp drop in February.
In March we have seen an expansion in the HIVE supply and then a downtrend again in April, especially around April 20 when there was a demand for HBD.
A cumulative 5M HIVE added in 2023, lower than the projected one, that would have added around 10M new HIVE up to May.
Monthly Inflation
If we plot the monthly inflation, we get this.
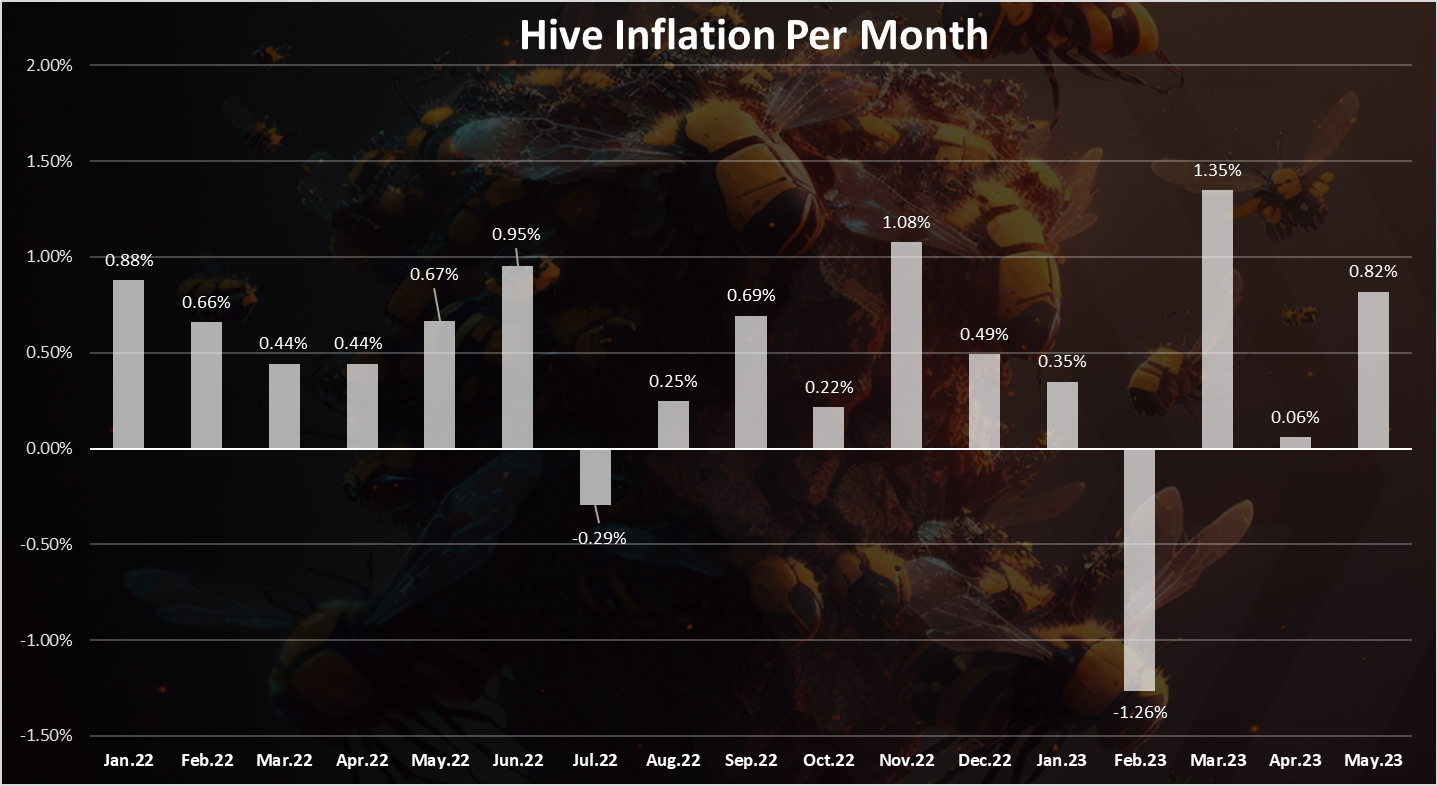
2023 has been interesting. January had a small positive inflation, February a negative one, that was offset by the positive inflation in March, April is almost at zero, and May is up again with 0.82% monthly inflation.
In terms of absolute numbers the HIVE supply in May has increased from 397M to 400M, adding 3M HIVE in circulation. For comparison the projected monthly inflation is around 2M HIVE.
Yearly Inflation
The yearly, projected and realized inflation looks like this.
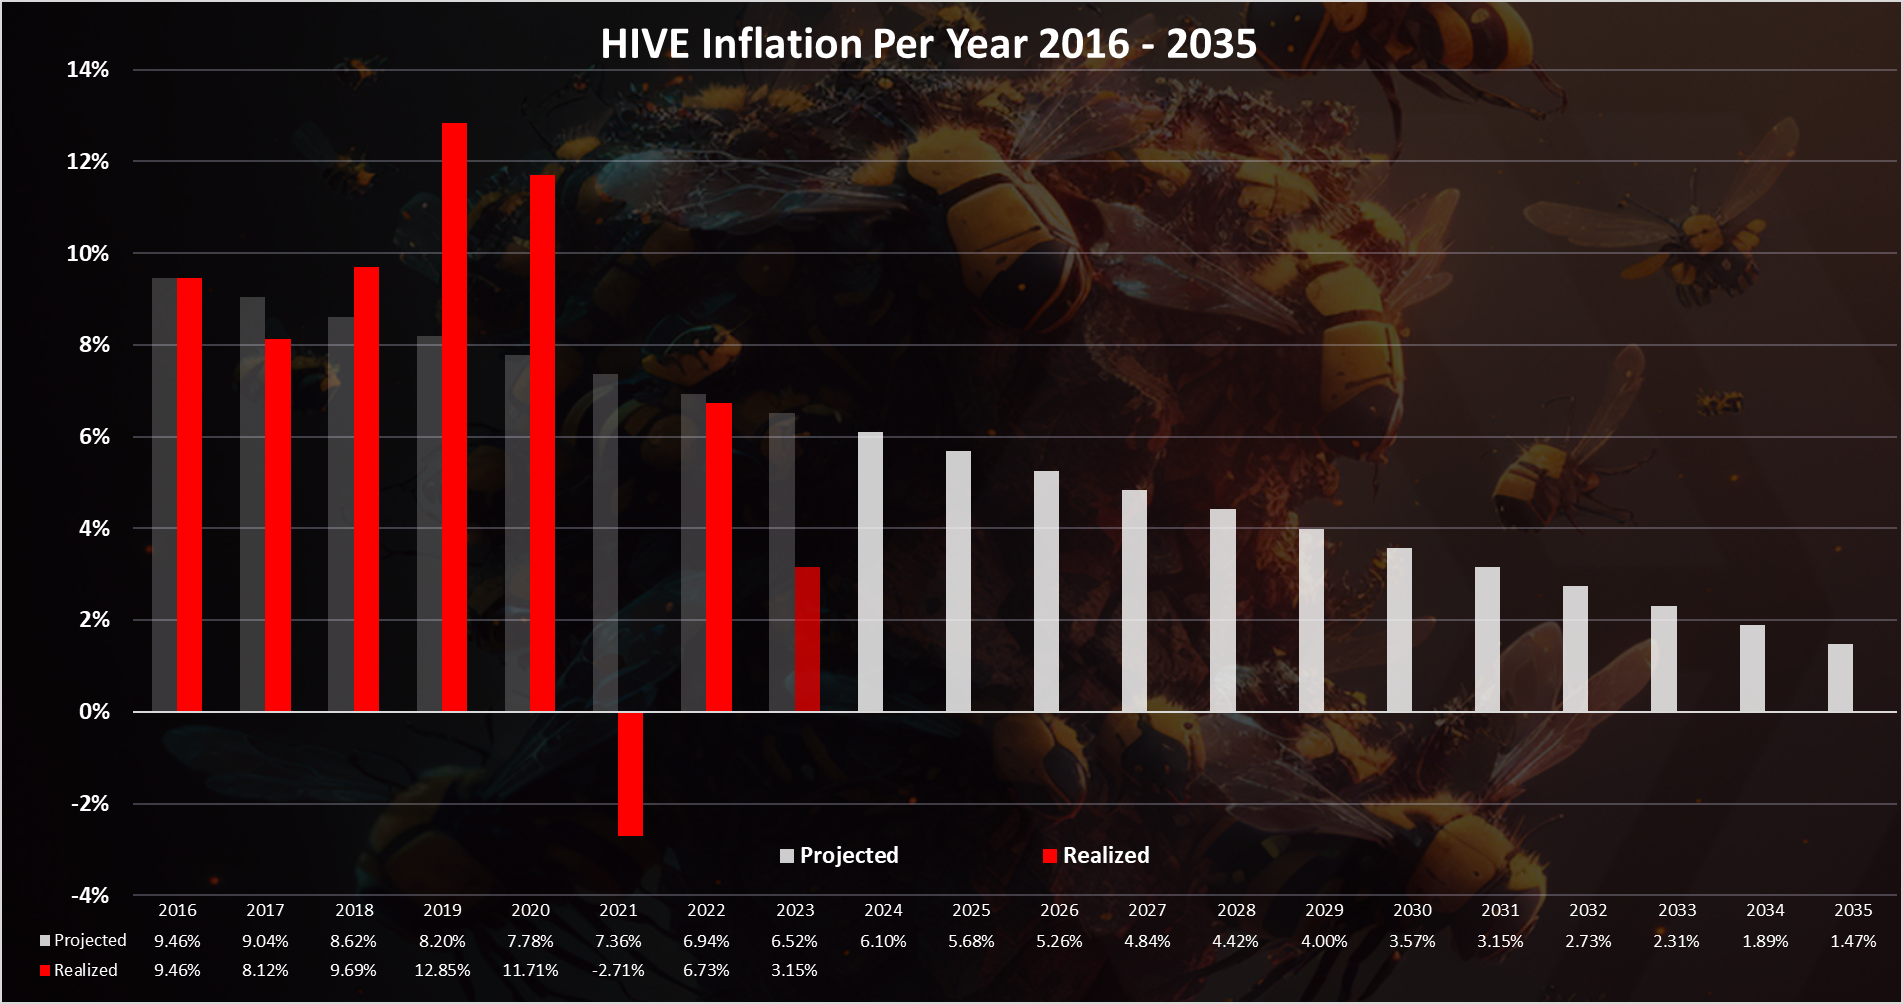
Hive is still below the projected line for inflation in 2023. From the first five months, Hive is on the way to end around 3%, that is below the projected 6.5%. We are still early in 2023, so a lot can change in the coming months.
Net HIVE Created By Category In May 2023
Here is the new HIVE put in circulation by category for the month.

Conversion are on the top for May with 1.2M HIVE, and that is the main reason for the expansion of the HIVE supply in May. Curation rewards are on the second spot.
All the best
@dalz
Posted Using LeoFinance Alpha
Great stats and with the inflation going down year after year we might see more value being captures and transposed into the token price as well. Would be interesting to see a supply vs price evolution and check if there is any correlation in between these two. What do you think?
Thanks Dalz, very informative. 1,1M conversions is quite a lot in May.
i like hive ^^
It's interesting to see that conversion is on the top in creating new Hive. Lot of trading activity. Thanks for the update :)
https://leofinance.io/threads/seckorama/re-leothreads-os878mmq
The rewards earned on this comment will go directly to the people ( seckorama ) sharing the post on LeoThreads,LikeTu,dBuzz.
@tipu curate
Upvoted 👌 (Mana: 40/50) Liquid rewards.
Thank you so much brother it's so informative and helpful for understanding hive tokenomics and supply
With the cool rate at this chart. It show hive will be much more higher in coming years as People tend to dive into it
With the cool rate at this chart. It show hive will be much more higher in coming years as People tend to dive into it
The way we're seeing the supply and demand within this market is very well regulated is the way we've seen the stable coins that were down within the market come down. But HBD has remained standing at 1$. Thanks for sharing this great and informative stats with us.
This shows that all the mechanisms we have in hive are quite useful and stable, I really feel that in the next bull run we will see hive at $1 or more
wow that's insane share more about hive
When you show Net HIVE created in May 2023 are you taking into account the value in HIVE of the HBD paid to the authors?