The Relative Strength Index, or RSI, is one of my favorite indicators because of how easy it is to interpret the signals, however, as no indicator is infallible, we must always be careful when analyzing the signals, and among the signals that we must take into account to place a sale properly when using this indicator, is to evaluate well the overbought conditions and bearish divergences.
Edited image, original from pixabay.com.
There are times when our emotions make us close a position too soon, which prevents us from perceiving better profits, or in the opposite case, make us keep a trade open for much longer, causing our profits to be reduced, so the precise moment to make a sale is what determines whether the operation is profitable.
This is why it is important to watch for trend changes, and spotting warnings that a reversal may occur would not help to avoid buying at the end of an uptrend or selling as the price dips. And the RSI is a very useful tool to help traders detect these reversal signals.
Recall that the RSI indicator is a momentum oscillator that allows us to estimate the magnitude of changes in the price of a cryptocurrency, it moves between 0 and 100, being commonly used to detect overbought or oversold levels of the asset. And it is established that when the RSI moves between 50 and 100 it favors the bulls, while if it moves below 50 it means that the bearish are in control; and by default, in most graphical analysis platforms the level 70 is set to indicate that the asset is overbought, and when the chart line crosses below the level 30 it indicates oversold.
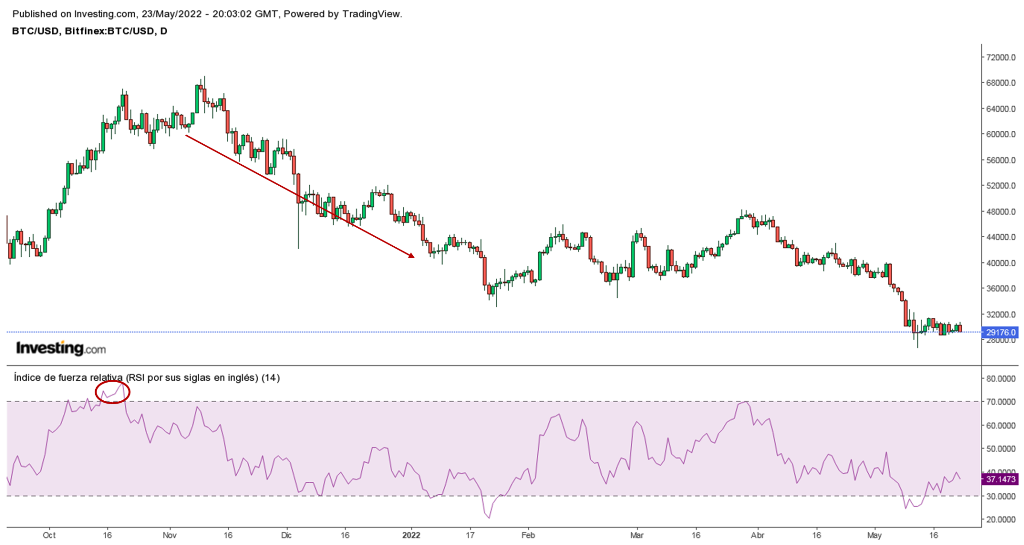
Daily chart of the BTC/USD pair with the RSI indicator. Source: image taken from Investing.com.
In the above image we can see that the BTC bull run between October and November 2021 practically ends after surpassing the 70 level of the RSI, after that came the trend reversal. So in practice, the essential thing is to learn how to interpret these overbought and oversold signals to make higher profits.
Identifying overbought conditions
Now, just because the indicator line crosses the 70 level when an uptrend has started does not mean that you should immediately close the trade, as there is a possibility that when it breaks out of a range zone or crosses a major resistance level, traders start buying, and sustained buying can keep the RSI in the overbought zone for a considerable time.
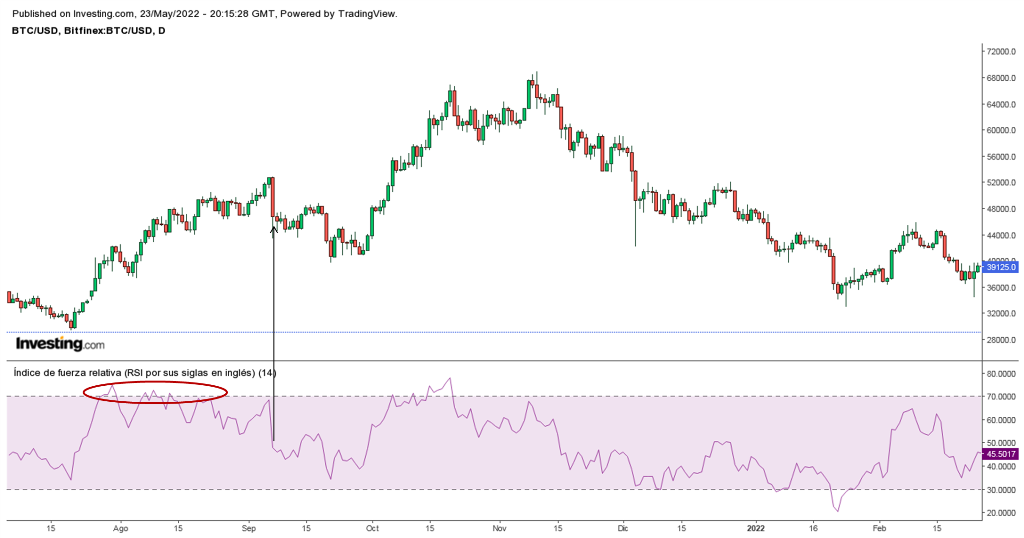
Identifying overbought conditions. Source: image taken from Investing.com.
As we can see in the image above, the BTC uptrend indicated above started at the end of July, and as we can see in the image, the indicator kept oscillating in the overbought zone until mid-August, we see that the indicator jumped the 70 level on July 30, traders who sold when the RSI line jumped this level would have rushed to take profits, as we see that when leaving that level it returns several times. On the other hand, we see that traders who sold when the indicator crossed the mid 50 level, when prices made a correction, took advantage of that local high.
However, we can notice that the indicator line never reached the oversold level during that correction, and prices resumed the bullish run, so those who entered that correction had the opportunity to capture the rest of the bullish run that lifted the BTC price to $65000.
Bearish divergences
As the RSI is a momentum indicator, it should rise when prices do, however there are times when the RSI does not follow the same trend of the price, a phenomenon known as divergence, and when the price rises while the RSI follows an opposite trend it is called bearish divergence, and this situation is very important to be recognized as it is a sign that the uptrend is running out of steam.
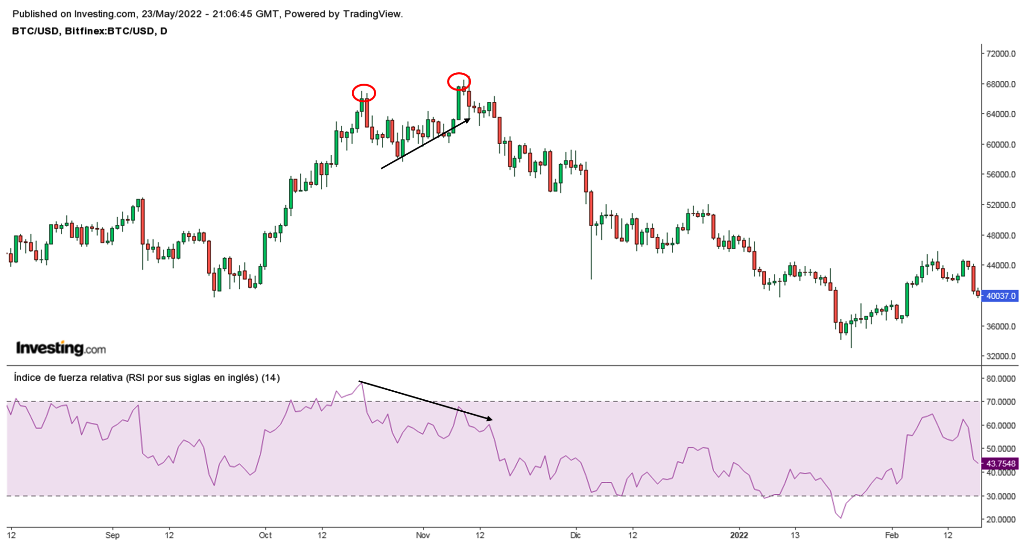
Bearish divergence on the BTC chart. Source: image taken from Investing.com.
in the above chart we can observe a bearish divergence, which then resulted in a prolonged fall in BTC prices, as we can see the indicator line surpassed the 70 level when BTC reached the high of $66000, however we can notice that prices continue to advance to establish the historical high of almost $68000 while the RSI line describes a downtrend, which is a sign that the upward momentum was running out.
When we observe the formation of a bearish divergence we must be attentive and wait for prices to react and start the trend reversal before selling, for this we can support the analysis with a Simple Moving Average and wait for the break of this line to the downside, confirming this trend with the crossing of the RSI line below the 50 level.
So, as we already know, the RSI is an indicator that can help us to identify the end of a bullish cycle, but instead of selling at the highs, when we have overbought readings, we must be careful that the overbought condition is not sustained for several periods and we lose to capture more profits, as well as support our RSI reading with moving averages that indicate that the trend has indeed lost its momentum.
Thanks for coming by to read friends, I hope you liked the information. See you next time.
Posted Using LeoFinance Beta