
Direct from the desk of Dane Williams.
As a LeoFinance is a trading and investment social community, I always like reading less talk about LeoFinance itself and more, well you know... actual trading and investment content.
One market analyst who I enjoy reading and chatting markets with is @cryptospa and if you haven't had a chance to yet, check out today's daily TA featuring the EUR/USD monthly.
Reveal spoiler
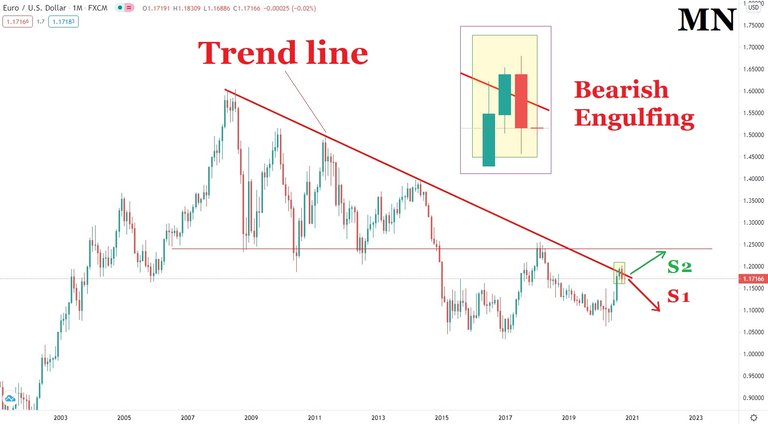
You can see that @cryptospa's monthly chart shows both a bearish trend line and a bearish engulfing candle pattern at resistance. A nice confluence of resistance with multiple factors pointing to a possible opportunity to get short.
Now with the truly higher time frame view in mind, lets zoom into the daily and apply my own process.
EUR/USD Higher Time Frame View
Starting with a daily chart, here we go.
EUR/USD Daily:
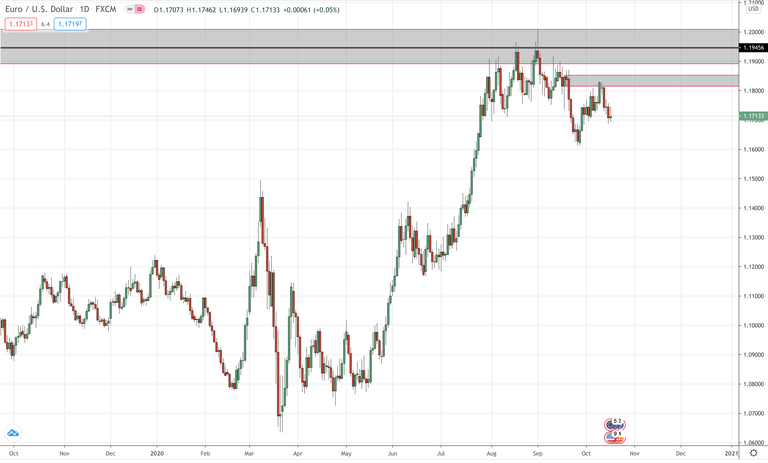
I know my chart doesn't really show the process of how or where I've drawn the daily horizontal resistance zone in question, but I assure you if you scroll to the left on your chart, you won't have too many problems finding it.
My whole process is about taking the most obvious areas of support/resistance and using them as the basis of my trading decisions.
If you've been following the blog, you'll know that I've already been trading around this EUR/USD resistance zone from the short side, but with the higher time frames all screaming short, there's possibly more in this one.
I'm going to leave this one here though and we can zoom in and look at trading around this zone when markets open on Monday and I'm back on my MT4 charts.
I hope you're enjoying your weekend :)
Best of probabilities to you,
Dane.
FOREX BROKR | Hive Blog
Higher time frame market analysis.
Posted Using LeoFinance Beta
Hey, @forexbrokr, thank you so much for mentioning me and for the nice words! It is always pleasure to check your TA!
Posted Using LeoFinance Beta
It's a nice chart. Keep up the good work :)
Posted Using LeoFinance Beta