
Direct from the desk of Dane Williams.
After rejigging my GBP/USD daily zones as price approached support last week, the setup has played out nicely.
Just what we want to see on a Friday morning, huh!
Anyway, take a look at the updated Cable daily chart below.
GBP/USD Daily:
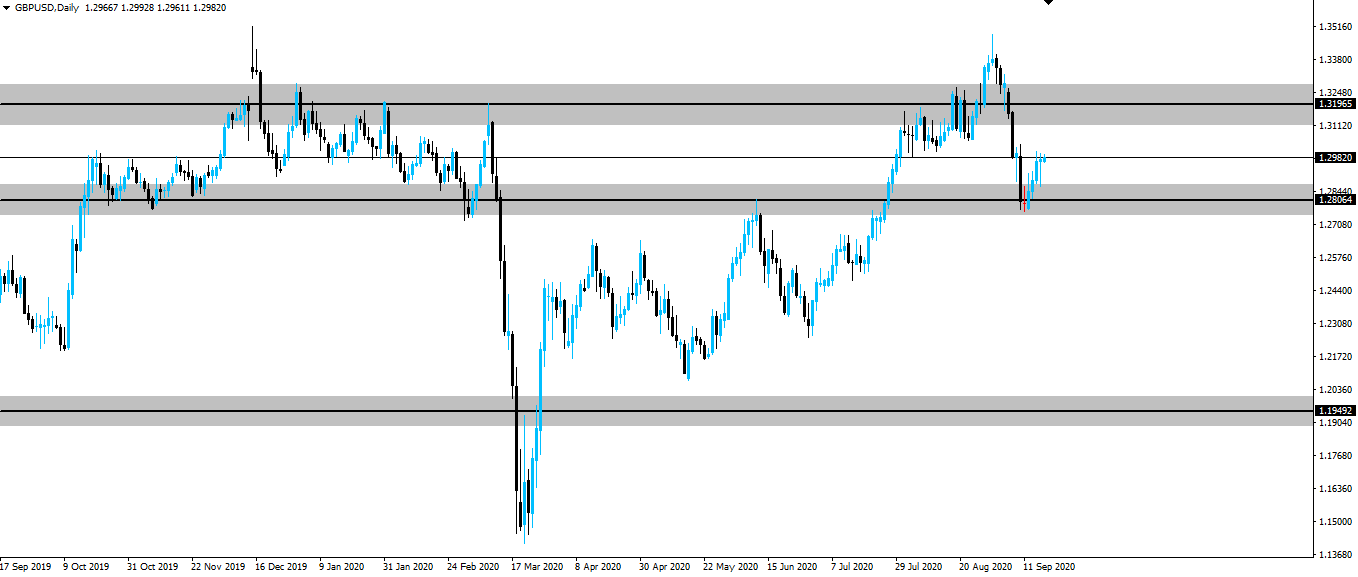
As you can see, price came down hard into this daily support zone and immediately the bulls halted the bears' charge.
On my MT4 charts I've got dojis to print as red crosses and it always blows my mind that after an entire day's price action, price can lose EXACTLY where it opened.
As price is still above higher time frame support, we zoomed in to an hourly to only look for possible longs.
GBP/USD Hourly:
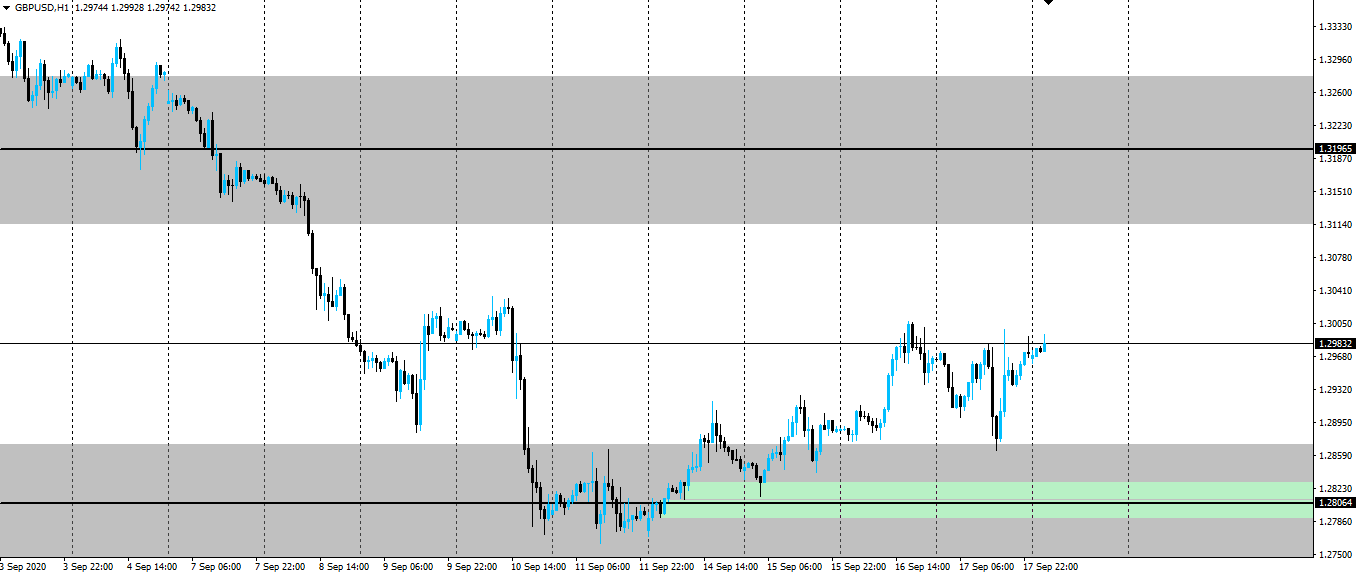
This was a clean one that I know some of you who trade with me on Twitter, got.
After price bounced above our higher time frame zone, we marked the last level of short term resistance that if retested as support, we'd use as a signal to get long.
A retest that you can see price clearly gave us before the most recent rip.
Nice.
Best of probabilities to you,
Dane.
FOREX BROKR | Hive Blog
Higher time frame market analysis.
Posted Using LeoFinance
Nice work. Looks pretty textbook but it's good to catch these ones anyways.
Keeping it simple stupid as always ;)
Posted Using LeoFinance Beta