
Direct from the desk of Dane Williams.
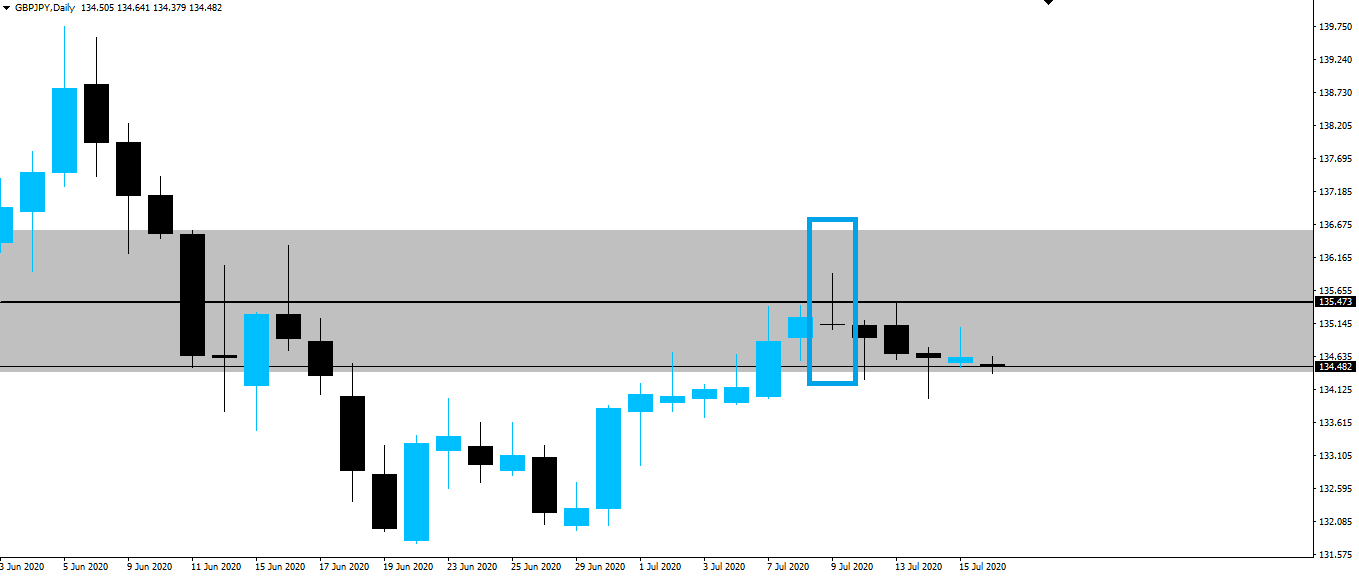
Remember back to last Friday's blog when we highlighted the fact that GBP/JPY formed a gravestone doji at daily resistance?
Well, let's expand a little further on the setup, what it all means, and how to hopefully make some money trading it.
Gravestone Doji
The gravestone doji candle has a long upper wick, no or a small lower wick, and a close at or almost at the same price it opened.
The bulls were in control early as the candle opened and printed a high upper wick. But the bears managed to surge back, closing the candle close to where it opened.
GBP/JPY Daily Chart Prints Gravestone Doji:
Notice that rather speaking in exacts, I've said that they may have a SMALL lower wick and can ALMOST close at the same price?
This is because in reality, markets never give you a perfect version of a candle and as long as you can identify what the candle is telling you, then you can make money from them.
What the Gravestone Doji Shows
What the gravestone doji shows, is that there's indecision in the market. Nothing more, nothing less.
However, when you find a gravestone doji form right on resistance at the end of a strong bullish trend, it starts to tell us a lot more about what's happening to price.
In this case, the indecision is in fact showing that the bulls are losing their power, right inside a zone that we expect sellers to be waiting to do business.
In this case, a gravestone doji, becomes an obvious sell signal.
Trading this GBP/JPY Gravestone Doji at Resistance
But if you read my @forexbrokr LeoFinance blog, you know that we don't ever take a higher time frame signal alone.
We use the higher time frame charts to ensure we're trading on the right side of the market, before zooming into an intraday chart to search for a short term zone to manage our risk around as an entry signal.
In the case of this GBP/JPY trade, the gravestone doji on the daily chart at resistance says we'd rather be playing from the short side, so we zoom into an intraday chart to find an area of short term support turned resistance that we can use as an entry.
Take a look at the GBP/JPY hourly chart below and you can see exactly what I'm talking about.
GBP/JPY Hourly:
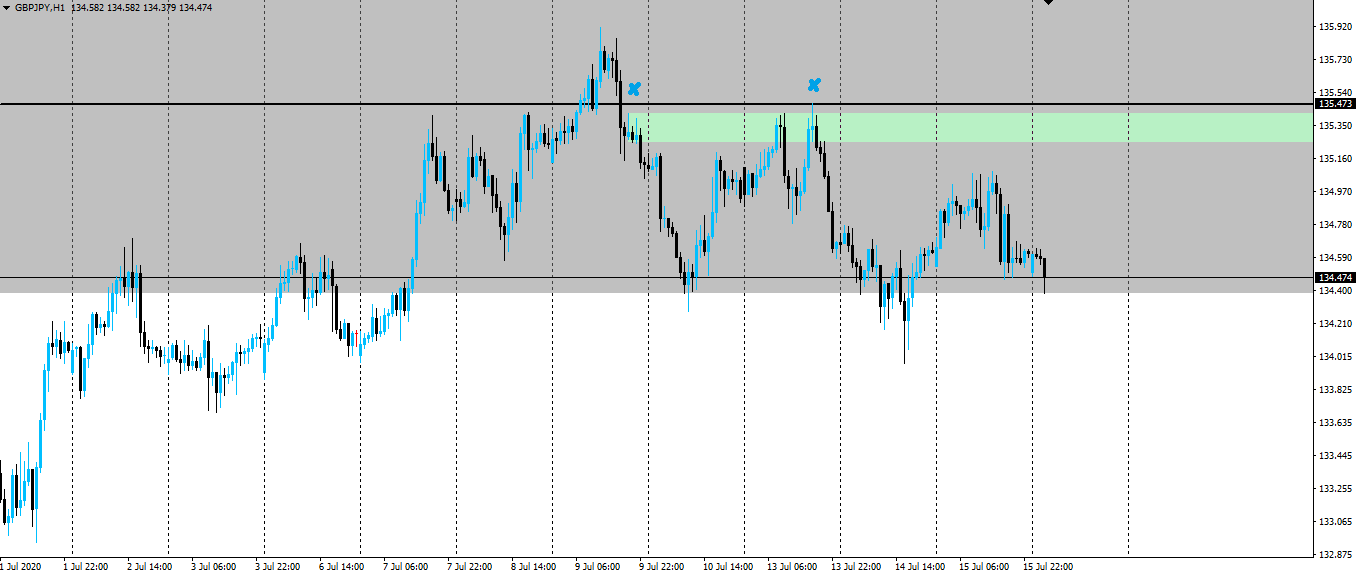
As higher time frame resistance held, price printed a level of short term support before breaking lower.
Price then retested this level as resistance as the higher time frame bears reloaded their shorts and continued the pair lower.
I post daily forex market analysis right here on LeoFinance, so if you're looking for more setups you can trade give me a follow and we'll go from there.
Best of probabilities to you,
Dane.
FOREX BROKR | Hive Blog
Higher time frame market analysis.
Posted Using LeoFinance
!BEER
Posted Using LeoFinance
View or trade
BEER.Hey @forexbrokr, here is a little bit of
BEERfrom @adamdabeast for you. Enjoy it!Learn how to earn FREE BEER each day by staking your
BEER.