Stack Funds says that the 90 day active supply is painting a similar picture to what happened pre-2017
Bitcoin is setting up in a similar fashion to what happened just prior to 2017 and the massive bull market that soon followed.
According to research by Stack Funds, the 90 day active supply numbers are doing a similar thing that they did prior to other bull market rallies.
An example of which can be seen here:
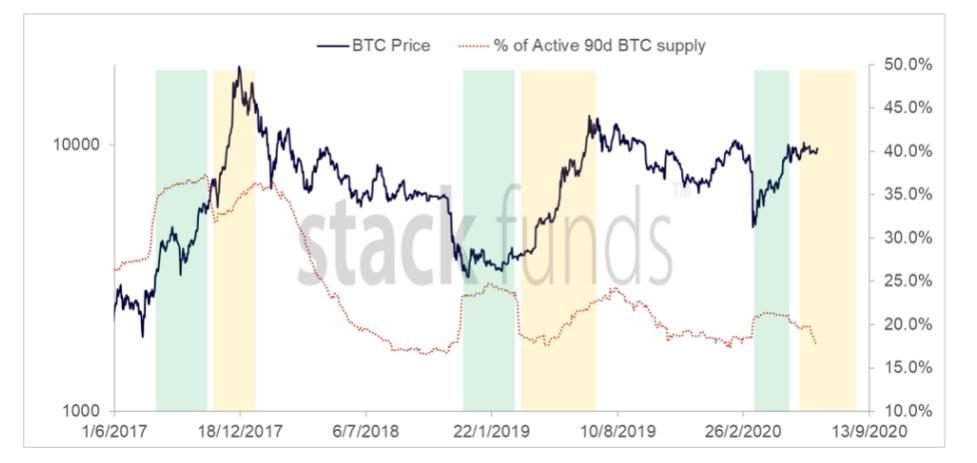
As you can see the activity levels shoot up sharply in the green zones and the price follows.
Then there has been a period of time where the activity levels taper off but the price takes off, which is depicted in the beige zones.
However, as you can see we are in the midst of a beige zone right now and the price isn't responding...
Why is that?
According to Stack Funds, it's just a matter of time...
"Prior to the 2017 and 2019 bull run, where Bitcoin hit $20,000 and $14,000 highs against the dollar, there was evidence of steep surges in the 90d % active supply (depicted in the green zones).”
"As statistics have shown, a potential run-up in Bitcoin prices can be expected, which has yet to materialize, leading us to believe that the preceding rise in Bitcoin prices could happen sooner rather than later.”
You can't argue with statistics and they are pointing to an impending bull market rally in bitcoin, it just hasn't started yet for whatever reason.
The funny thing about statistics like this is that they are right until one day they aren't anymore, which means you always need to take charts like these with a grain of salt.
That being said, it's really hard to argue with this chart...
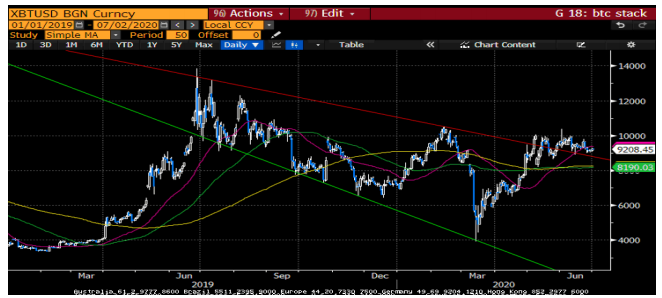
Based on the way they are drawing their lines here it looks like BTC has already broken out and is now sitting back on stupport.
From a trading perspective, this is exactly what you want to see.
A breakout, then some throwback to retest the breakout, and that's where you buy.
Time will tell if this is one of those, or if it's not and just a matter of where you draw your trend lines...
With all the other evidence in our favor, I'm betting on the former.
Stay informed my friends.
-Doc
Posted Using LeoFinance
Wow thats a great news !!! The market has been sleeping since 2017.
I wish it happens soon !!! Waiting so long for this pump to happen.
It should be happening soon if history is any indication.
Waiting desperately !!!