Welcome to the weekly edition of the LeoFinance stats report.
This is a weekly report covering March 28 through April 3, 2022.
If you want to learn a bit more about the LeoFinance ecosystem and dig into the numbers, this is the place to be.

The following topics will be covered:
- Issued LEO Tokens
- Top LEO Earners
- Rewards to HP delegators trough the leo.bounties program
- Daily stats on tokens staking
- Share of tokens staked
- Top Users that staked
- Unique number of LeoFInance users
- Posts/comments activities on the platform
- Posting from LeoFinance.io interface
- Price Chart
Issued LEO Tokens
Let’s take a look into token issuance and how it is distributed over time.
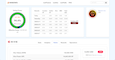
Below is a chart that represents the cumulative issued LEO tokens.
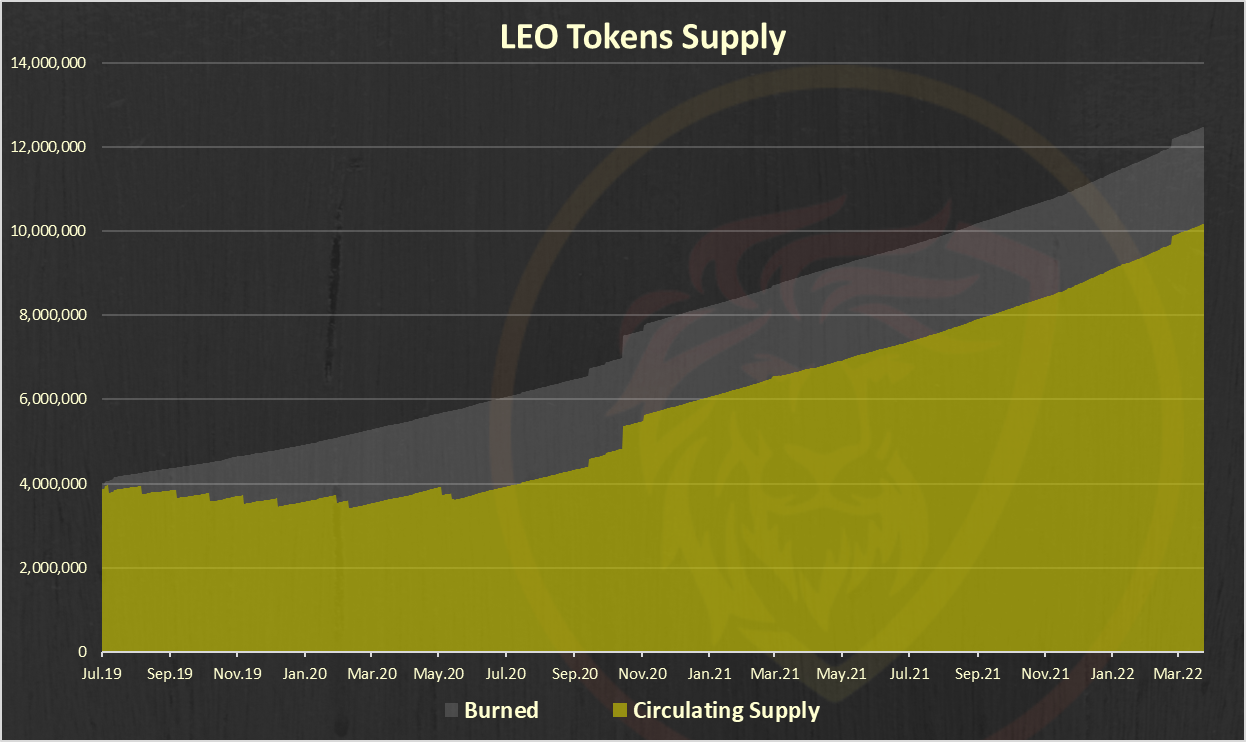
This chart is representing the total LEO supply, circulating supply and burned tokens.
A total of 12.48M issued LEO tokens, 2.3M burned, 10.8M circulating supply.
Next is the issued LEO tokens from last week. Here is the chart:
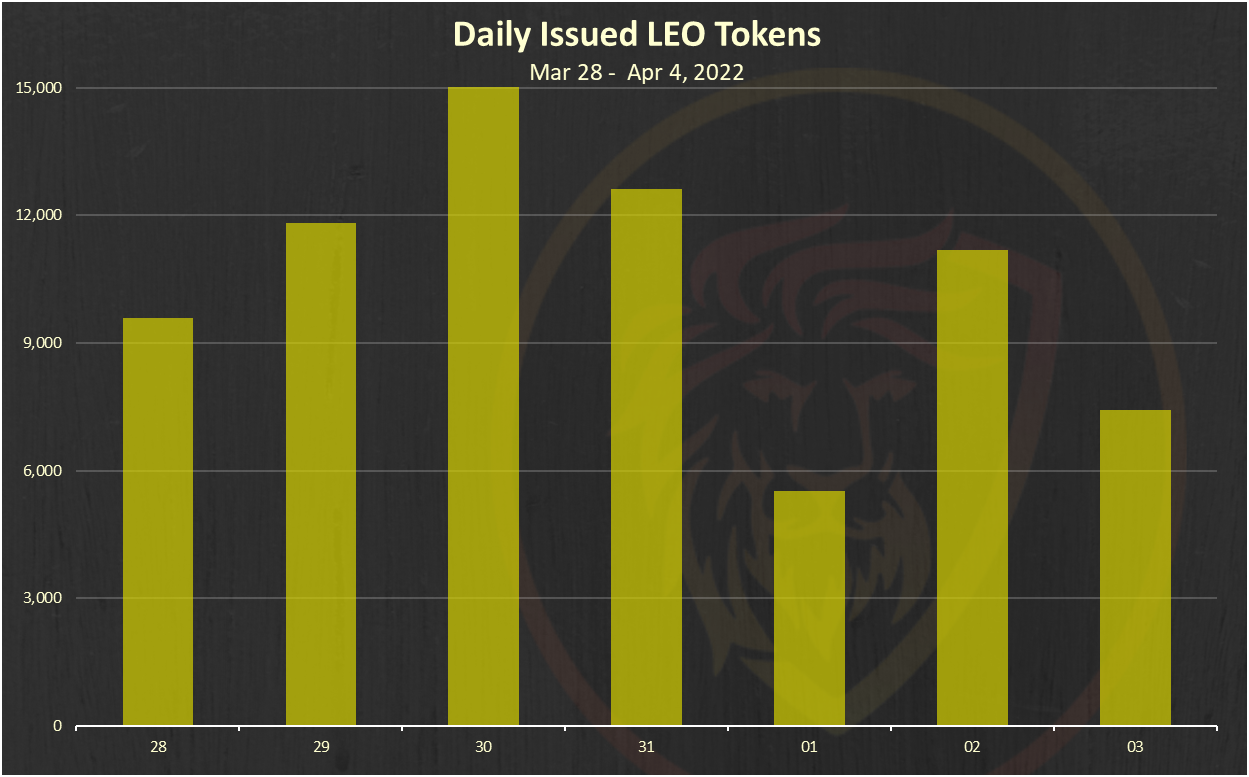
A total of 72k LEO were issued in the last week.
Let’s see how these tokens were distributed.
Below is the chart of the top 10 LEO earners this week.
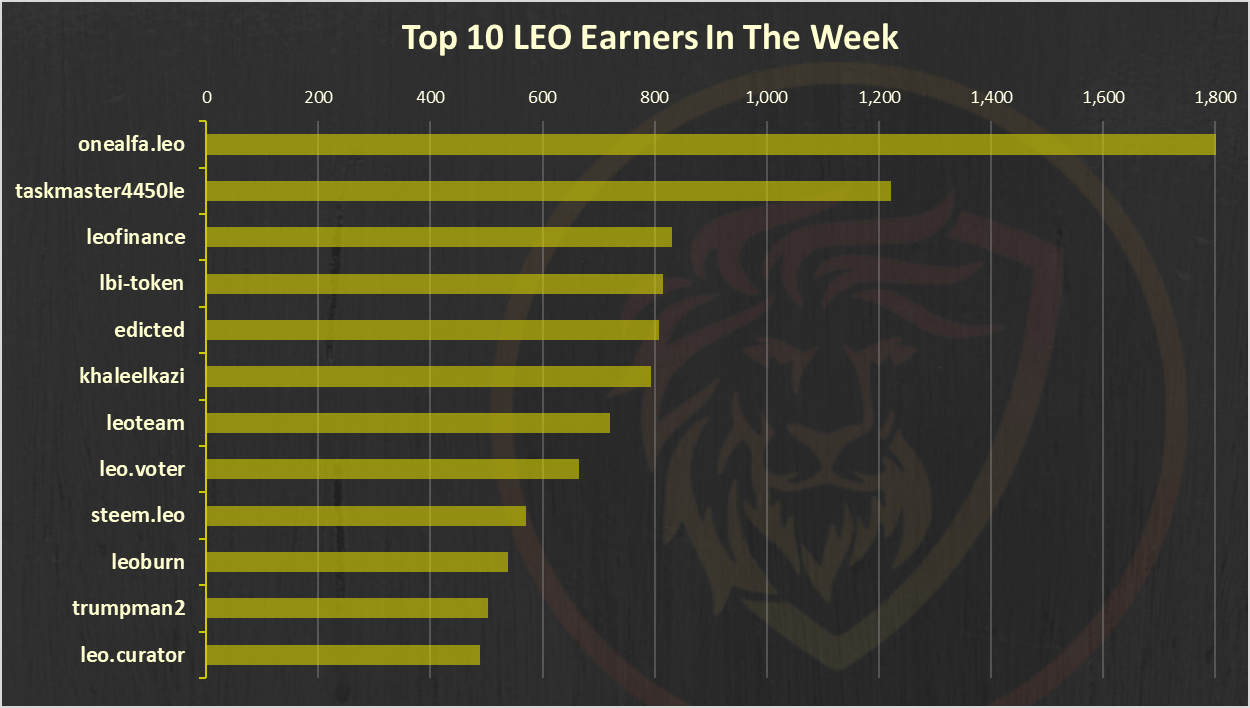
@onealfa is on the top followed by @taskmaster4450le.
Rewards from Bounties
Users who delegate their HP to the @leo.voter receive daily payouts in the form of LEO tokens at a rate of ~16% APR. Also, at time some other bounties are in place.
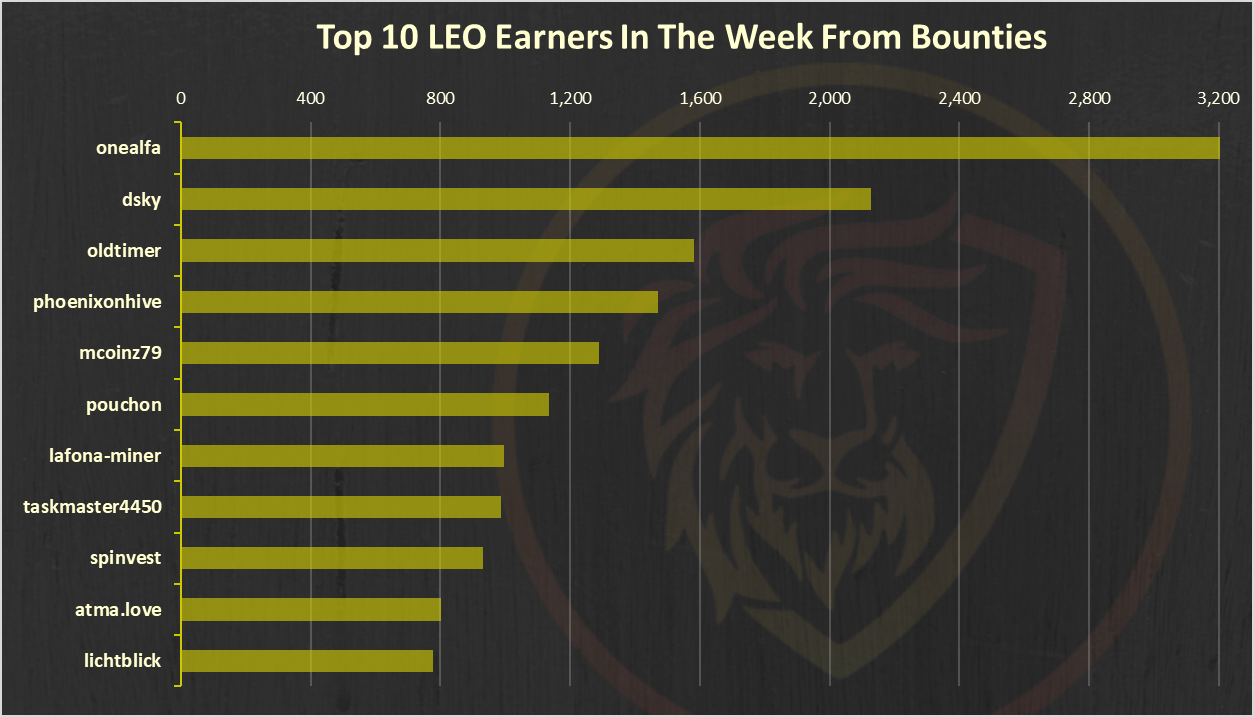
@onealfa is on the top here.
Staking LEO
Below is a chart that represents the monthly flow of staked and unstaked LEO tokens. A positive bar going up shows a day where more LEO was staked than unstaked.
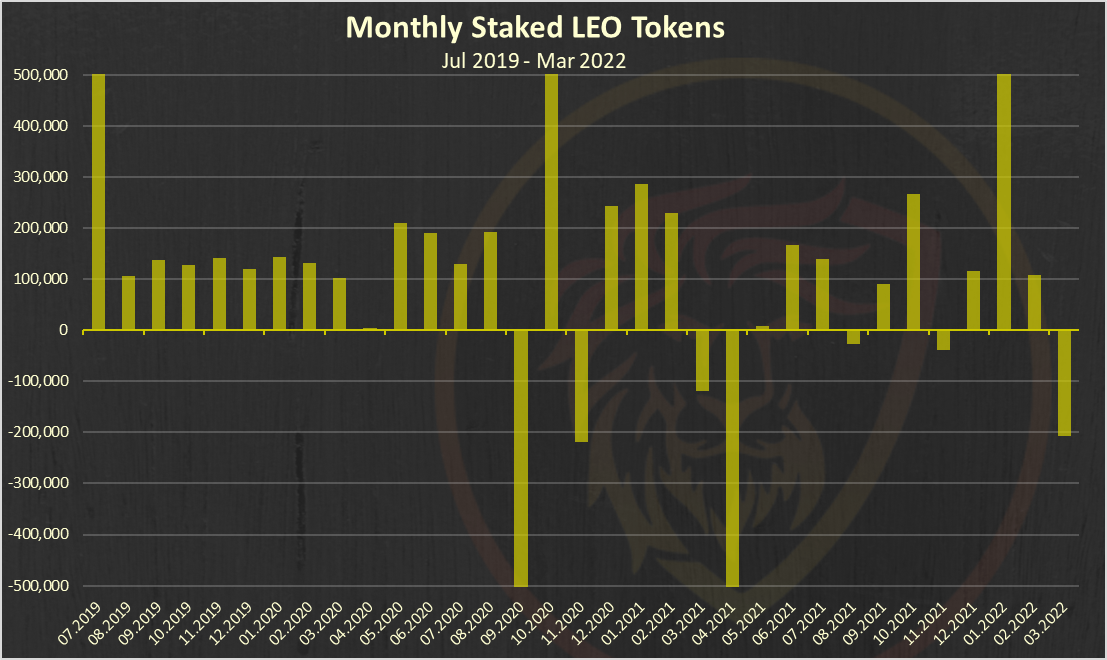
In the last period there is some unstaking happening in the last period due to the launch of the polycub platform. March is not over yet, and we have around -200k unstaked in the month.
Below is the chart of the top 10 users that staked LEO last week:
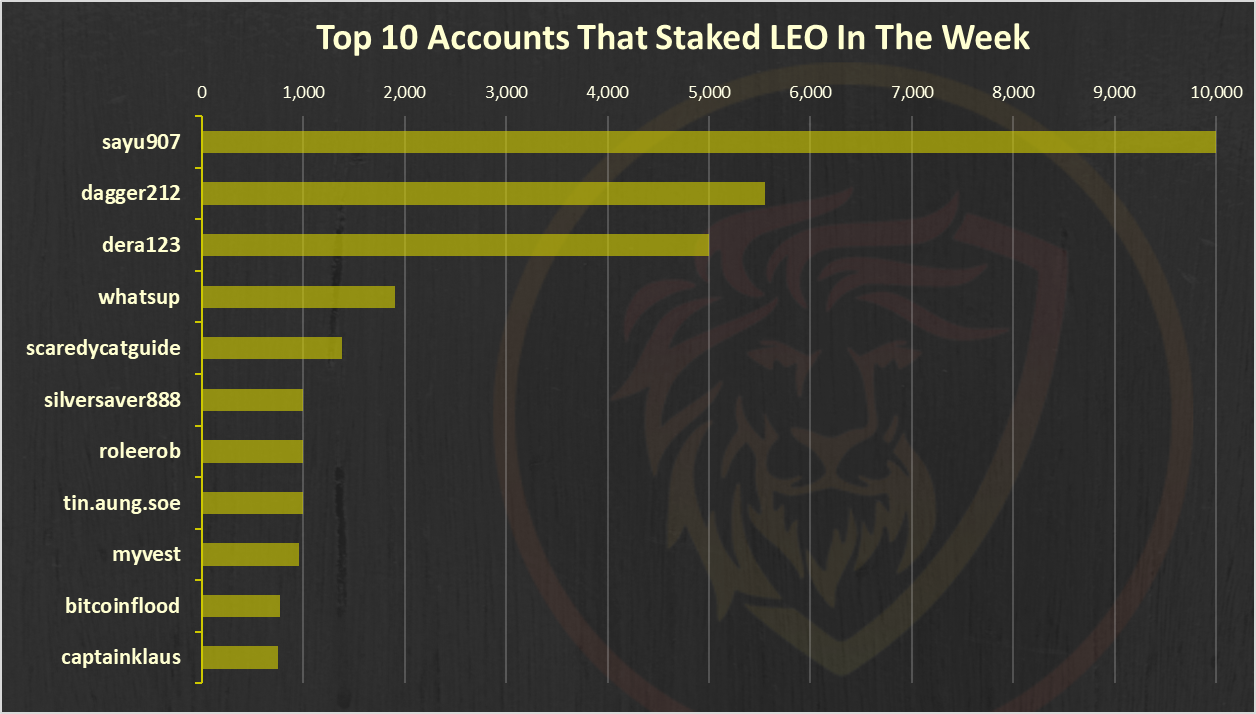
@sayu907 on the top here with more than 8k LEO staked.
The Overall Flow of the LEO Token Supply:
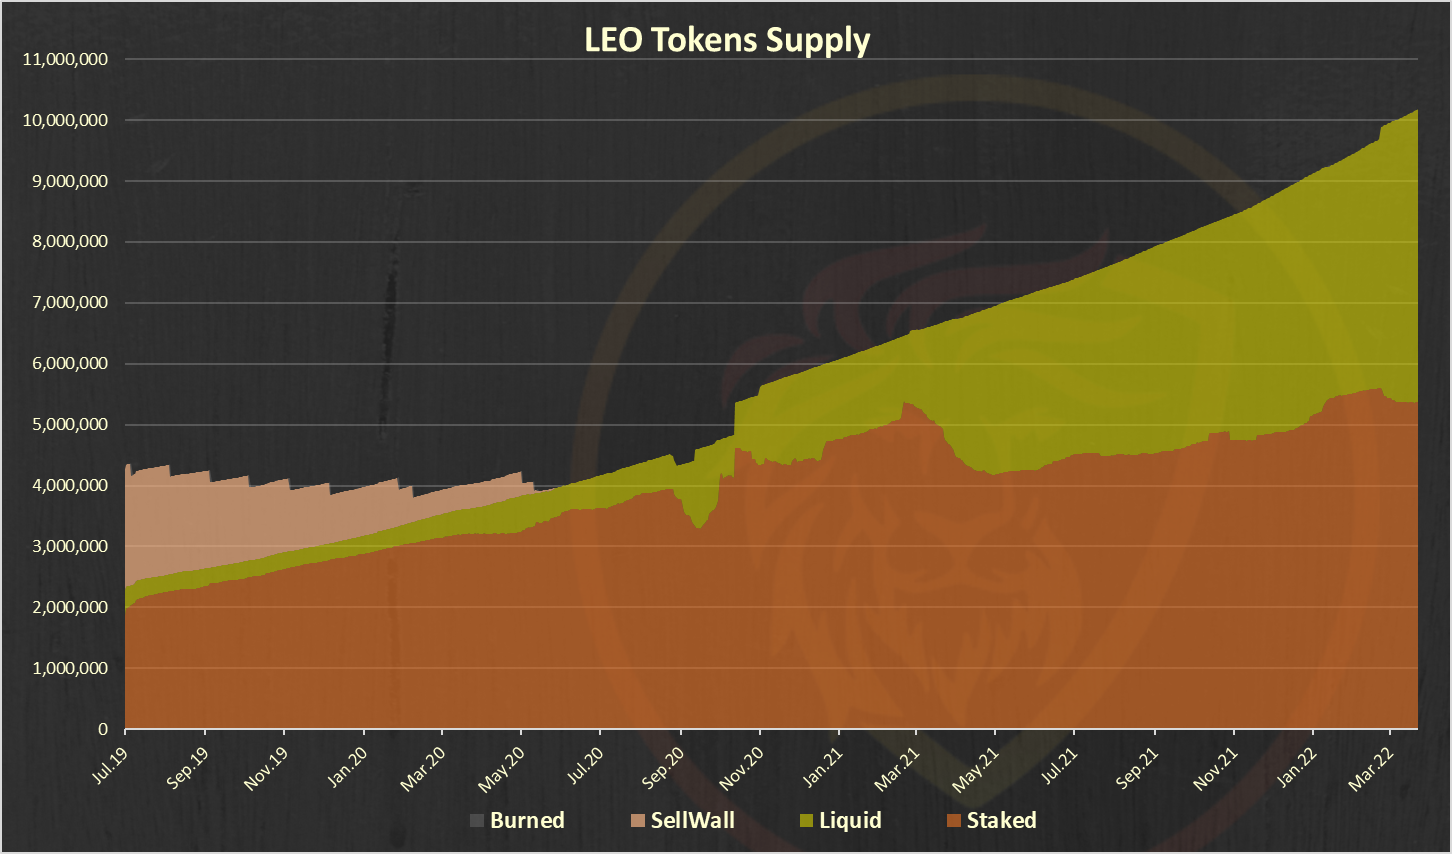
Note on the yellow, liquid category above. It includes the LEO in the liquidity pools on ETH and BSC as well. If we remove that, the liquidity will be much lower.
Below is a chart of the LEO tokens allocation.
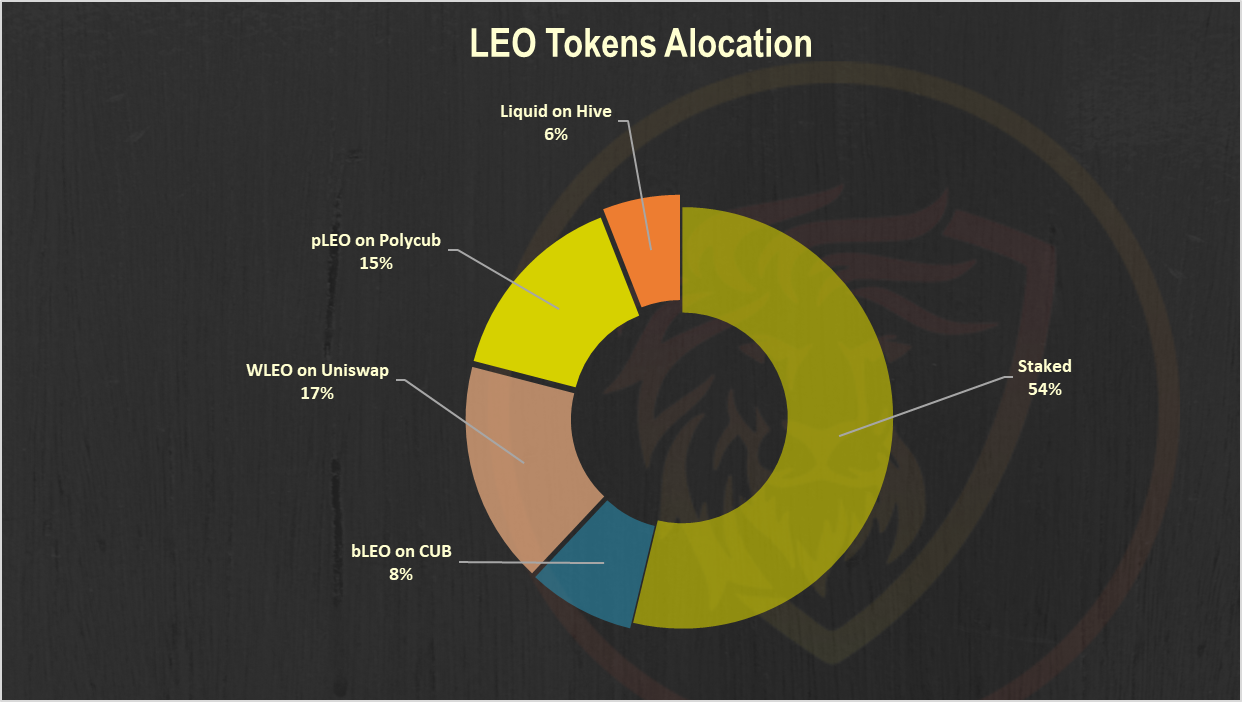
A 54% share staked. Prior to the launch of Polycub it was 60%. The Polycub pool now has the largest liquidity for LEO. Also, some amount of LEO was moved back to Cub on BSC.
LeoFinance Users
Below is a chart with the number of unique users that posted from the LeoFinance frontend.
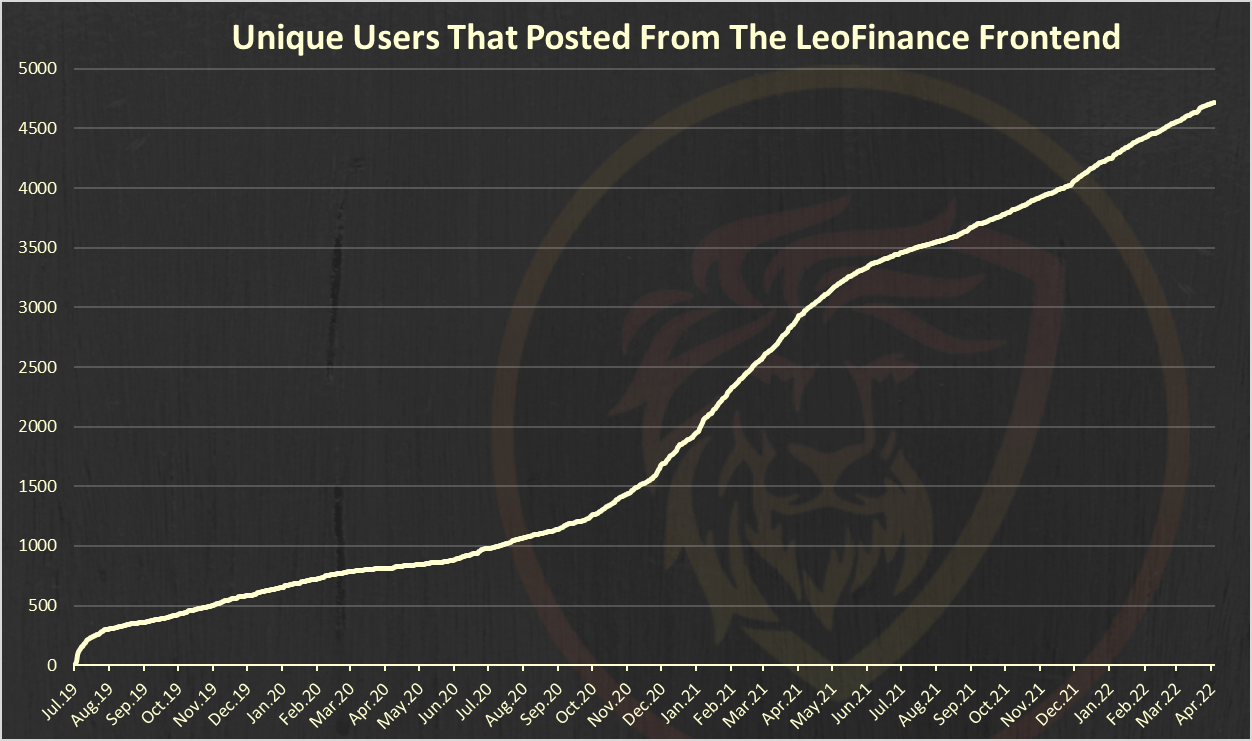
A 4.7k unique accounts have posted from the LeoFinance interface.
Monthly Active Users Posting and Commenting from LeoFInance [MAU]
Here is the chart for the monthly active users that posted from the leofinance.io interface.
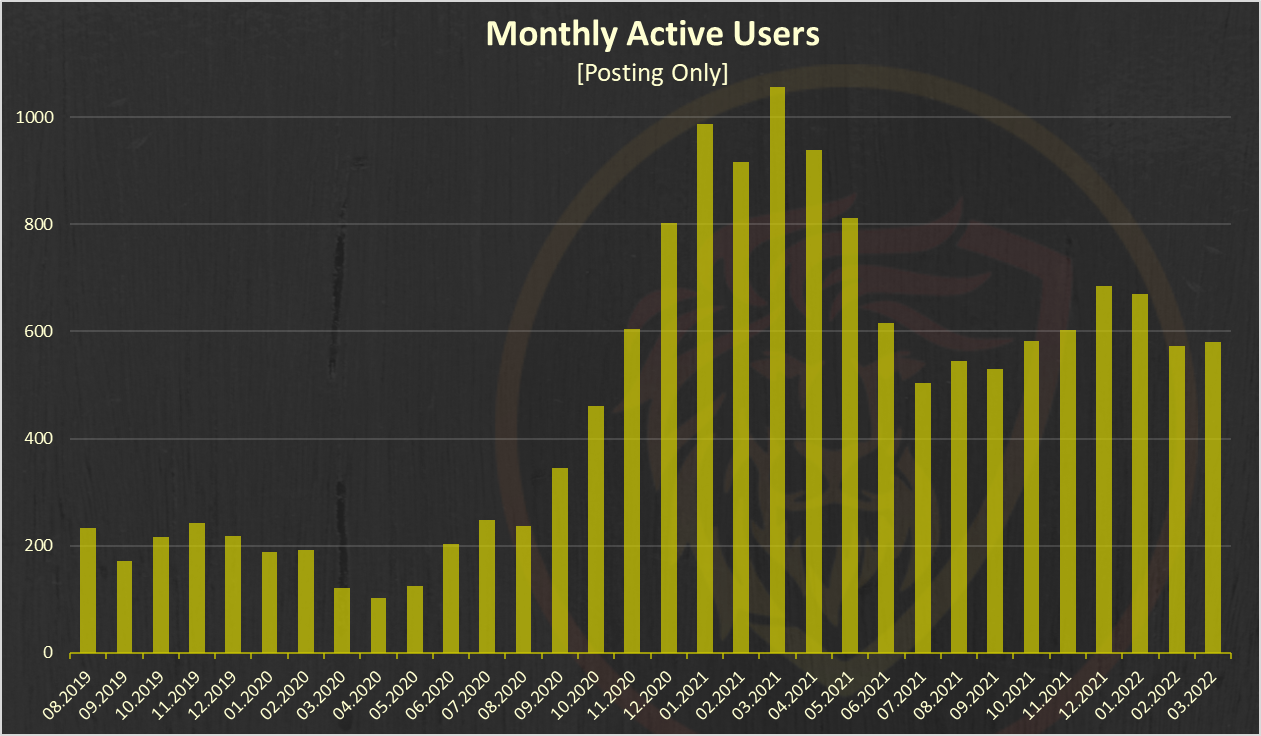
After a nice uptrend at the end of 2021, January and February have seen a small drop in the MAUs. March has some small increase in the numbers of MAUs.
Users That Commented Only
Here is the chart for users that commented from leofinance.io, but didn’t make a post in the month.
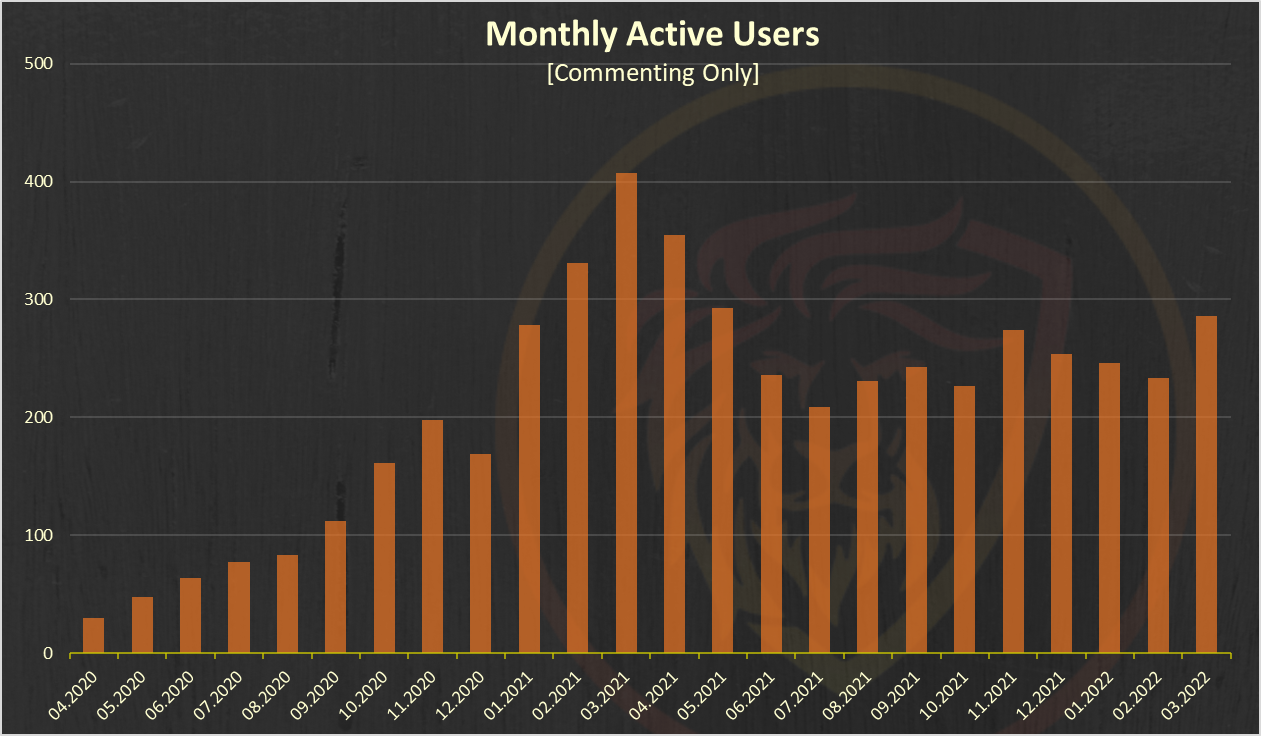
A similar trend as for the posts, with even higher growth in the last month. Almost 300 users have commented only from leofinance in March 2022, without making a post.
Activities on LeoFInance
Below is a chart of the LeoFinance activities with the numbers of posts from the LeoFinance interface and posts with the #leofinance tag.
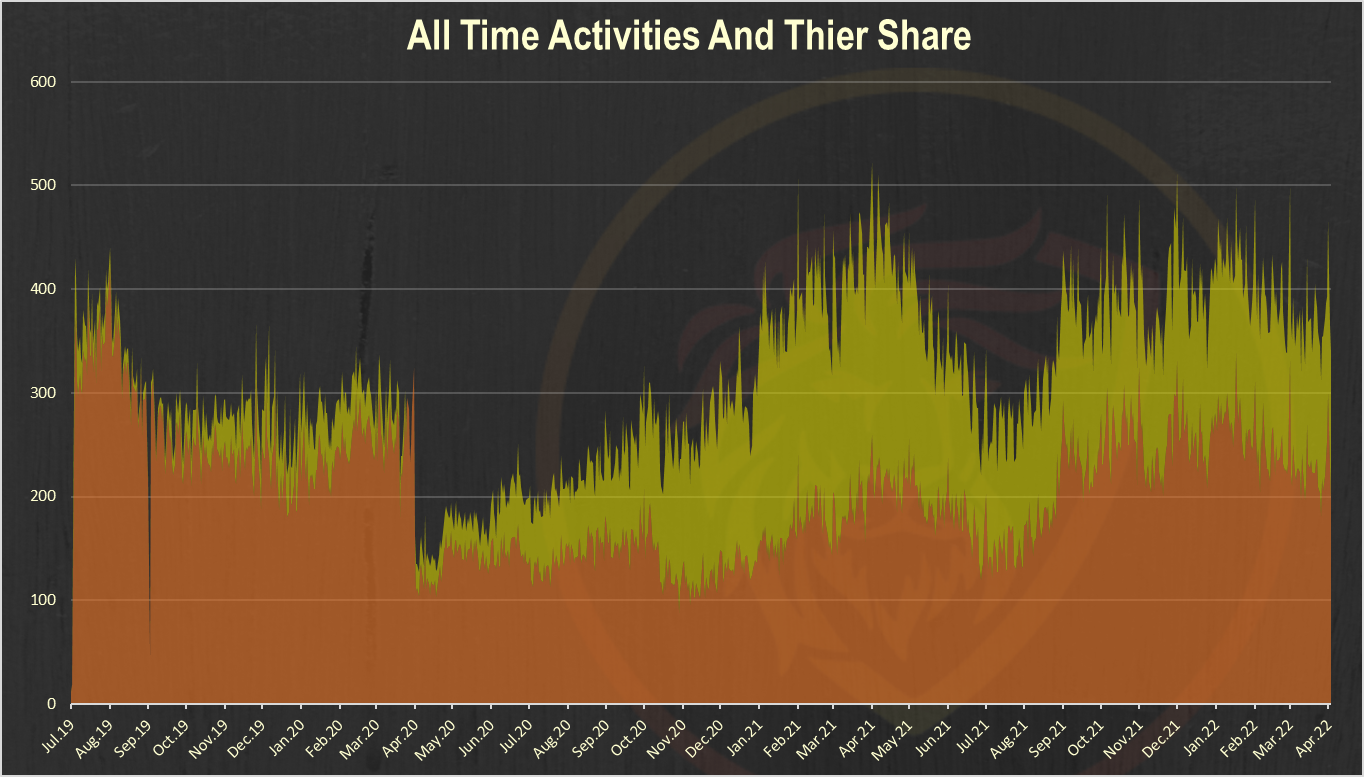
The yellow are posts from the leofinance interface and the orange posts from other hive frontends with the leofinance tag.
The number of daily posts has been around 150 in the last period.
LeoFinance has a 20% incentive for posting trough the native frontend. When users post from other frontends and just with the leofinance tag they have 20% less rewards.
Number of comments from LeoFinance.io
Here is the chart for the numbers of comments starting from April 2020.
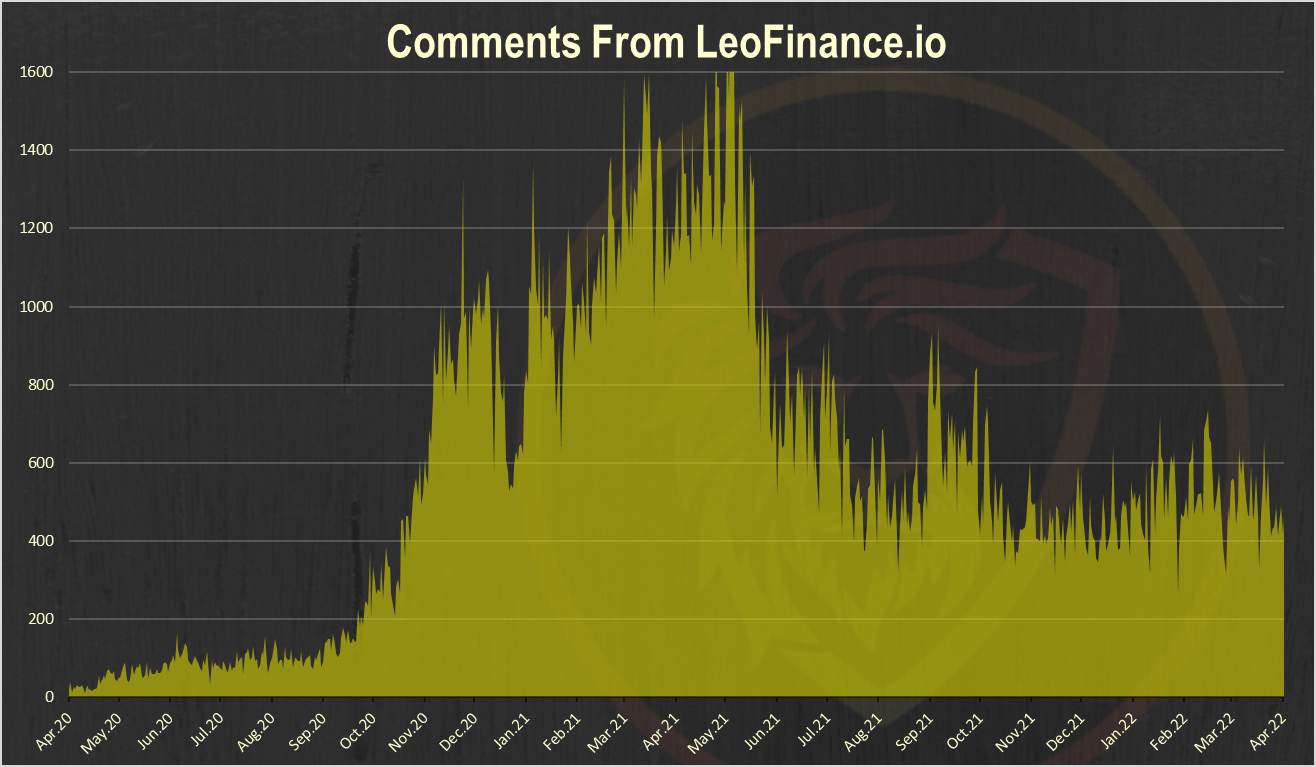
A total of **3.2k ** comments in the previous week.
Authors that commented the most
There is an initiative in the last period for engagement on the platform and some of the large stakeholders have been voting comments a lot.
Here are the top authors that commented the most.
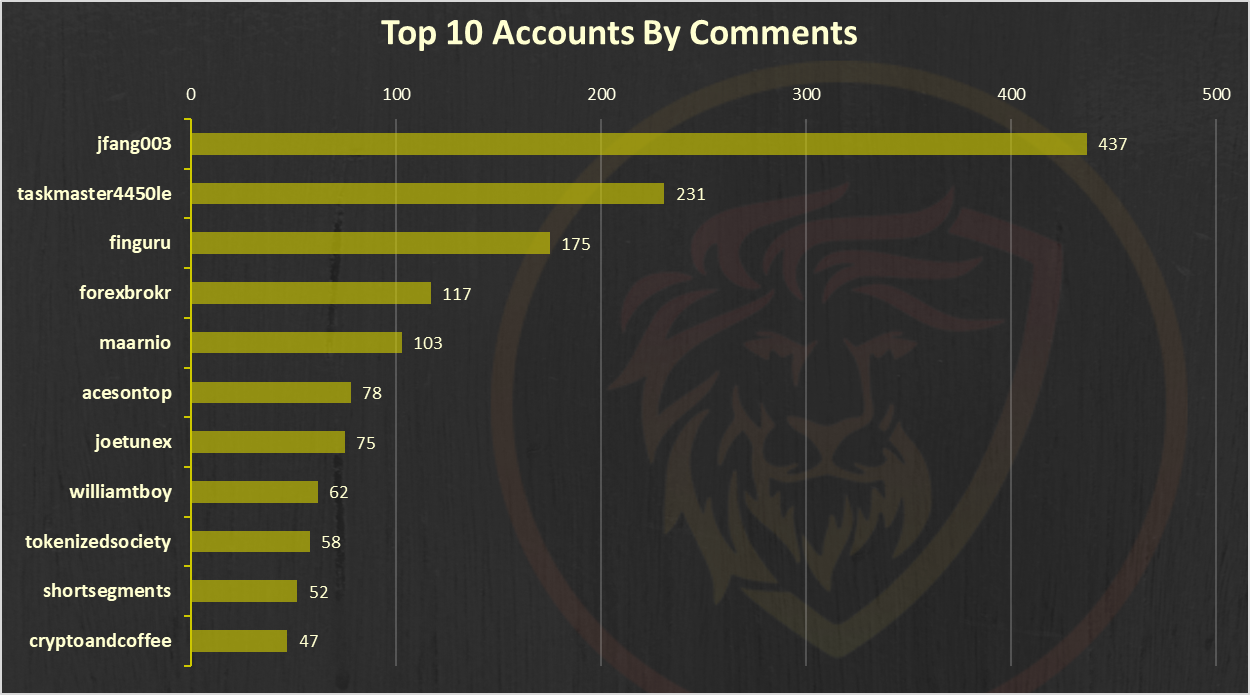
@jfang003 is on top followed by @taskmaster4450le.
Price
All time LEO price
It is interesting to look at the LEO token price, keeping in mind the crazy ride that HIVE had in the previous month.
Here is the price chart in dollar value with average price for better visibility.
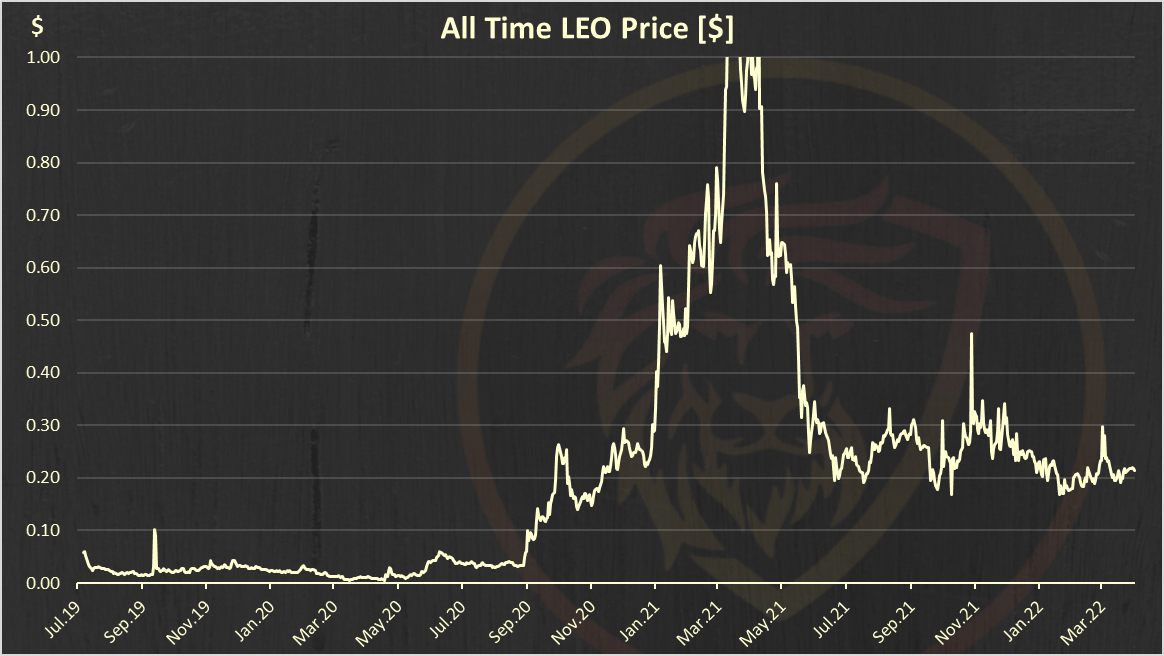
Have in mind the above is an average daily price.
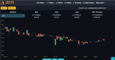
LEO price in the Last 30 days
Here is the price of LEO in the last 30 days also in dollar value:
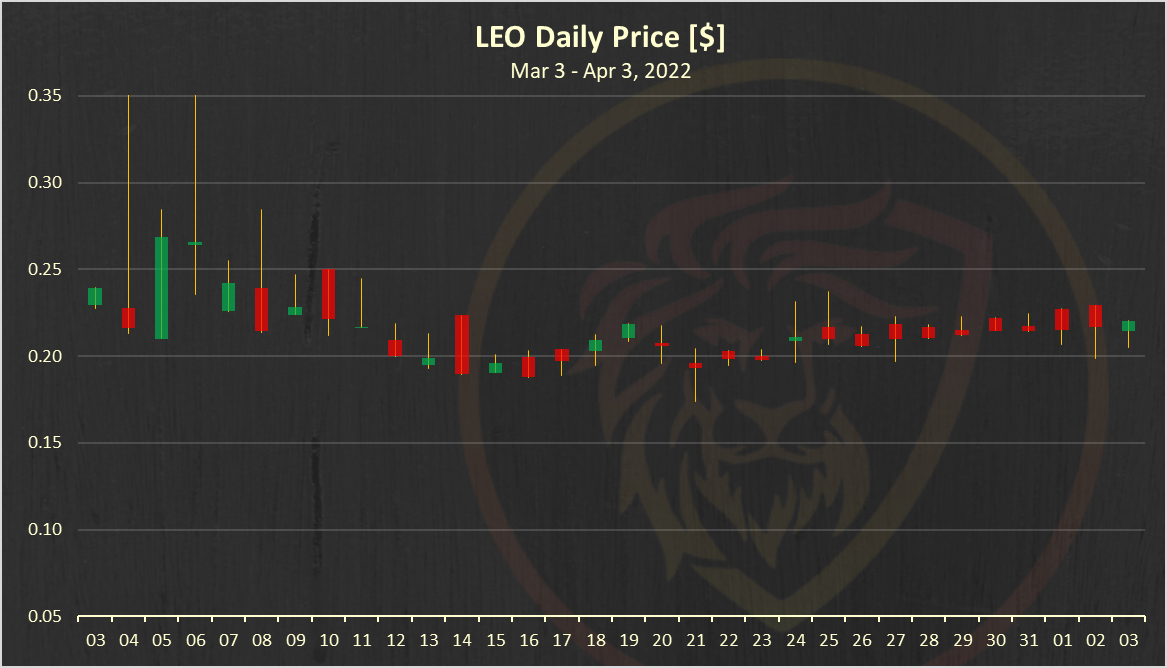
The price of LEO has been quite stable in the last weeks around $0.2.

| Track Hive Data | New Interface! | About Us |
|---|---|---|
| Hivestats | LeoFinance Beta | Learn More |
 |  |  |
| Trade Hive Tokens | Wrapped LEO | Hive Witness |
|---|---|---|
| LeoDex | Trade on Uniswap | Vote |
 |  |  |

Report by @dalz
Posted Using LeoFinance Beta
I just started posting on Leo from this week :)
Good luck!
Posted Using LeoFinance Beta