This report is a bit late. We have been overtaken by the Tron thing and now we are catching up 😊.
Welcome to the weekly edition of Steemleo stats. This is no.32 @leo.stats report.
If you want to know a bit more about the Steemleo platform and dig into the numbers, this is the place to be.

The following topics will be covered:
- Issued LEO Tokens
- Top LEO Earners
- Rewards to SP delegators trough the leo.bounties program
- Daily stats on tokens staking
- Share of tokens staked
- Top Users that staked
- Daily stats on tokens burned
- Number of Steemleo users
- Posts and comments activities on the platform
- Posting from Steemleo.com inteface
- Votes from the @leo.voter account
- Price Chart
Issued LEO Tokens
Let’s take a look into token distribution, inflation and how it is distributed.
Below is a chart that represents the cumulative issued LEO token.
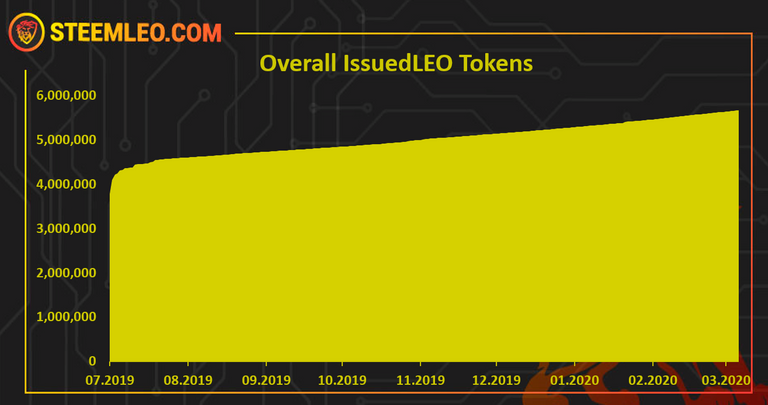
A total of 5.66 M issued LEO tokens.
We can notice that the LEO token doesn’t have a large inflation compared the base supply and its slowly increasing its supply. Note that burnings are not taken into consideration in this chart. That will be presented below.
Next the issued LEO tokens from last week. Here is the chart.
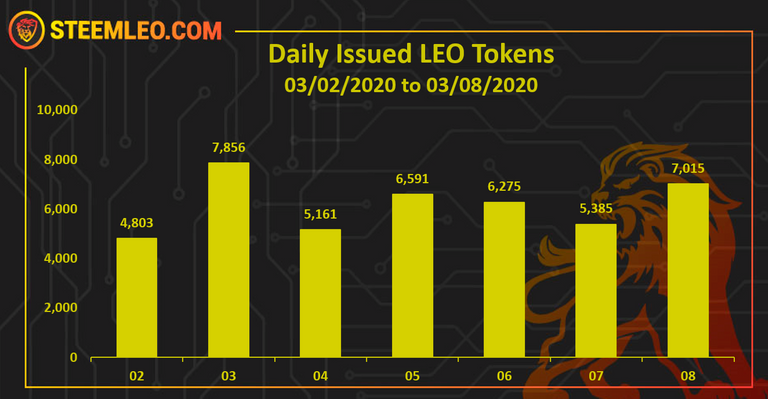
Issued tokens are claimed token that are put in circulation. They are different from the inflation.
Steem-Engine have implemented automatic claiming on the SE tokens and the chart is now more stable on the daily issued LEO tokens. On average 6.1k LEO tokens were issue daily in the last week with a total of 43,086 tokens issued.
Automatic daily claiming is overall a good thing that will prevent the lag between issued and claimed tokens going forward.
Let’s see how these tokens were distributed.
Below is the chart of the top 10 LEO earners in the week.
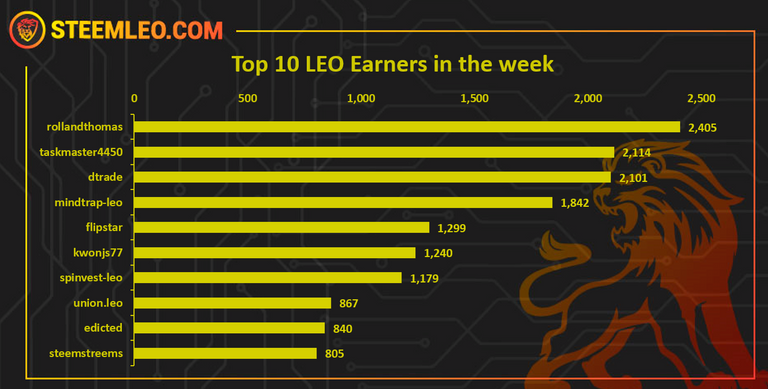
@rollandthomas is on the top with 2405 tokens earned, followed by @dtrade and @taskmaster4450.
Note: The @leo.bounties account is excluded from the list above. Bellow is a separated data on the tokens transferred from @leo.bounties to the delegators. A total of 6000 LEO tokens were issued to the @leo.bounties account in the last week.
Reward to SP delegators [Bounties]
The LEO platform has a reward mechanism for SP delegators to the @leo.voter account. Users who delegate their SP to the @leo.voter receive daily LEO tokens. The amount of LEO tokens depends on the LEO price.
Having more SP to the @leo.voter account provides incentive to users to use the platform and grow the userbase.
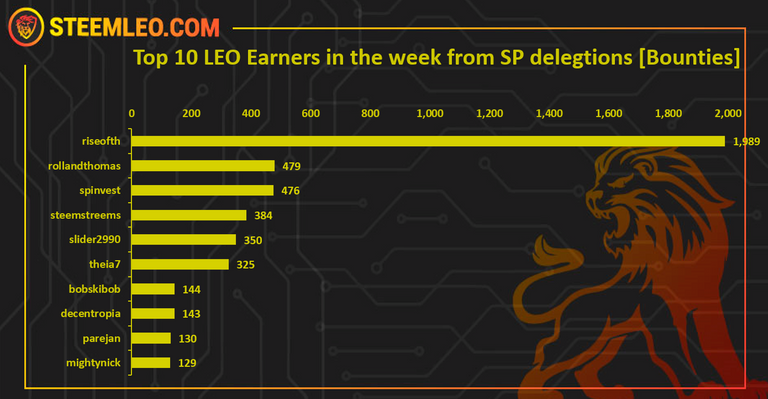
The account @riseohth is on the top of the list with 1989 LEO tokens rewarded, next is @rollandthomas followed by @spinvest.
A total of 6011 LEO was rewarded to SP delegators in the last week.
Staking LEO
Below is a chart that represents the daily movement of staking/unstaking of the LEO token.
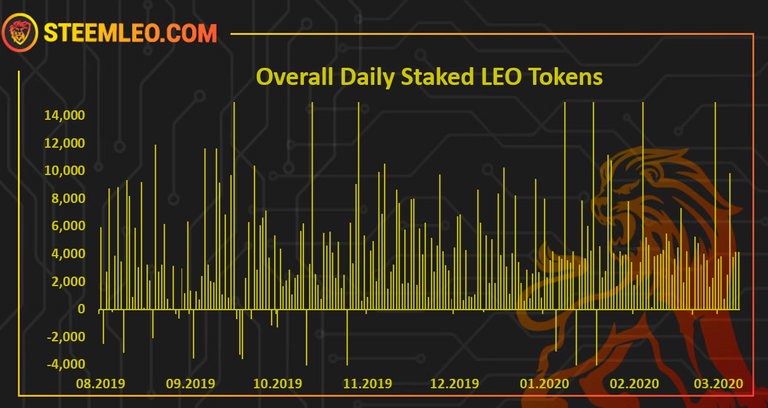
July 2019 is excluded from the chart for better visibility. Those are the first days and there are a lot of tokens staked.
The LEO token has a great statistics on tokens staked. This trends still continues.
The chart for the last week looks like this.
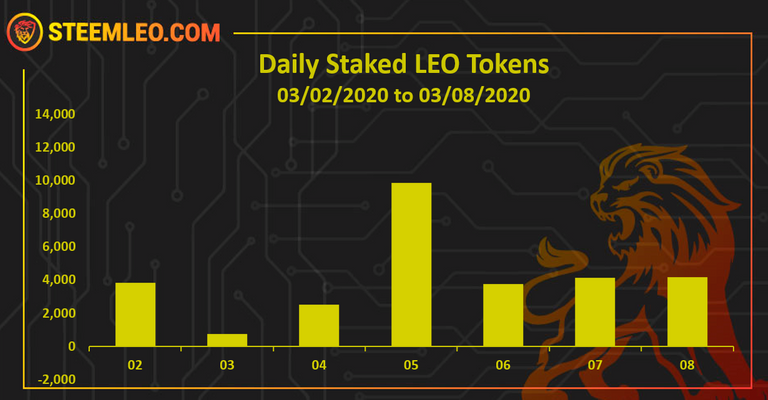
All of the days of the week with positive net staking.
Here is the table.
| Weekly Data | LEO |
|---|---|
| Staked | 37,173 |
| Unstaked | 8,080 |
| Diference | 29,093 |
A total of **29,093 ** more LEO tokens staked last week.
Below is the chart of the top 10 users that staked last week.
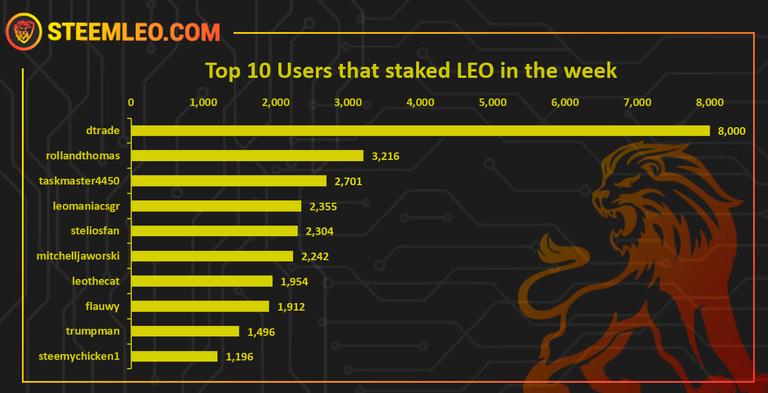
On the top is @dtrade with a massive 8000 LEO staked, followed by @rollandthomas and @taskmaster4450.
Here is the overall chart on LEO tokens supply.
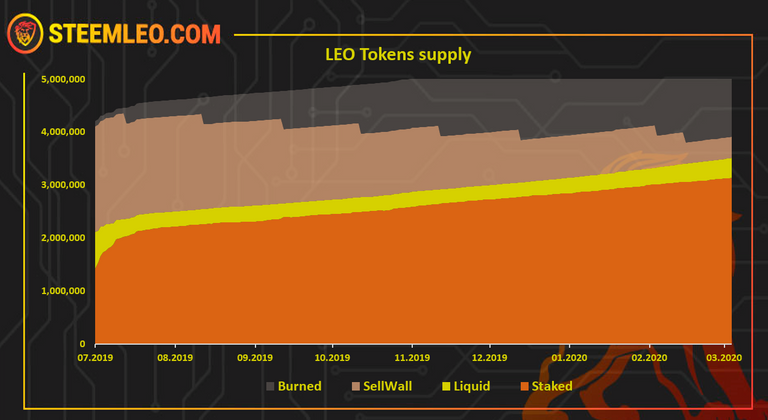
We can see that the staking is increasing over time, the liquid supply is going down. The burnt tokens also are taking a bigger share with the monthly burns from the sell wall, showing the big drops.
Below is a chart of the ratio staked/unstaked tokens, excluding the tokens reserved for burning (sell wall), at the moment with around 0.4 M tokens.
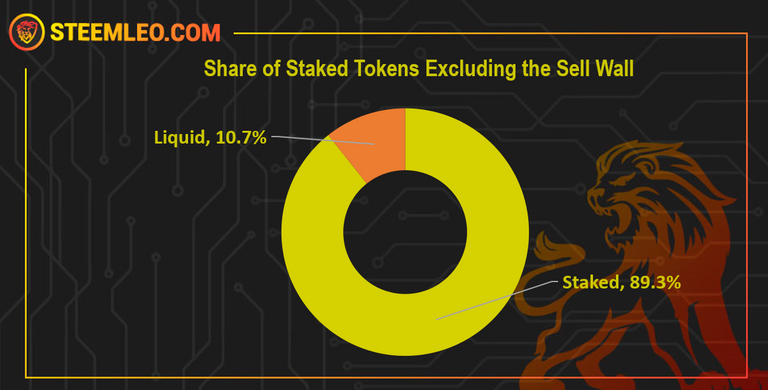
90% tokens staked!
The share of the staked LEO is a long time around the 90%, with a slight drop in the last week.
Out of the current supply 3.91 M tokens, 3.13 M are staked, 0.4 M are set to burn and 0,37 M are liquid.
Burning LEO
Burning tokens is an important metric as in a way it is a anti inflationary measure and it shows the use cases for the token or sinks. LEO is having huge regular monthly burn and also all the burns that comes out of its sinks.
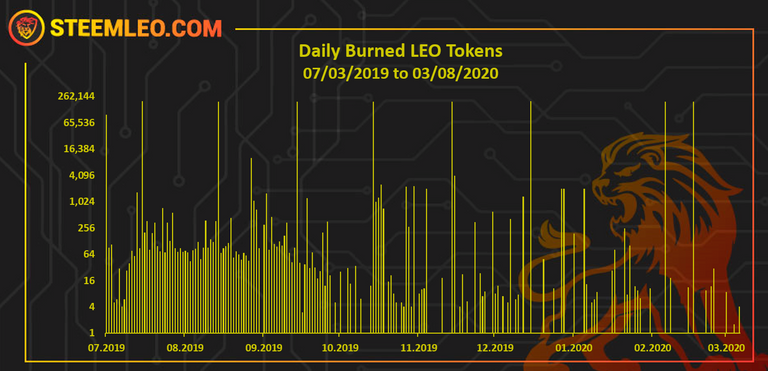
The vertical Y axis is on a logarithmic scale for better readability.
The large share of the burned tokens 1.7 M tokens is due to sell wall burn. The rest of 56k tokens are from the sinks for the LEO token.
The LEODEX is bringing more burns lately for the exchange listing fee of 2000 LEO per token.
The LEO shop will also make burns from the selling fees.
Steemleo Users
Below is a chart with the number of unique users that posted on Steemleo frontend.
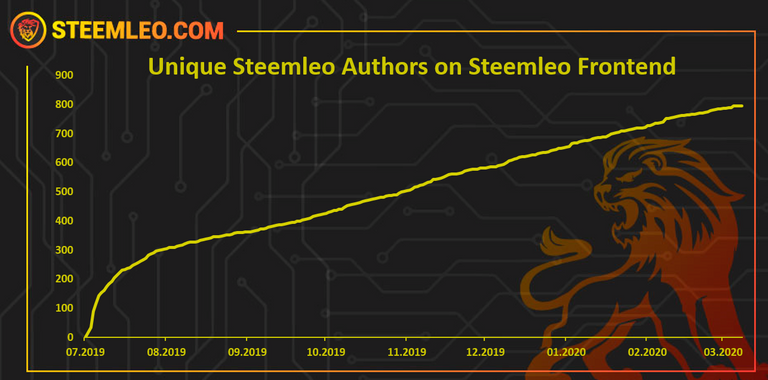
A total of 795 unique user have posted from the Steemleo frontend.
Activities on Steemleo
Below is a chart of the Steemleo activities, including posting and commenting from the Steemleo interface and posting and commenting with the Steemleo tag.
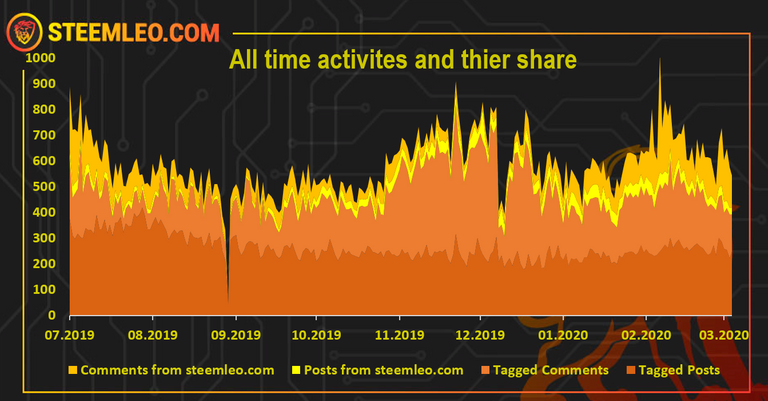
Lately the number of comments made from Steemleo, seems to be increasing as well.
In the last period Steemleo is trying to incentivize users to post from the Steemleo interface rewarding authors who use the interface with vote from the @leo.voter.
Here is the chart only for posts from steemleo.com interface.
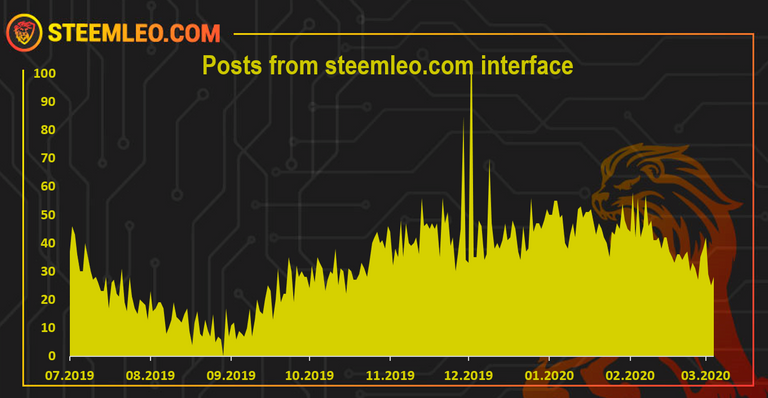
There has been an increase in the number of daily users that posted from the web and in the last month or two this number is around 30 to 40 post per day from the native Steemleo interface.
Using the steemleo frontend is important for the project and the users are encouraged to do so.
Weekly Activities
This data is also showing the activities coming only from the Steemleo native interface.
Data for each day of the week was collected and presented on this graph.
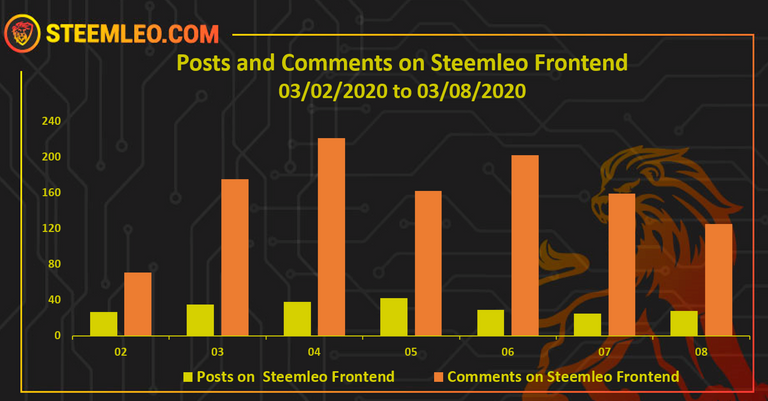
These are all the posts and comments posted from the Steemleo frontend.
The total number of posts on Steemleo in the week is 224 and 1115 comments.
Votes from @leo.voter
The @leo.voter account is being converted from a bot to a rewarding accounts to users who use the Steemleo.com interface. Here is the chart.
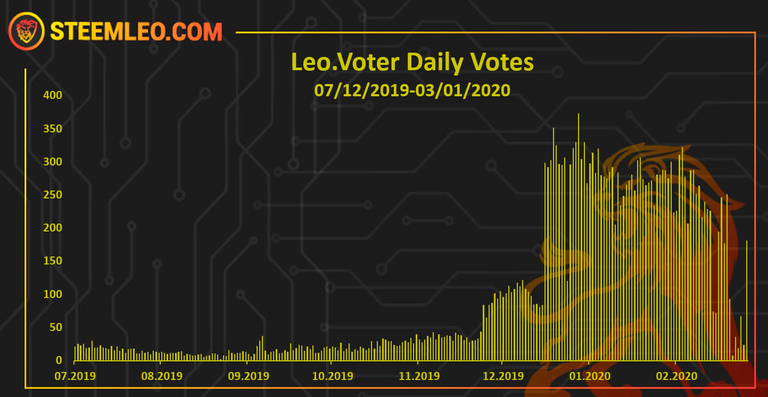
We can see that there is increase in the voting since now it’s being used to reward users who use the Steemleo interface.
More than 22k STEEM overall rewarded to authors from the leo.voter till this date.
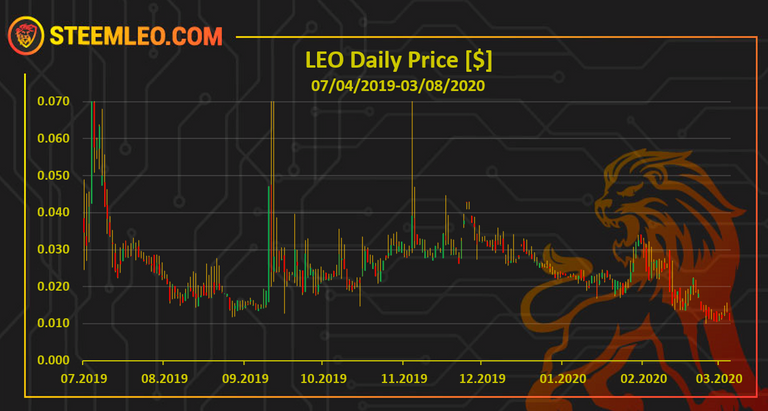
Price
All time LEO price
Here is the price chart in dollar value with proper daily candles.
Last 30 days LEO price
Here is the price in the last 30 days also in dollar value.
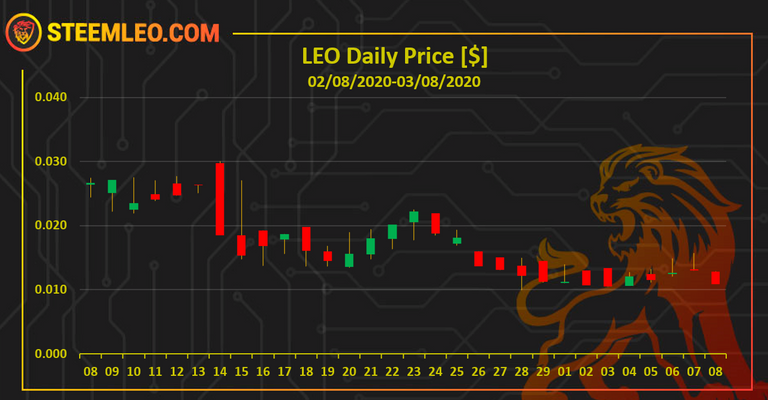
Following the TRON drama a lot of the SE tokens are having a dip in the price.
#steemleo - A Next-Generation Community for Investors
Report by @dalz
Posted via Steemleo
Always look forward to your stats, constantly on the look out for great content, so I can give upvotes in an effort to encourage people to curate more.
Posted via Steemleo
Thanks for another terrific report.
As I say each week, the progress is exciting. We are seeing consistent growth in most of the categories cited. While nothing is jumping out as massive growth, a lot of times consistency wins the game.
Each week, more tokens staked which only enhances the voting power of all involved. This will help to attract newer users.
Posted via Steemleo
Yes the fundamentals, like staking etc, are all there ... just the price seems to be lacking :)
I believe with time and effort everything will come in place!