Introduction
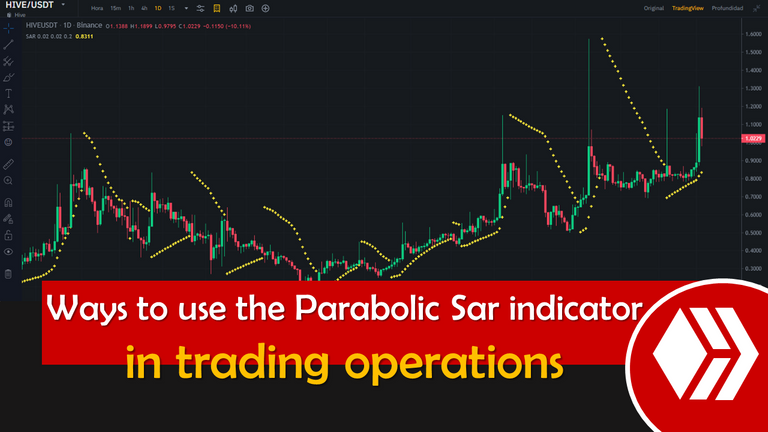
Following the guidelines discussed in the previous entry on the Parabolic Sar indicator, it is worth mentioning that there are two basic principles when correctly interpreting this important technical indicator, and that is that when the consecutive points are located below the price this implies an uptrend, contrary occurs when the points are located above the price, i.e. in that case it is interpreted as a downtrend.
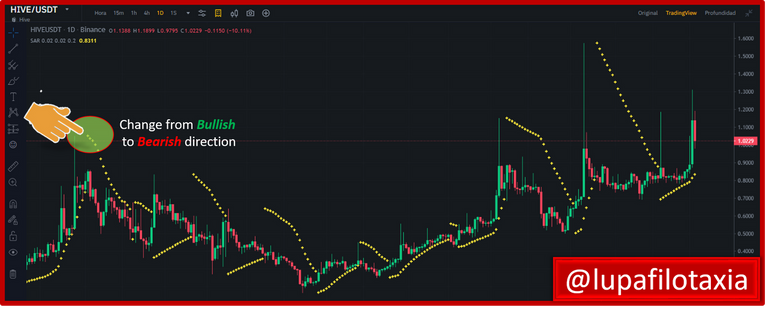
Change from bullish to bearish direction
As mentioned in the previous paragraph, it is worth noting that if the dots turn around, i.e. if they turn from below to above at a point where the price action becomes weak, i.e. if the price starts to lose strength in the upward momentum, from a technical point of view, the Parabolic Sar indicator showing dots above the price would reveal a high probability that a potential change in the direction of the price from bullish to bearish is taking place.
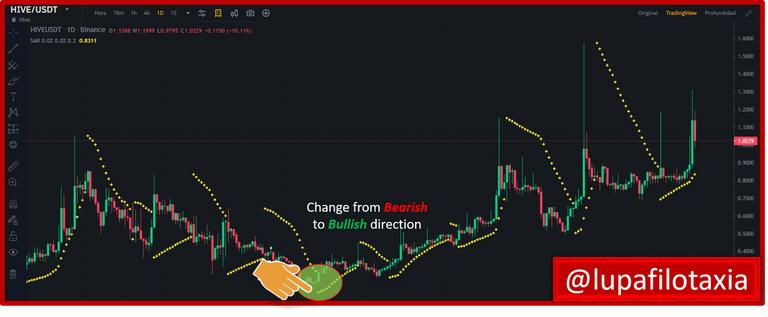
Change from bearish to bullish direction
The above applies in the opposite way in changes from bearish to bullish direction, as long as the dots turn from up to down at a point where the price action starts to gain upward strength, i.e. the Parabolic Sar indicator showing dots below the price would be revealing a high probability that a potential change in price direction from bearish to bullish is taking place..
Confirmation of market release
If after a series of upward impulses, the Parabolic Sar indicator points turn around, i.e. if they turn from below to above at a point where the price action in a given currency becomes weak, this technical reading serves as a guide on the chart and as a signal to open a SELL trade
Confirmation of market entry
Now, if in a given cryptocurrency, or any other financial instrument following a constant depreciation and clear downtrend, if the points of the Parabolic Sar indicator flip from up to down at a point where the price action starts to take strength to the upside, this technical reading serves as a guide on the chart and as a signal to open a BUY trade
Confirmation or change in trend
As I mentioned in the preceding paragraphs, the Parabolic SAR serves as a technical indicator to confirm market trends, and also to determine or rather to project when a trend will end, or when it is closer to ending.

SOURCES CONSULTED
➊ Casey Murphy Introduction to the Parabolic SAR. Link
OBSERVATION:
The cover image was designed by the author: @lupafilotaxia, incorporating image: Screenshot from Binance portal