
What Market Phase are we entering into has been the introductory question for our last appointments. Are we going to listen to the Bulls or the Bears? Are we going to see a Bull Market or a Bear Market?
Welcome to Surfing the Market, we are already at our 56th appointment and I hope that with these easy tech analysis we have helped you in some forms, even just to evaluate different market perspectives.
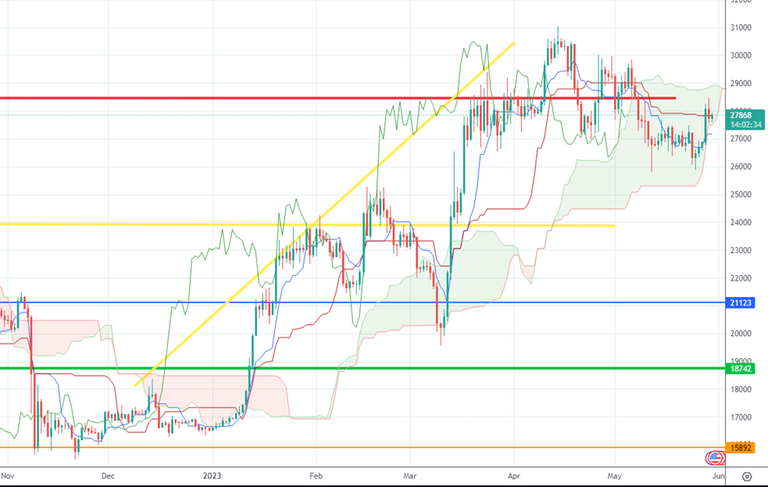
Let’s start from our usual weekly perspective
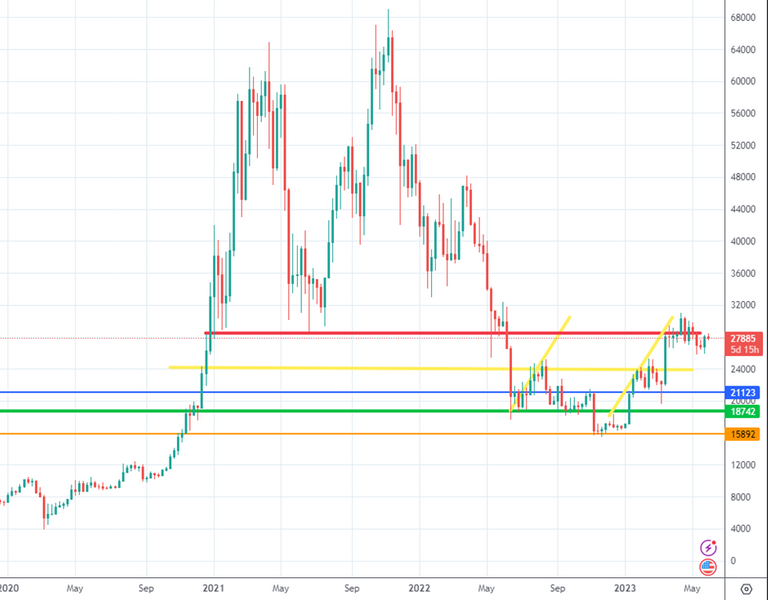
Source: Tradingview - Weekly Chart
From the last week the price had an impulse that made it reaching again the red line, acting as a resistance at 28000$ resistance.
The uncertainty that we were expecting from the news release on USA debt, ended in an extension of the debt limit granted to the US government.
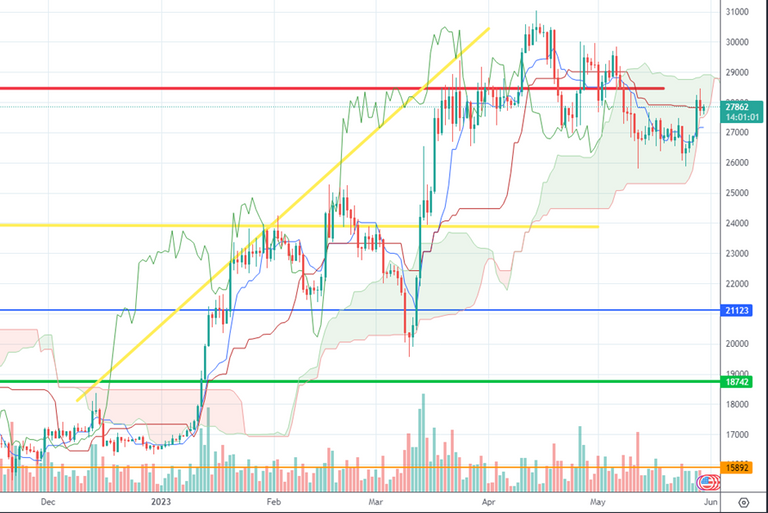
What do I expect from a daily perspective?
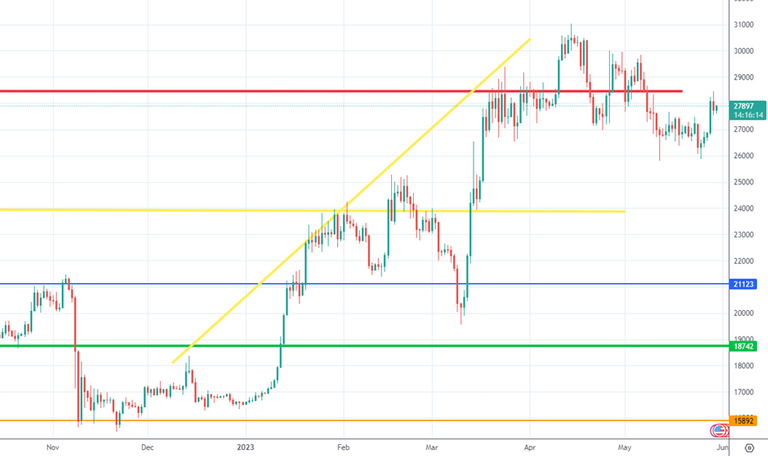
Source: Tradingview - Daily Chart
Price reached again the red line, being momentarily rejected. I think that we may see a long in the short term, breaking upwards the red line, but at first we need to expect the opening of the US stock market today (in a few hours).
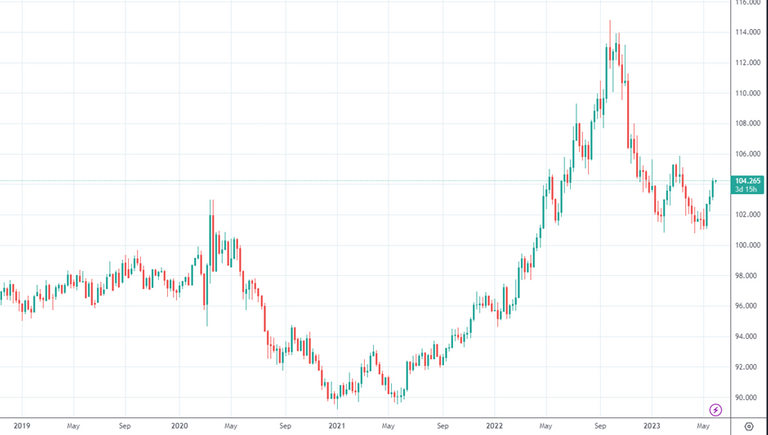
Source: Tradingview - Strength Dollar Index
DXY had a strong bounce upwards, and it’s continuing the movement above 104 points. This trend can be due to the prediction and actuation of the USA increased debt limit, confirming that banks are not allowing USA to default BUT for how long are they going to extend it? Are they going to simply print more money?
The price has tested the 50MA and got rejected but the current impulse may go to test it again. 28000$ level will be a strong and important price range as it is covered by both the red level and the 50MA.
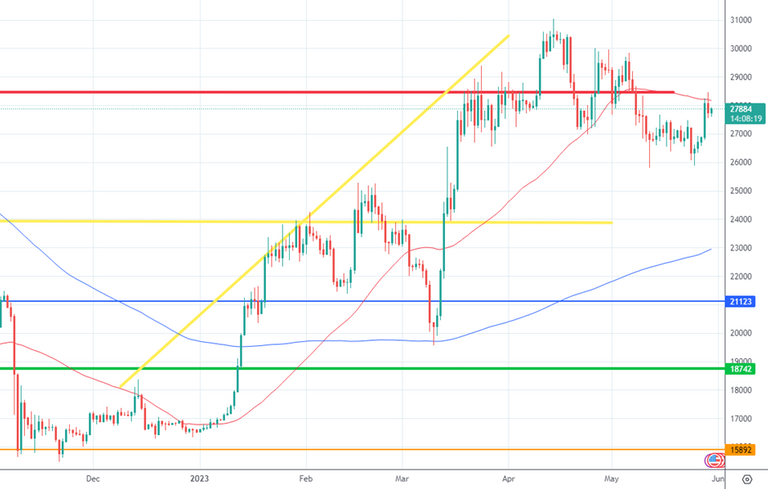
Source: Tradingview - Daily Chart
The price reacted to the bottom level of the Clouds and is now oriented towards the upper level. I the coming days there will be an inversion of the clouds and a thin area. In such moment a strong impulse may happen to the price and statistically at the current scenario, the more likely is an upward movement.
Source: Tradingview - Daily Chart
And now, what from a Volume perspective?
Source: Tradingview - Daily Chart
Volumes are showing consistency with no concentration of market offer/demand meaning that institutionals are waiting to create the perfect storm with potentially a bull-trap as many indicators are bullish.
What to observe particularly?
I expect further upward movement of the price but I would not be too much confident of the indicators as some late take profits make occur causing massive liquidation. I am locally long but if the price will reach again the red line, I would put the Stop in profit, closing a part of the position and increasing it while breaking strongly the red line level.
Stay tuned and be sure to follow to get noticed when my contents come out.

Promotional suggestion
One more thing: if you really do not care of technical analysis or you do not like spending time onto the markets, make sure to give a look to the Zignaly platform, an Official Binance Broker Partner with huge volumes under management. They offer great services of Profit Sharing Trading, where you copy other Professional traders, sharing the profit with them! Make sure to give a look!
If you are interested in getting noticed in advanced on the release of our partner’s indicators, leave a comment here so we understand if there is some interest!
None of what I write can represent a financial advice in any form. So Do your own research before taking any kind of action.
Ciao Mike, escludi totalmente che Bitcoin possa tornare a 10.000$ prima del 2025? Nessun consiglio finanziario, solo la tua opininone
È molto improbabile secondo me. Ma FTX e TERRA LUNA insegnano che l'imprevedibile può sempre accadere
Ok, comunque anche secondo me inizia ad essere improbabile, ma aspetterei ancora qualche mese per escludere interamente questo scenario, cioè il ritorno di BTC a 10.000$