I stumbled on a very interesting chart from ChartsBTC, the main focus here is the Price of BTC on this date.
Things as simple as price action based on date performance can be overlooked, but it's also a nice refresher for even the most experienced trader or investor.
Obviously if we took this chart just a month ago the $10,890 could be at $12,000. I think perhaps a better chart then looking at it day-by-day would be an average price!
Let's dive into the price action since 8 years ago!
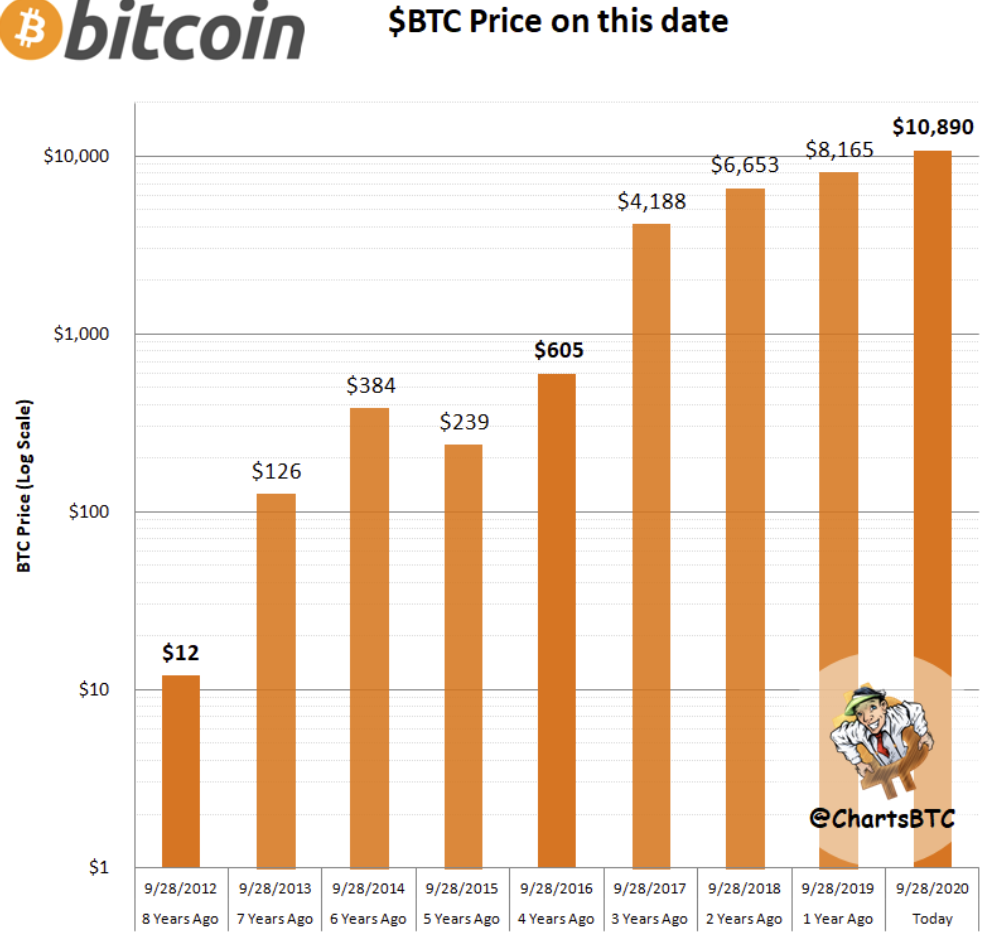
Throughout the years we can see the massive price gains, also we can see things from a bull/bear periods.
What is interesting is that only 1 year did BTC actually have a lower value then the previous year, this a very powerful signal.
When we pull up this chart again in another year, what do you think we will see the next Today price at? Any guesses?
 @originate Hive Developer Evangelist & Market Analyst
Posted Using LeoFinance Beta