It's no doubt that the last few days have been exciting in the Bitcoin and cryptocurrency markets, with lower-than-expected CPI sending most financial markets into a short-term bullish run. But can it sustain? Let's explore my thoughts on the subject.
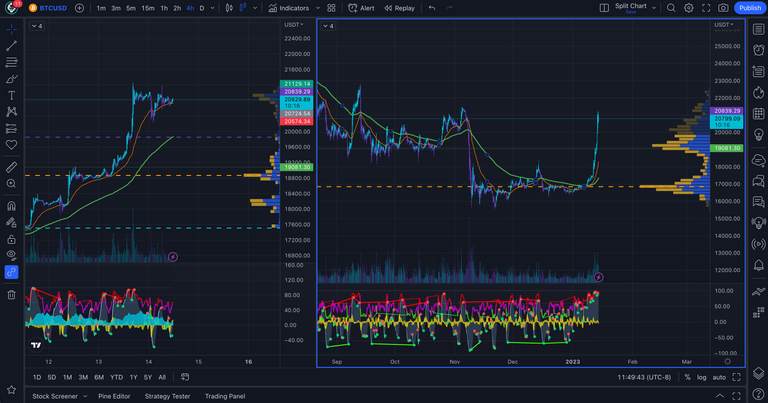
Bitcoin is hitting a big psychological level
Bitcoin is hitting a big psychological level. 20,000 is a huge psychological level for Bitcoin traders and since pumping over it, we have certainly hit resistance as the price is hitting a large supply zone. This means that there are people taking profits off the table at this significant level for BTC. The high volume momentum sent it to nearly 22,000 and back down into a bull flag pattern on the lower-term timeframes, as seen on the left-hand side of the chart above.
Momentum is overbought and exhausted
Momentum is overbought and exhausted. The Bitcoin bulls just went on a big charge and are now getting a bit exhausted. The momentum and RSI on the Market Cipher indicator is telling us that we went into some seriously high levels, and the asset is starting to cool off. This means that the volume that was sustaining the pump has started to slow down as it has hit a big wall of sell orders at the current level. It's all about supply and demand.
Short term correction before next run
Short-term correction before next run. When you zoom out to a higher time frame like the 4-hour, as shown on the right-hand side of the chart above, Bitcoin is hitting some serious resistance at that previous level of consolidation, which is really where the market found a fair value for BTC for a decent amount of time.
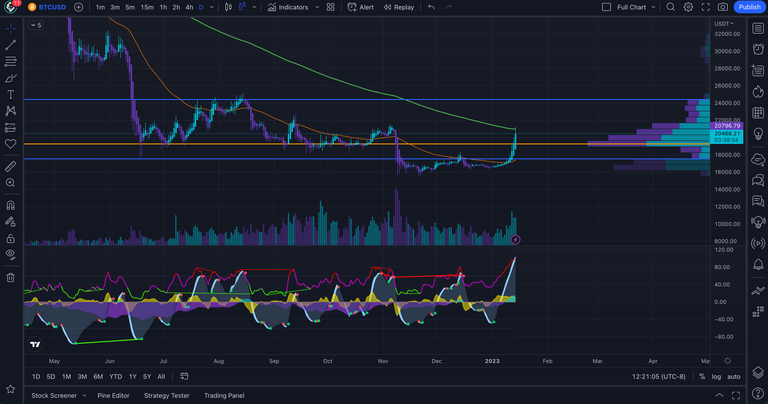
Bitcoin daily time frame showing volume profile and testing the 200-day moving average as resistance. Zooming out to the daily time frame, we can see that we are meeting resistance with the 200-day moving average. When the 50-day moving average crosses over the 200-day moving average, which could happen next month or so if this bullish momentum continues, that would pretty much signal the end of the bear market, in my opinion. Just gotta be patient and see how it goes.
I would like to see Bitcoin retest the 50-day moving average for support, which would be an awesome area to buy in if the momentum is going to continue in that direction. If not, then I will have to readjust. Moving out to trading higher timeframes has helped me see the more macro perspective and is allowing me to focus on my actual playbook versus just playing in the markets and getting my butt handed to me.
Possibility for more downside, it may be a trap!
Possibility for more downside, it may be a trap! Looking at that daily chart, you will see that we are actually retesting that previous zone of support and finding it as resistance. The possibility still remains that Bitcoin could have more downside remaining. There are a few analysts saying that we could still test the 10K level. It's not out of the cards. We all want to be mega bullish at all times, the markets are boring and depressing otherwise, but we need to also be realistic.
Good luck trading over the weekend. I am looking for a correction before I make any moves, plus part of my playbook is I don't trade on the weekends. I am working hard on prepping some awesome and professional-style videos for Coin Logic to boost our game for when the crowds start to come back!

Nothing said is financial advice.
This is for educational and recreational purposes only!
Stay safe in these volatile markets and don’t get rekt!
Follow the markets and get the latest data and news on Coin Logic
Any videos will be posted to Coin Logic TV on YouTube in addition to 3Speak:
https://www.youtube.com/coinlogictv
Trade stocks, options, and cryptocurrency with us on Robinhood and pay no commissions! Use our link to sign up, link your account, and get a free stock!
Trade with us on Apollo X on BSC if you want to trade crypto with leverage in a decentralized fashion!

Posted from my blog with Exxp : https://coin-logic.com/bitcoin-has-gone-parabolic-short-term-but-still-has-a-long-way-to-go/
those who bought in 2022 are still waiting for ath but I have quit a profit as I bought a few weeks ago as I know it might be the lowest it will go
ai token and coins are doing great
Thanks for sharing your thoughts. This parabolic move has caught many by surprise.