
What is the Fibonacci Sequence?
In mathematics the Fibonacci sequence of numbers is as follows: 0, 1, 1, 2, 3, 5, 8, 13, 21, 34, 55, 89, 144, etc. Each number in this sequence is simply the sum of the two previous numbers, and the sequence continues infinitely. Something worth mentioning about this numerical sequence is that each number is approximately 1.618 times greater than the previous number.
This correlation ratio between the numbers of the sequence is called The Golden Ratio (phi φ=1.618), which describes proportions of everything from tiny atoms to immense stars in the universe (The principle of ‘As Above, So Below’ that is also found in alchemy).
Many ancient Greek architects were building the temples and creating their sculptures in alignment with the golden ratio, even back from the 5th century BC (The Phi number is named after Phidias, the architect of the Parthenon). The Great Pyramid of Giza’s dimensions (which is at least 5,000 years old) are also based on the golden ratio. Leonardo Da Vinci called it the “divine proportion” and featured it in many of his paintings. His famous Vitruvian Man painting uses the ratio extensively from the fingers, to the arms and the whole body, creating the ideal physical human form. The Fibonacci sequence also appears in nature, for example, in the number of petals of flowers.
Who was Fibonacci?

Leonardo Pisano Bigollo (1170-1250 A.D.) was an Italian mathematician from the Republic of Pisa, considered to be “the most talented Western mathematician of the Middle Ages”. The name by which he is known, Fibonacci, was made up in 1838 by the Franco-Italian historian Guillaume Libri and is short for filius Bonacci (“son of Bonacci”).
Although he was the first in the West to mention the Fibonacci sequence in his Liber Abaci book, the sequence had already been described by Indian mathematicians as early as the sixth century AD.
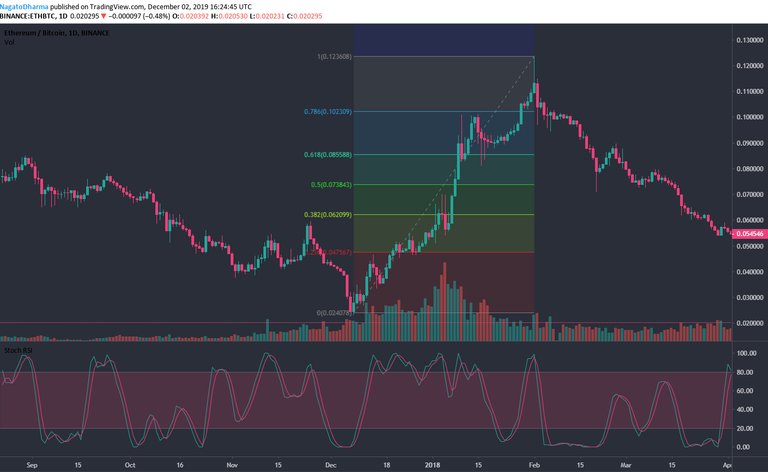
Tijo from the Arcane Bear explains how to use the Fibonacci Retracement levels in the cryptocurrency markets in the video below.
Link to the article: https://arcanebear.com/fibonacci-retracements/
Very informative. I've been learning this myself for 3 weeks now. I am still quite dumb about it haha
Something important is that it can be used on higher time frame like 1 week (1W) or 1 day (1D) from the very top to the bottom to see the bigger picture.
If you use lower time-frames like 12h, 4h, etc. the fib retracement can be used to identify local ranges.
You just draw it from the top to the bottom. It can also be edited in TradingView to add more levels etc.
Thank you for the tips. I'll get back to you when I figured this stuff out and get the hang of it and ask more questions.
Have a great day!