Examples of oscillators include;
- MACD-Histogram,
- Force Index,
- Stochastic,
- Relative Strength Index,
Oscillators seem to be the easiest indicators used by traders. They make the job easier but like I said in my previous post they have a major downfall of fake outs.
 Pixabay
Stochastic
stochastic is an oscillator that was made popular by the late George lane. It is one of the most common indicators used by traders. In the strictest of definitions, stochastic is a leading indicator that measures overbought and oversold conditions in the market. The measurement of overbought and oversold is calculated with respect to price and number of days.
Stochastic compares the closing price to the recent high-low range. Like I earlier said price is compared to the number of days. This goes to say that there are four parameters used when calculating stochastic.
they are
- Closing price
- High point for the number of days
- Low point for the number of days
- the total number of days set by the trader.
It is made up of two lines: a fast line called %K and a slow line called %D.
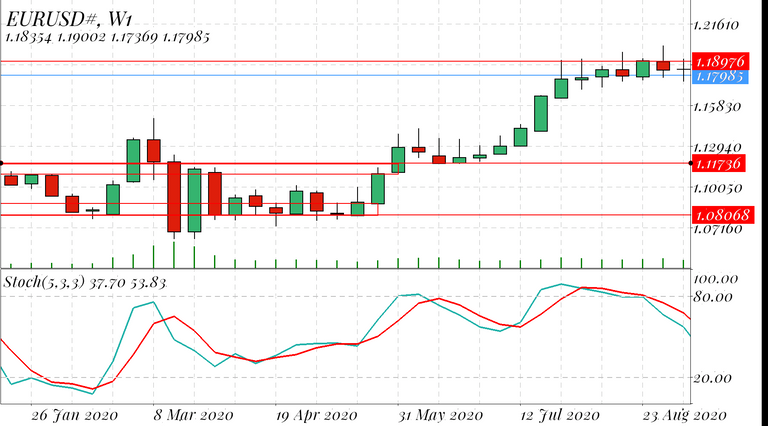 The picture above shows a stochastic indicator chart with 80 and 20 as a reference point for overbought and oversold respectively
Knowing how to calculate the stochastic gives you an idea of how the indicator works and how to apply it.
The first step is to calculate the fast line and it is done by using the parameters above.
The slow line is calculated with the formula below
Where
Ln means the low point for the selected number of days
Hn means the highest point for the selected number of days
100 is the total range of movement for price
n means the number of selected days chosen by the trader
From the two formulae above you will discover that %K will be so sensitive to price changes compared to %D. Hence there will be more false breakouts. So for this reason some traders devised a means to reduce its sensitivity so as to prevent whipsaws.
This is the reason why we have two ways to plot stochastic. You have the fast and slow stochastic. The fast stochastic has two lines called fast and slow. The slow stochastic is calculated by smoothening the slow line of the fast stochastic. This is done by making the %D of Fast Stochastic becomes the %K of Slow Stochastic and is smoothed by repeating the formula for %D to obtain %D of Slow line of the slow Stochastic.
Too much maths and complexities right?. Thank God for programmers you don't have to calculate it yourself all you need to do is to set with your meta trader 4 app and you are good to go.
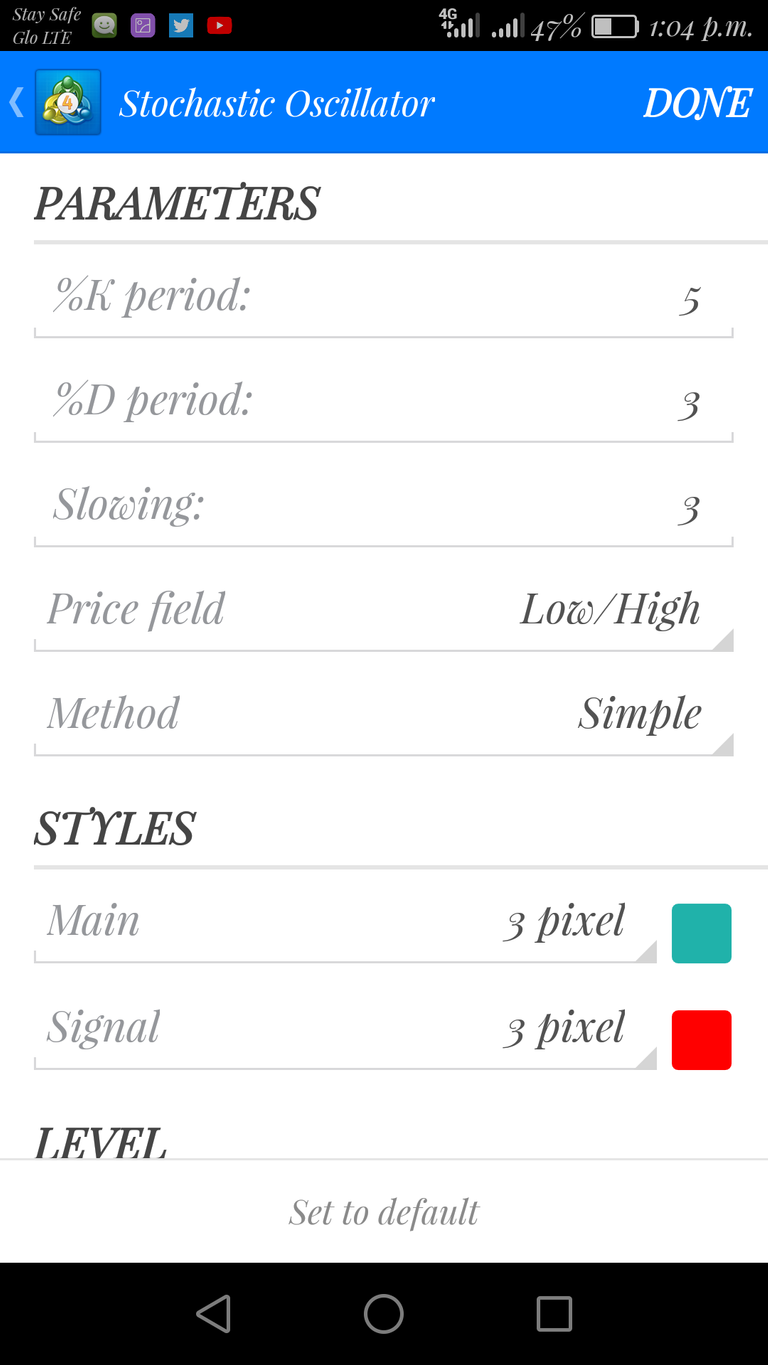 This picture shows default settings for stochastic
Knowing how these indicators come about is good but knowing how to apply them is the most important part of your trading journey.
stochastic have a reference point of twenty for oversold and eighty for overbought. They always fall within the range of 0 and 100 hence, the term oscillators. So this means that once it is overbought we sell and once it is oversold we buy. Does this always work? Of course not. In a strong uptrend, if you sell when it is overbought you will get your account in the red. So this is what I do.
Personally, I am a crude follower of the saying "flow with the trend". I use stochastic when there is a pullback of a trend either up or downtrend. For example, if the trend is up on the chart with a higher time frame, I go to my trading chart and wait for a pullback and also for an oversold on my stochastic. Once I see this, it signals my entry to go long.
That will be all for this post. In my next post, I will be talking about MACD. Thank you once again for reading.
References
- Babypips
- Investopedia
- wikipedia
- pixabay
- The new trading for a living by Dr. Alexander Elder
Looks you are getting yourself focused on forex trading, it is really nice.
This will be much more appreciated when posted directly to the leofinance community using https://leofinance.io
Brother, try to be flexible in your contents a bit and publish other contents alongside your forex trading.
Have a great night bro
I am focused on dcity right now.. posting is not really top for me