The concept of levels of support and resistance in crypto trading are intertwined with the ideas of supply and demand.
Mastering the art of being able to recognize support and resistance levels is a factor that eases ones career as a trader in a very big way.
Considering the importance of support and resistance levels to traders, I have decide to make this post where I explain all I know through research about support and resistance levels.
A simple definition of a level would be "a point on the price chart where the price is respected either in an upward or a downward move".
What I mean by saying that price is respected is that, if the price of a coin is going up or down and it gets to a point where it moves in the opposite direction, that point where it reverses its direction can be called a level if some sort of price reversal or spike has happened on the price chart at that point sometime in the past.
Support
A support is any point in a bear market where the buy pressure on an asset is great enough for it to prevent the price of that asset from falling further and causing the price to start moving up on the chart.
When the price of a coin reaches a support level, it simple means the big players in the market are buying in at that point in a bid to drive the price up and keep it from falling further.
The support level for a coin is usually a point which has featured multiple times on the chart in recent history of the coin regardless of the timeframe.
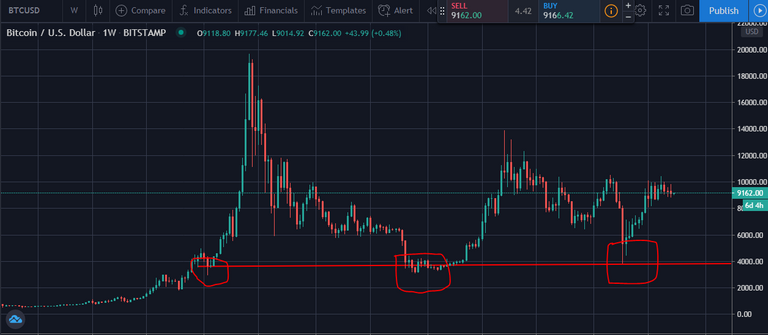
The above image is a chart of Bitcoin against the US Dollar on a weekly timeframe, If you observe the red line drawn across the chart just below the candlesticks you will notice that it cuts across points where the price of Bitcoin experiences a price reversal against the US Dollar.
The price range for this point on the chart is between $3500 and $4500, so we can say that BTC has a support between $3500 and $4500. If we use a different timeframe over a set number of periods the price level that fulfills the condition shown on a chart is the support level for the coin on that chart for the set period and timeframe.
A coin reaching a potential level of support indicates the probability of the coin going up in price in the next set of movements.
If the coin price refuses to go up after hitting the potential support level on the chart and continues to fall down in price, that potential support level is not a true support, a true support is reached when the price hits a potential support level and has a reversal then starts moving up.
Resistance
Well, resistance is the very opposite of support.
A coin is said to have reached resistance level if the price of the coin habitually falls in value when it reaches that point on the price chart.
The level of resistance is a point where the price of an asset starts experiencing a downturn in a bull market.
When a coin is said to have reached is resistance it simply means the price has gotten to a point where the big players in the market now perceive the coin to be overvalued hence they start selling in a bid to effect a price correction on the price.
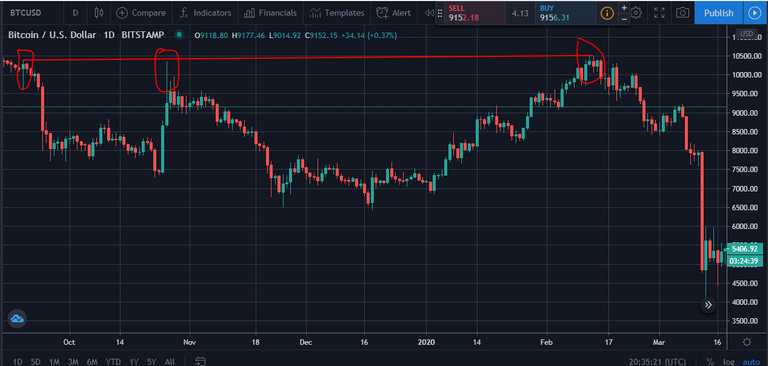
In the chart above we can easily identify three points of resistance on the BTCUSD chart between September last year and February of this year(2020), we can say that Resistance for Bitcoin during that period is around $10,500.
A coin reaching a potential resistance level is an indication that coin is to be considered for selling.
If a coin reaches a potential resistance level and the price of the coin keeps going up then that point is not a point of true resistance, it only becomes a point of true resistance if the price of the coin starts falling at that level.
Conclusion
The content of this post only serves to provide an introductory session to the concepts of support and resistance, the topic in itself cannot be covered in one session as it contains several branches and subtopics.
That being said, support and resistance levels is a very effective and commonly used by traders to anticipate the direction of price movement in the market,m however in order to use it to its full potential one has to have a deep understanding of how it works.
As effective as this support and resistance levels may be in determining price movements, in my opinion I think it is more suitable for use by swing traders and long term hodlers as opposed to traders who scalp the market daily.
@tipu curate
Upvoted 👌 (Mana: 24/32)