Hi everyone!
My attention got drawn to DCR today.
I noticed it retraced rly hard after the runup it had at the very end of last year, so I decided to chart it and see if I like it for an entry point. Decided it was ripe for a short to mid term position for my liking.
First lats take a look at the weekly chart to get a overall perception of the price:
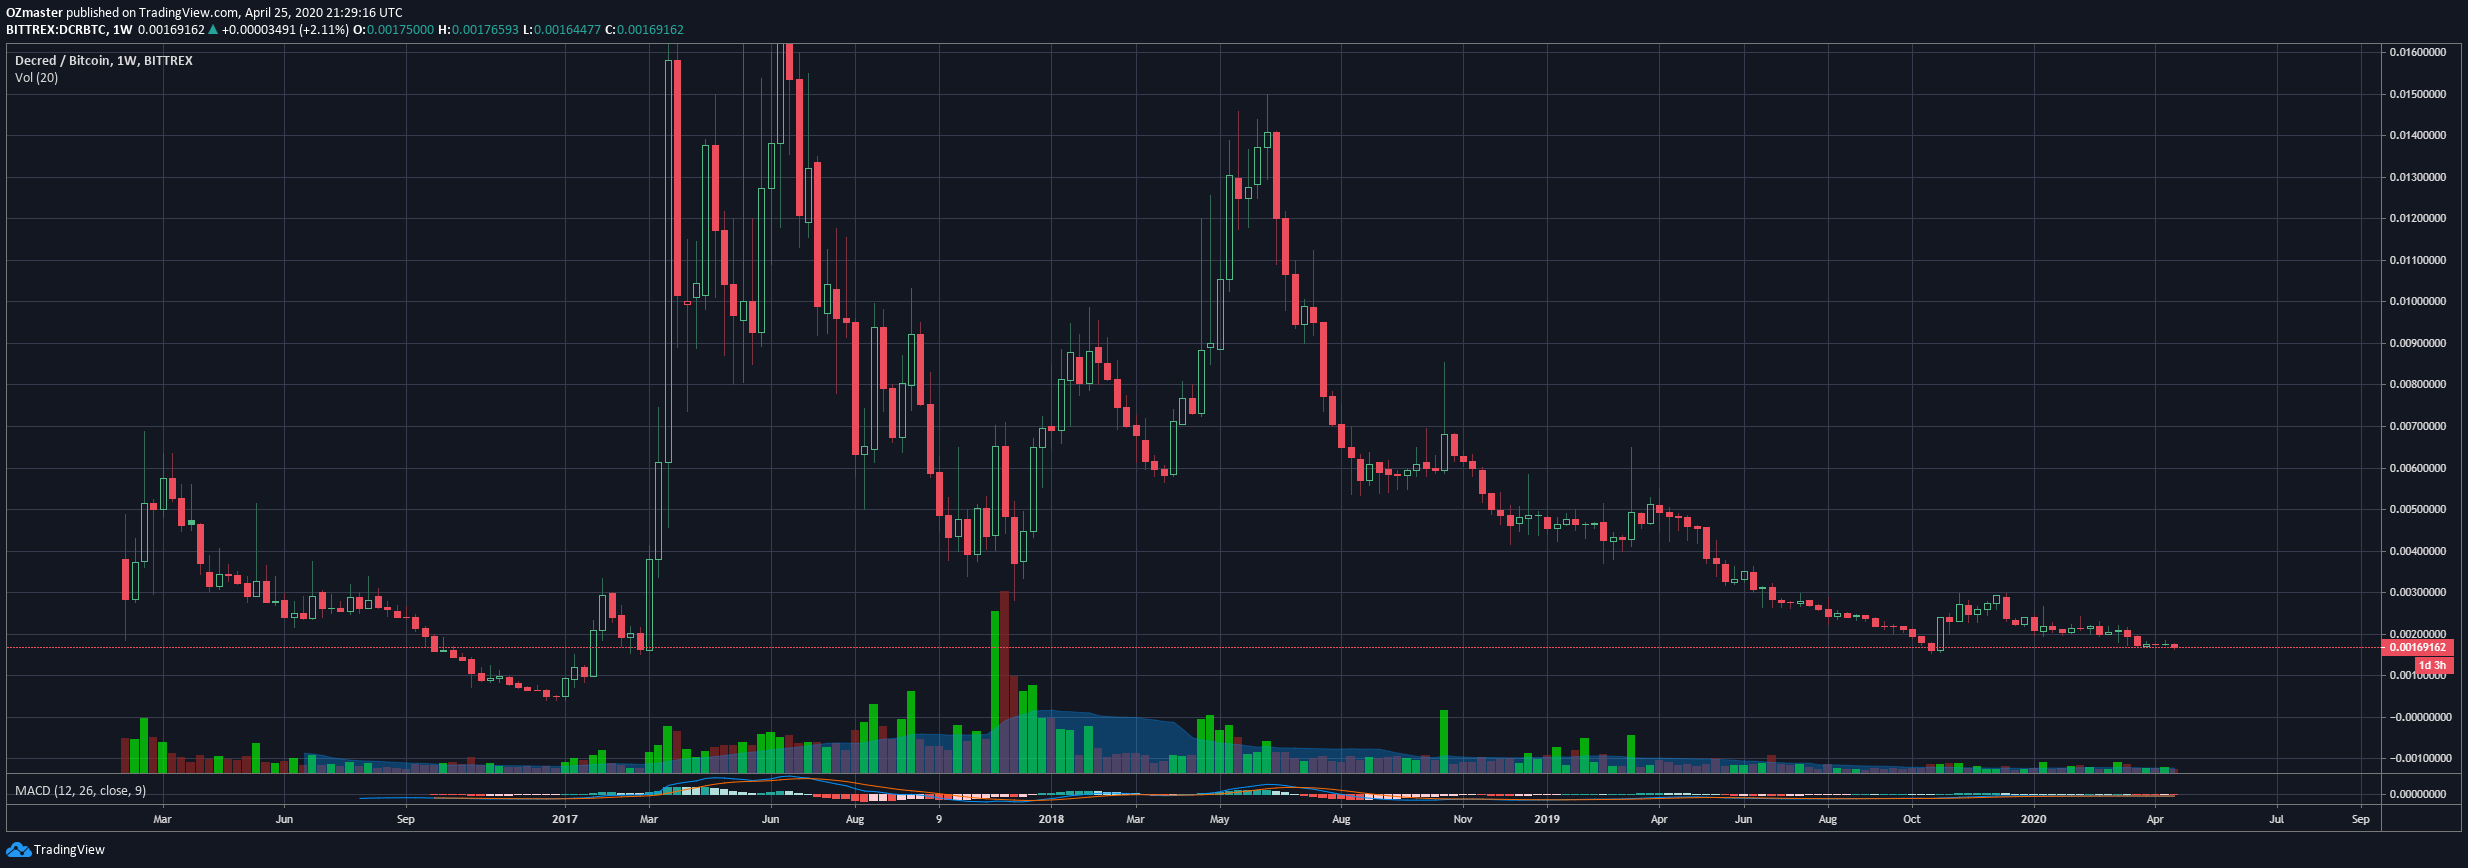
https://www.tradingview.com/x/tyIJ9wWX/
Now, to get a clearer view on where support and resistance has been building over time I like to switch to a daily chart:
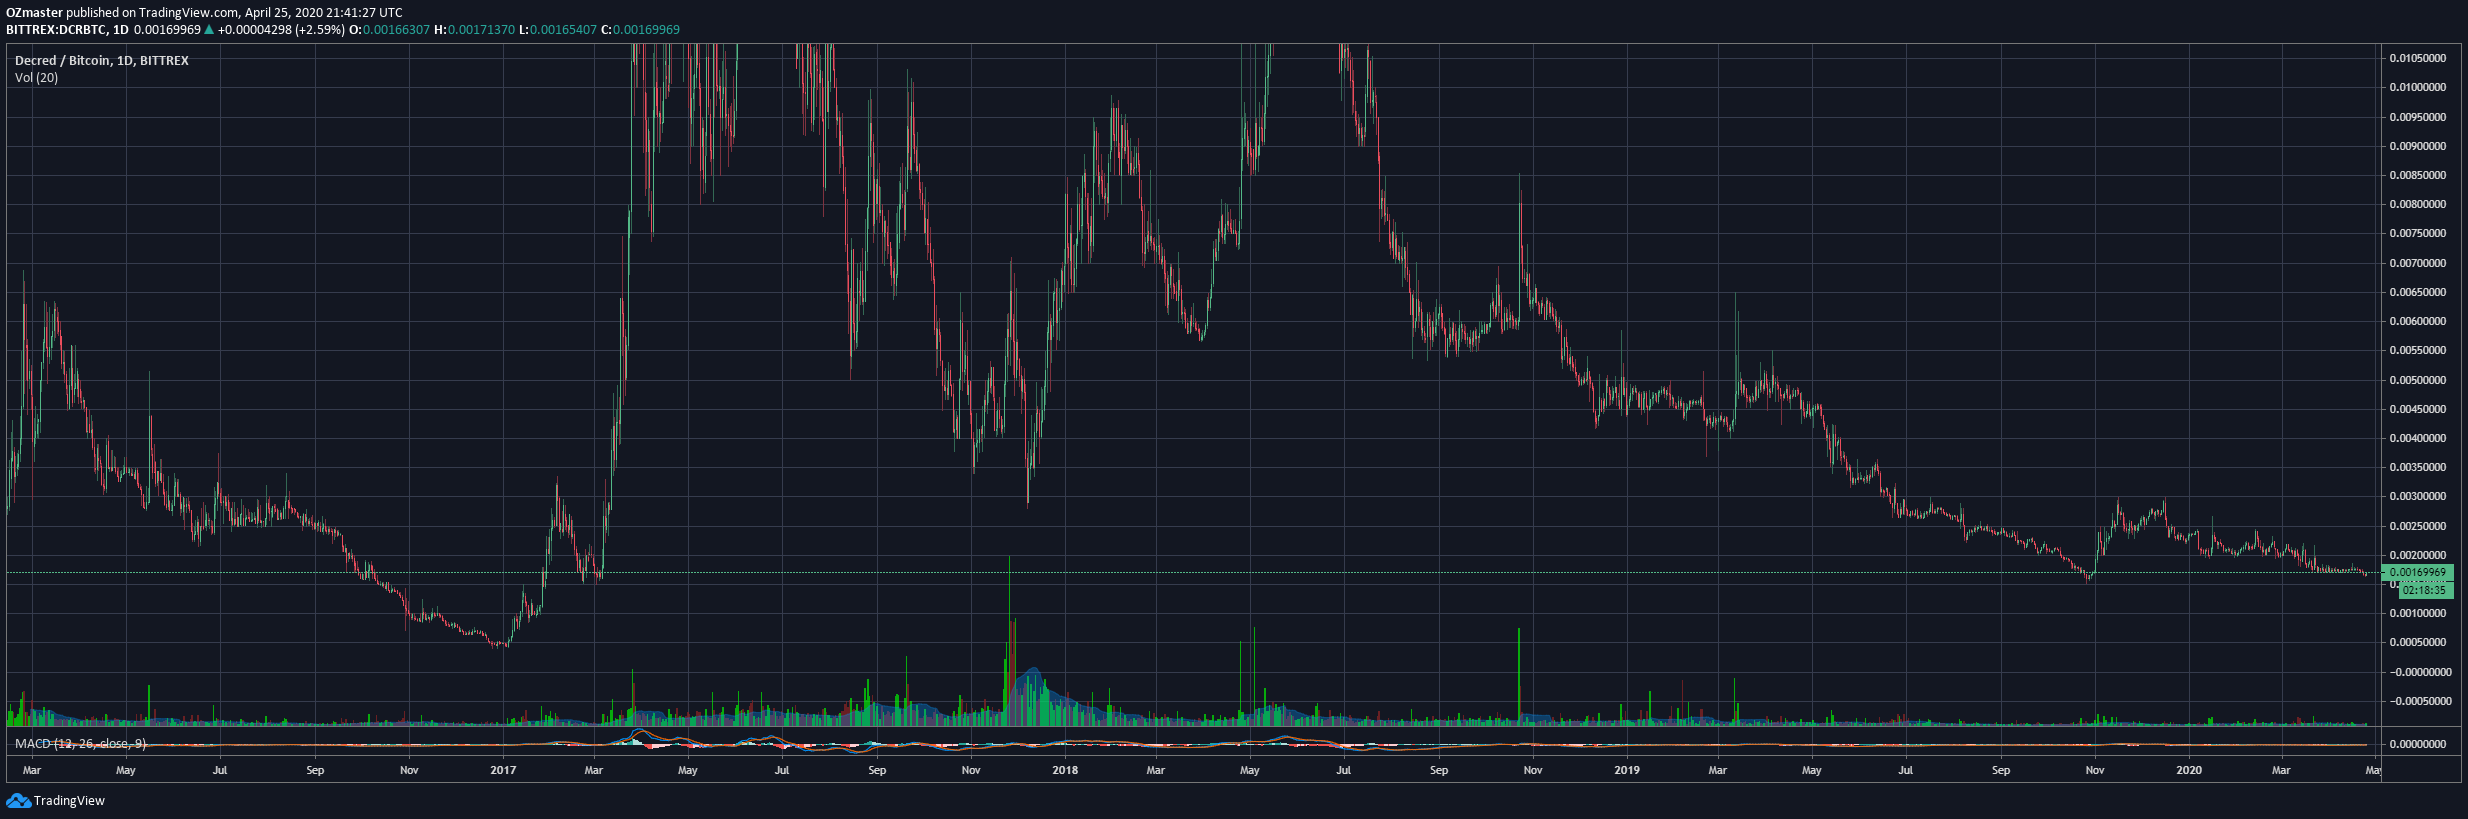
https://www.tradingview.com/x/fFJmO9gh/
As said, switching to daily helps me to easier identify support/resistance areas (especialy for the lower part of the charts):
https://www.tradingview.com/x/P11i6dHT/
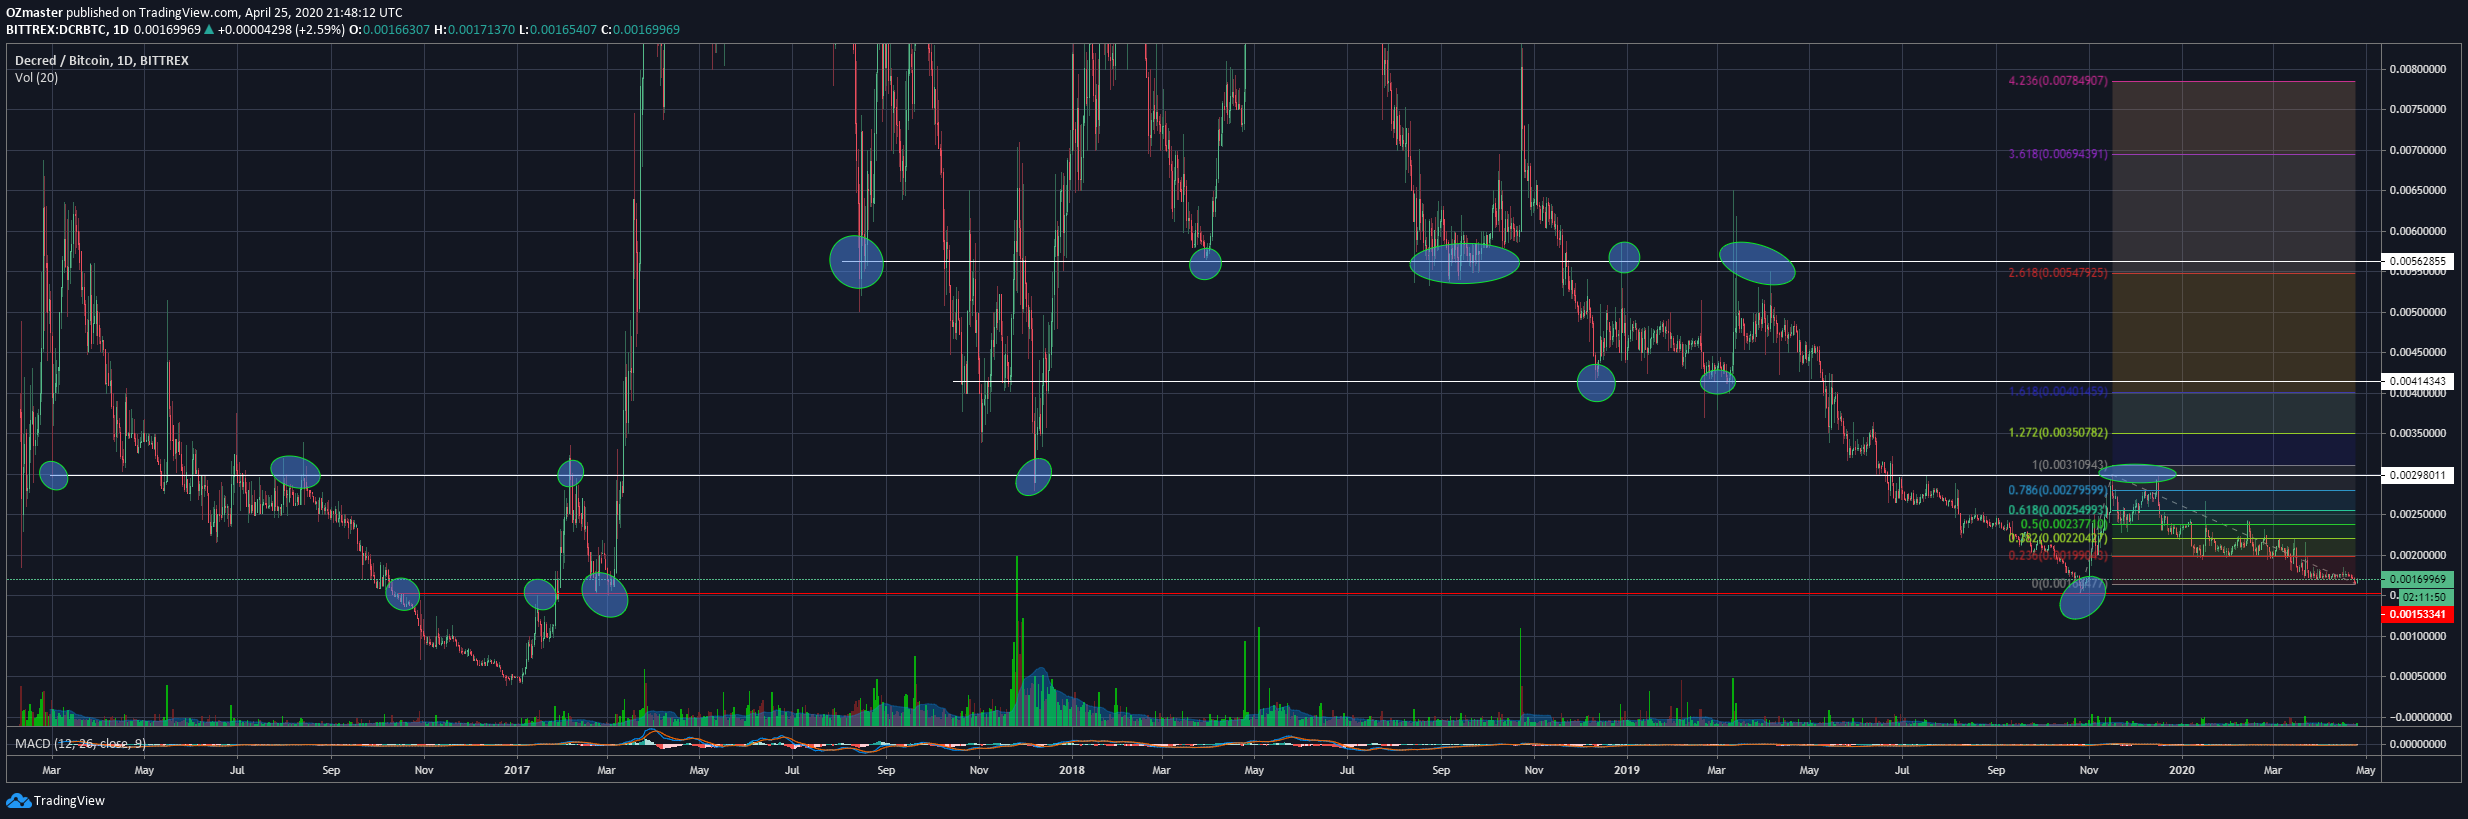
Going from top to bottom, first I marked a local high (0.00153 btc) from the old days of 2016, which seems to have been used as the bottom for the retrace of the multiyear downtrend.
This line would be my tolerance line for this trade. Going bellow would make me bearish for the time being.
The 2nd line I marked also dates long into the history, a local low in early March of 2016, at 0.00298 satoshi. We can see how this particular level was used multiple times throughout the years first as a resistance, then as a support for a local low which sent the price surgin and finaly as a two times resistance of the "recent" runup at the end of 2019.
I view this level as a "hard to break" one, which should confirm the uptrend of DCR in my eyes. Thus I would take some profits at the level.
Next up is the 0.00414btc line, althou I marked it as first being relevant in Oct. 2017., when it was used as a support area, i see it was used even further in the past as resistance (Feb. and April 2016.). We can see it being used again as support at the end of 2018. till ~May 2019 when it finally broke and sent the price towards its new loval low on 0.00153btc.
This line also closely corelates with the 1.618 (dark blue) fib line.
Given the above, it being a previous support and being closely corelated with a fibline yet to hit, this would be my 1st target in case the price confirms an uptrend (breaking through the ~0.003btc area).
Last, but definitely not least, the 0.00562btc line.
Throughout 2017 and 2018 it was used as a support line (somewhat of a resistance area for a short while in 2017 also, 2 times from October to November) after which it switched to being a resistance area in 2019.
The area also closely corelates with the 2.618 fibline, which would make it my final target for this trade.
Once again a short representation of approximately what I expect:
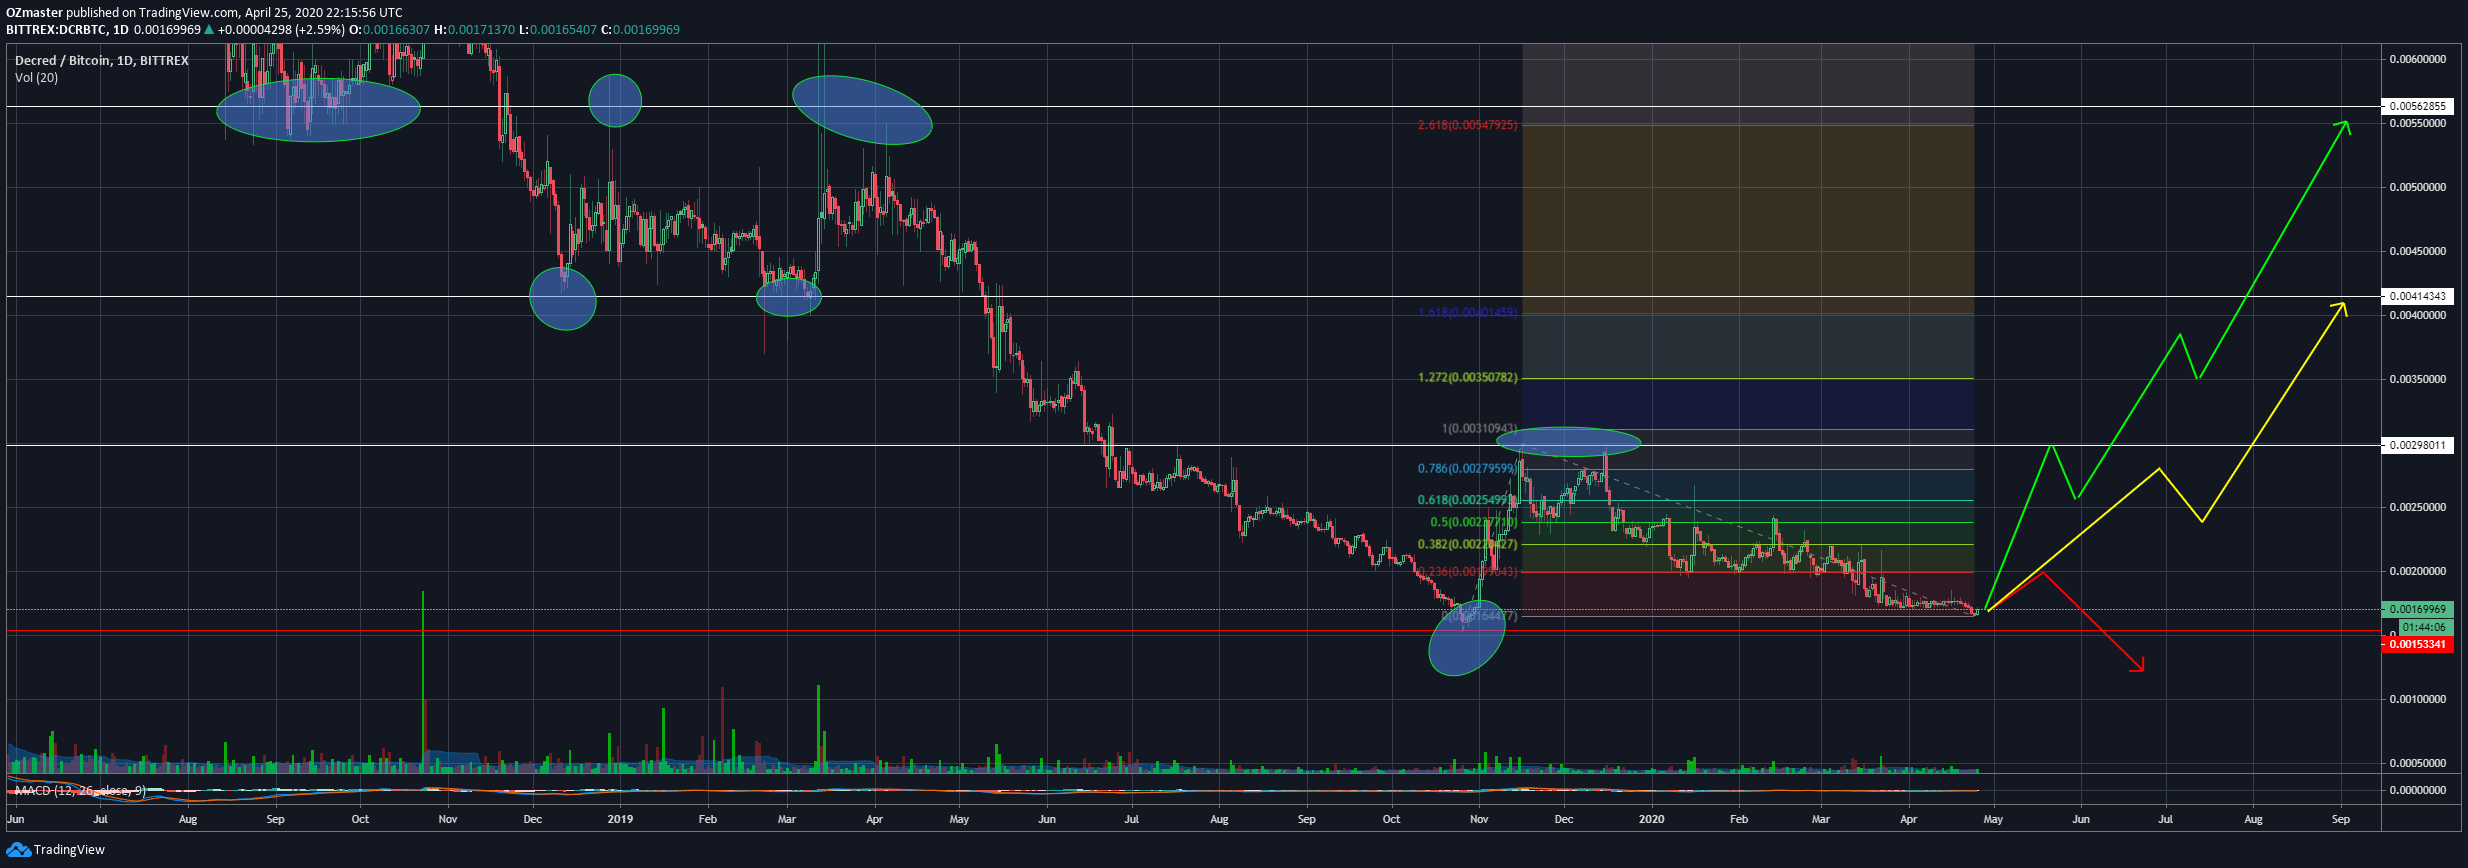
https://www.tradingview.com/x/Ep3KyRga/
Let me know what you think about this trade, what are the altcoins you are eyeing? I'd like to discover some gems ;)
Please keep in mind, this post is NOT financial advice or any kind of recomandation, nor am I lisenced to give one!
It is my personal opinion and view on the chart!
Stay safe!
Kind regards, OZ
great stuff!