Hello traders!
The ICX chart drew my attention, since from my point of view it's very low in price,
so I'm gonna dive right into the charts:
https://www.tradingview.com/x/pZZyff3W/
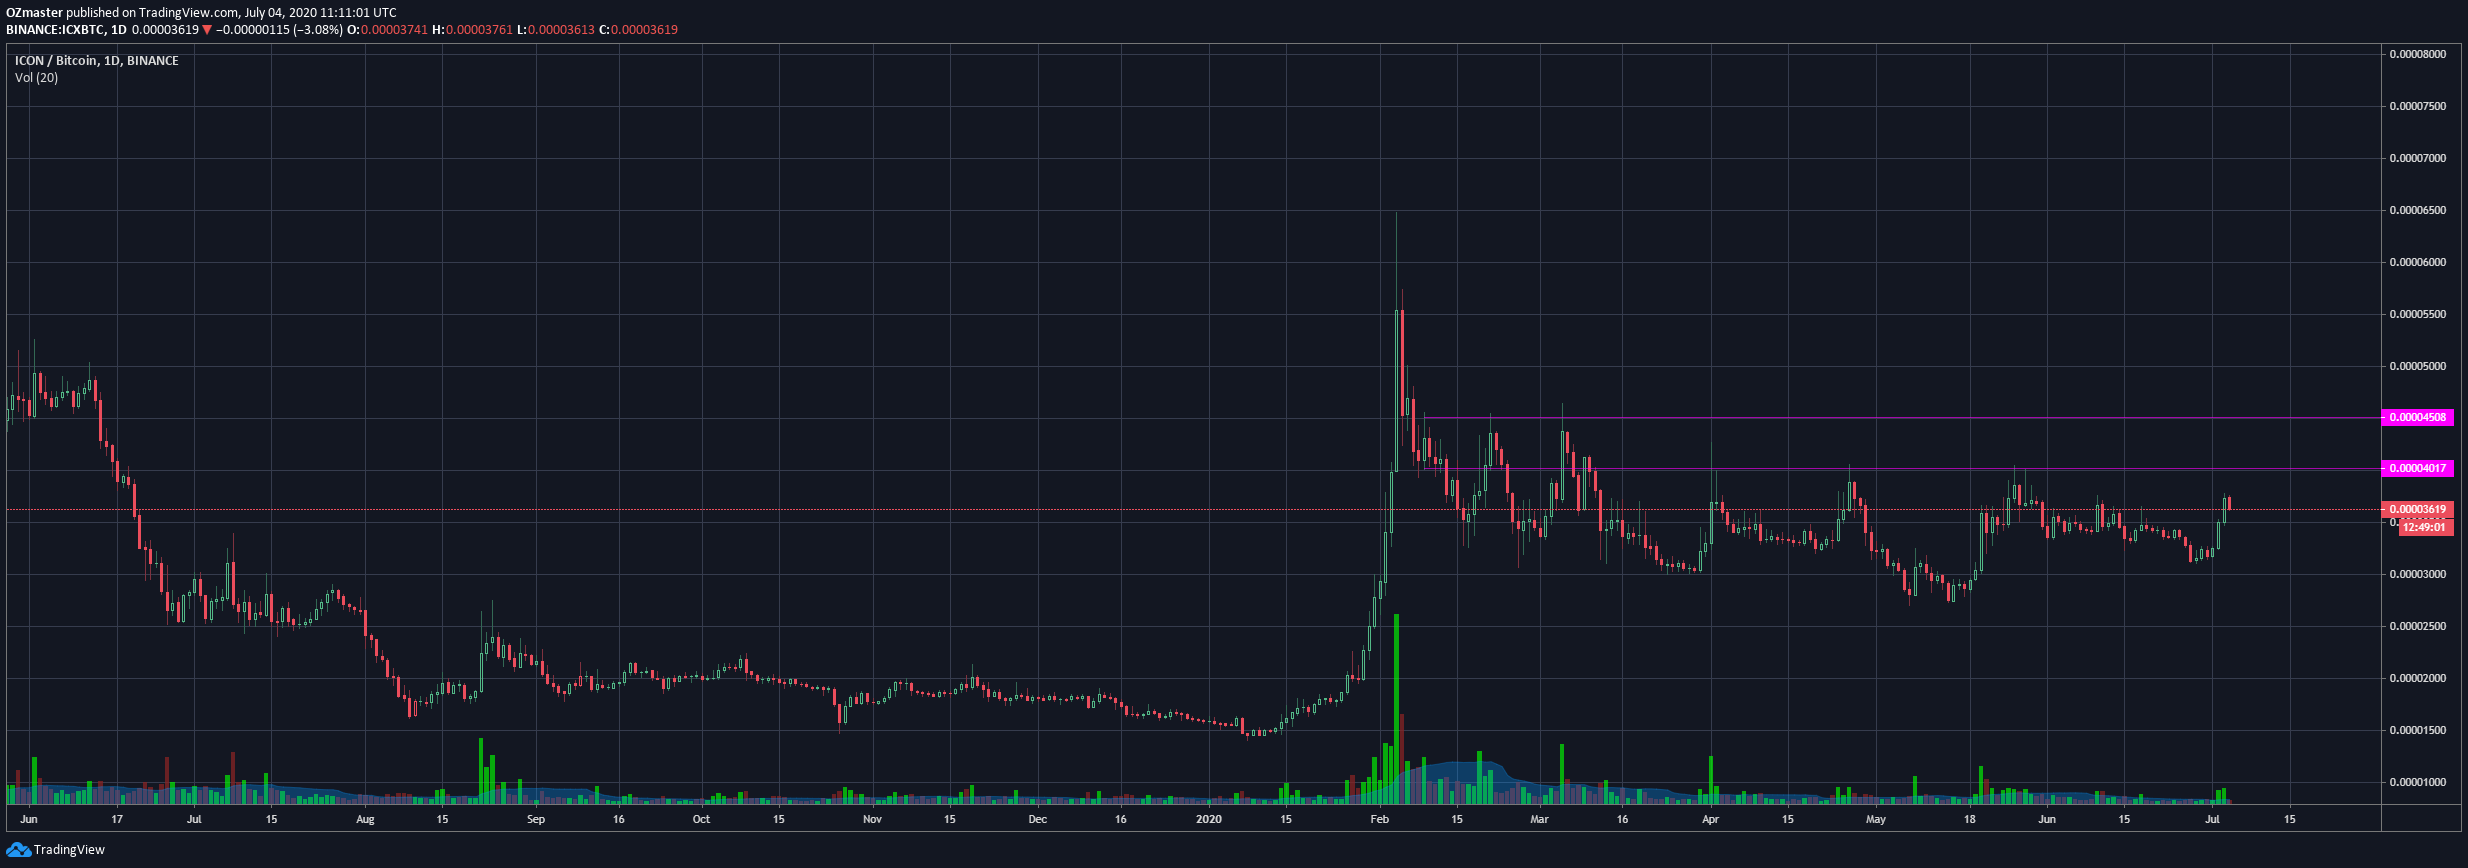
Starting off with the recent history and 2 price levels that I marked.
I view this as 2 key resistance areas on this lower levels which need to be broken in order for the price to be ready for further upside and new local highs.
As long as the chart doesnt show a firm closed candle above the 4500 satoshi line I see the price trading bellow, giving it a chance to dip even to 200 satoshi.
Moving on to the bigger picture, viewing the whole chart:
https://www.tradingview.com/x/Pdrjsij7/
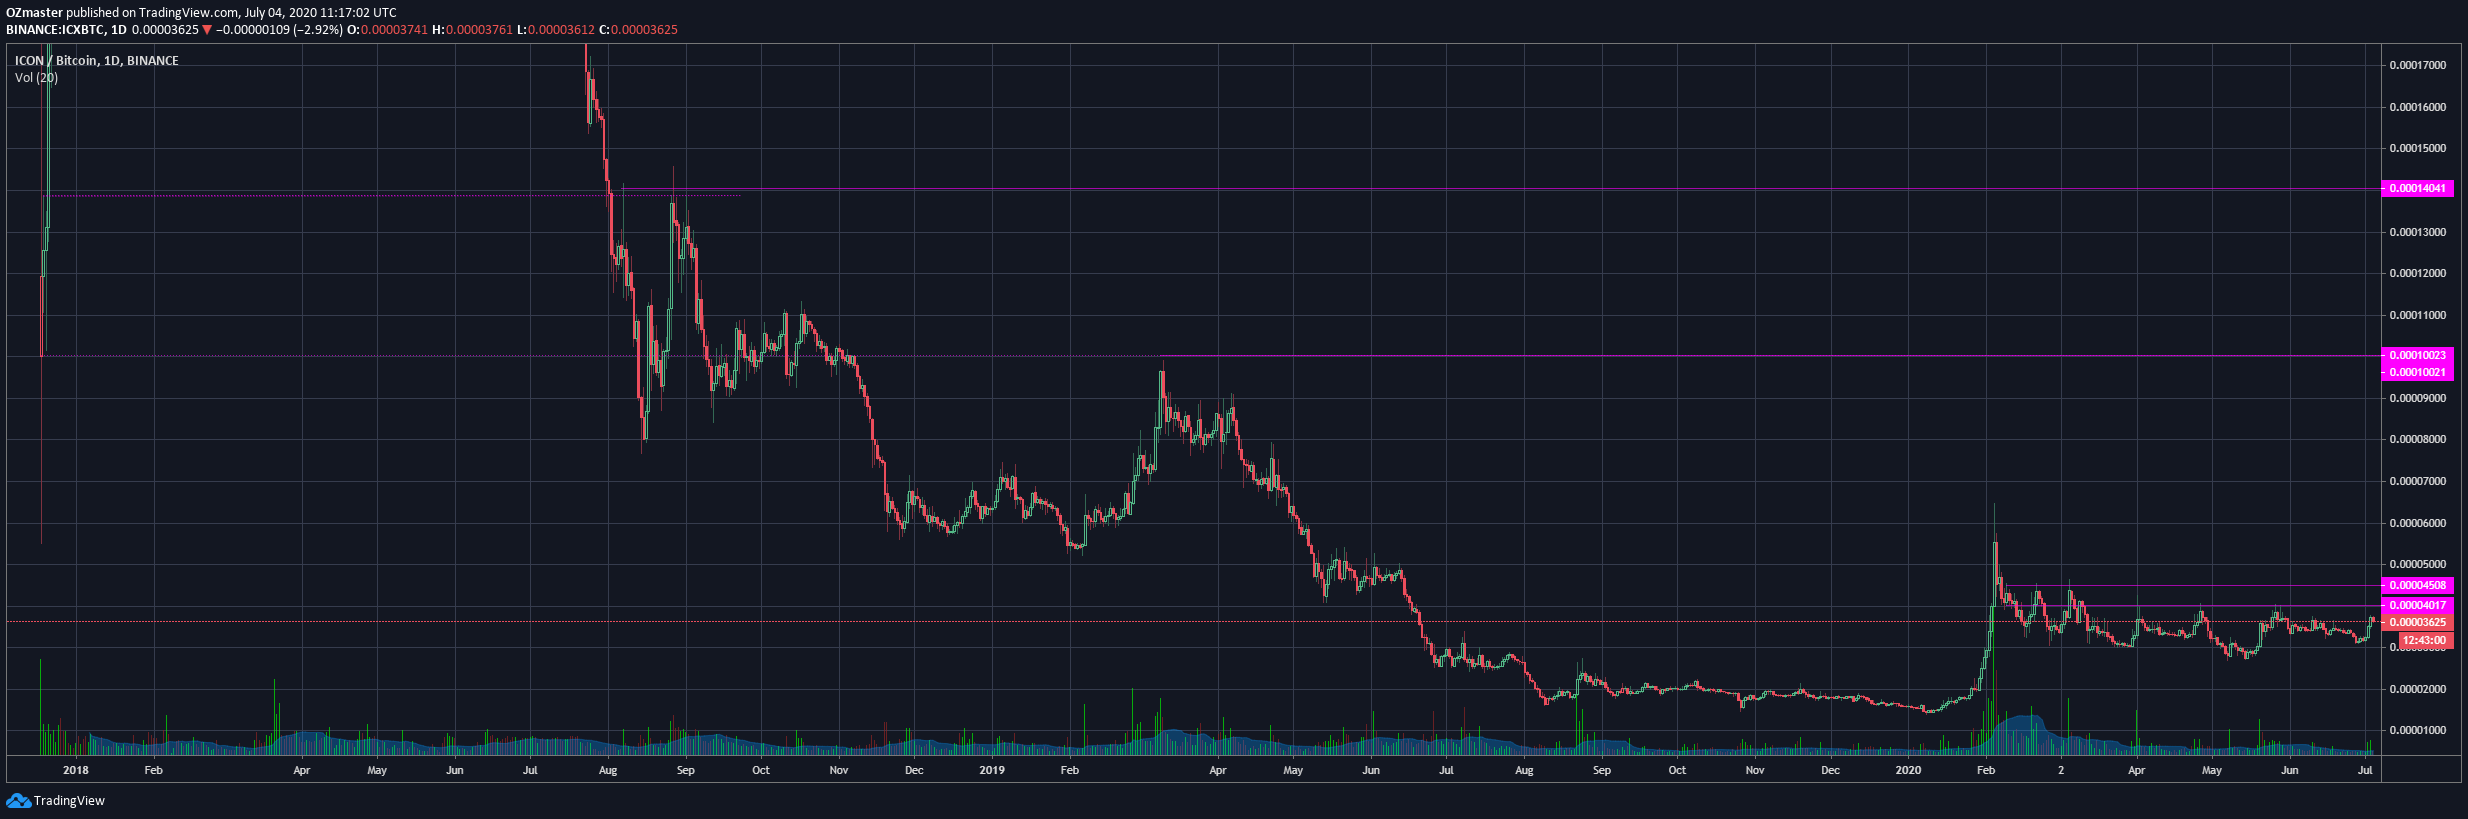
Here I marked 2 additional level's, the 10k and 14k satoshi with lines (dotted to the left side and full to the right),
Those line's show us segnificant price resistance which has been used in the past, which i market with the full lines.
The 10k and 14k levels would potentialy be my targets, as always I will look for some confirmation via fib.
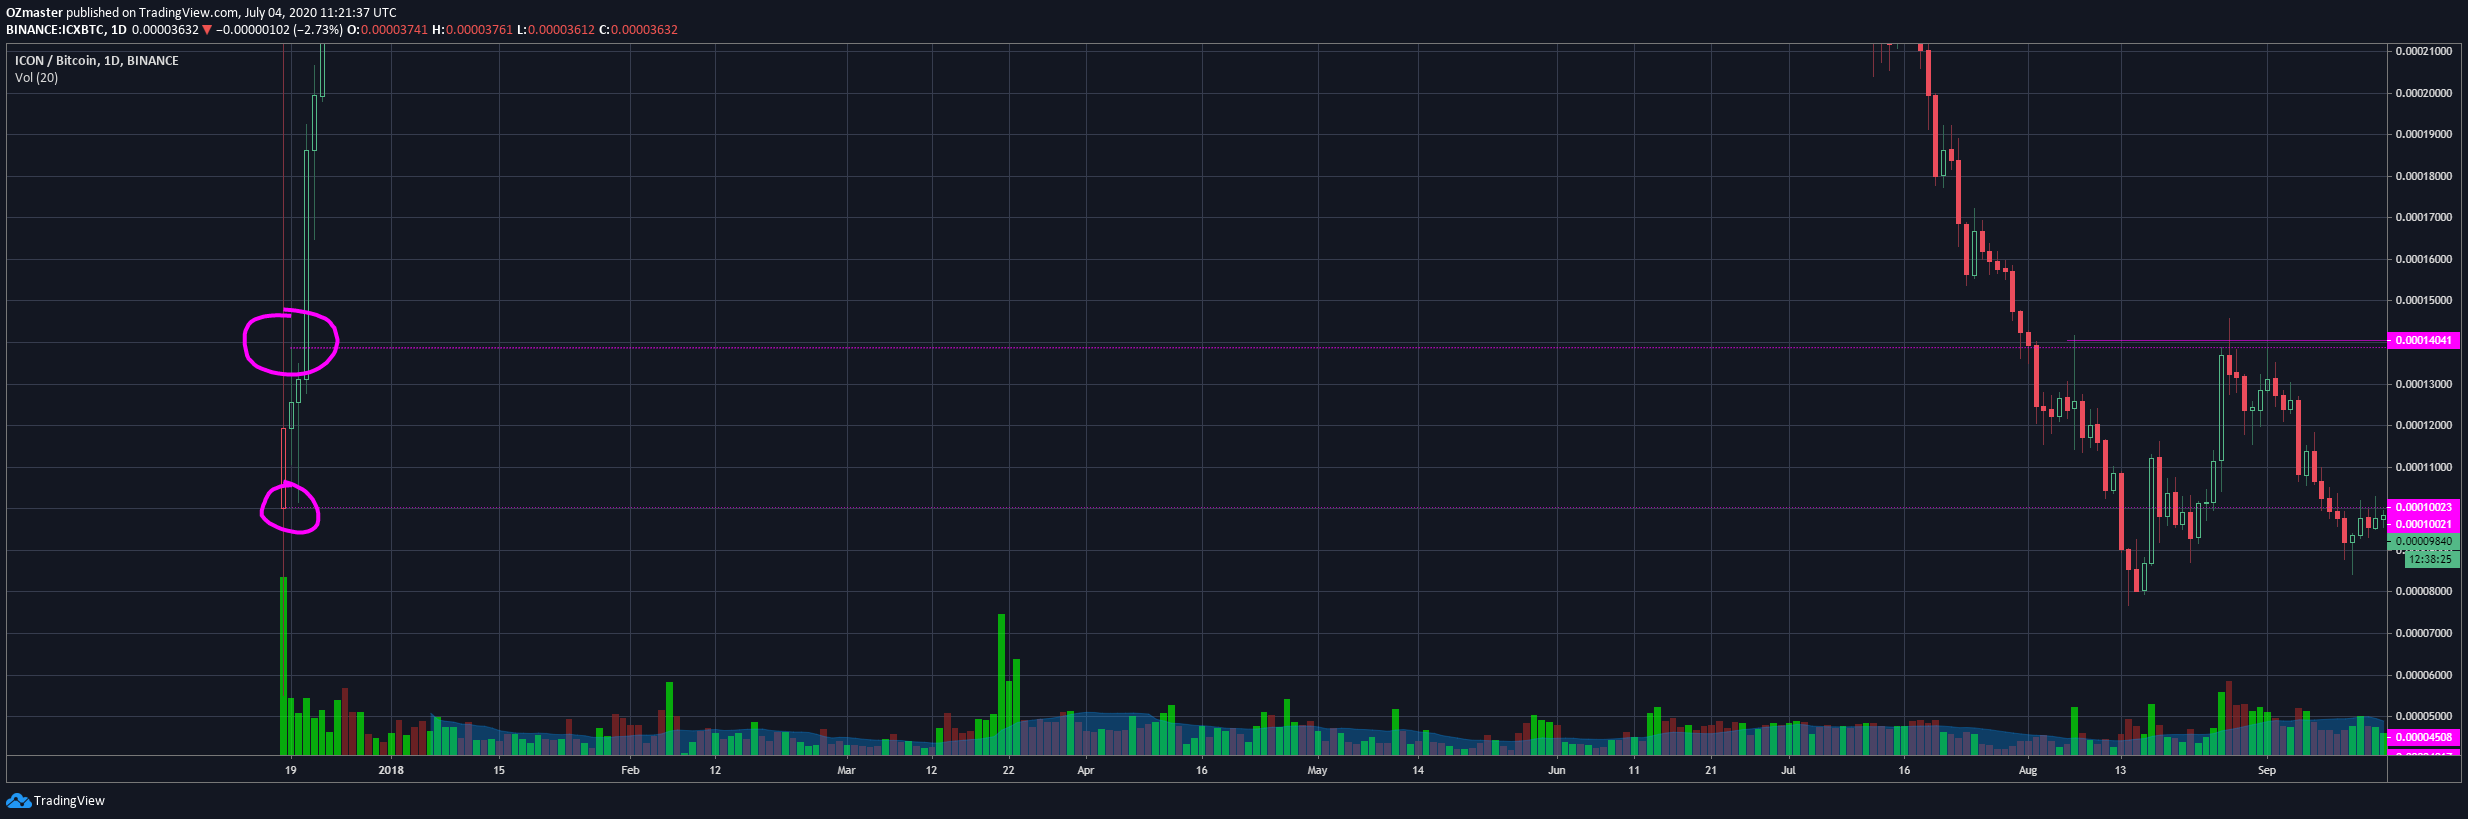
The dotted lines on the same price levels, starting at the very beginning of the chart going to the full body ones,
https://www.tradingview.com/x/NhjAMbb5/
show how in theory the resistance on 10 and 14k respectivly wasnt random but was derived from that very early stage of the chart.
The reason I marked those is to show how in TA, arguably price action made far back in the history can impact the price even years later,
one should always look at the whole chart rather then just the recent 1-2 months.
And last but not least, my favorite tool, the fib!
https://www.tradingview.com/x/g7TksKYo/
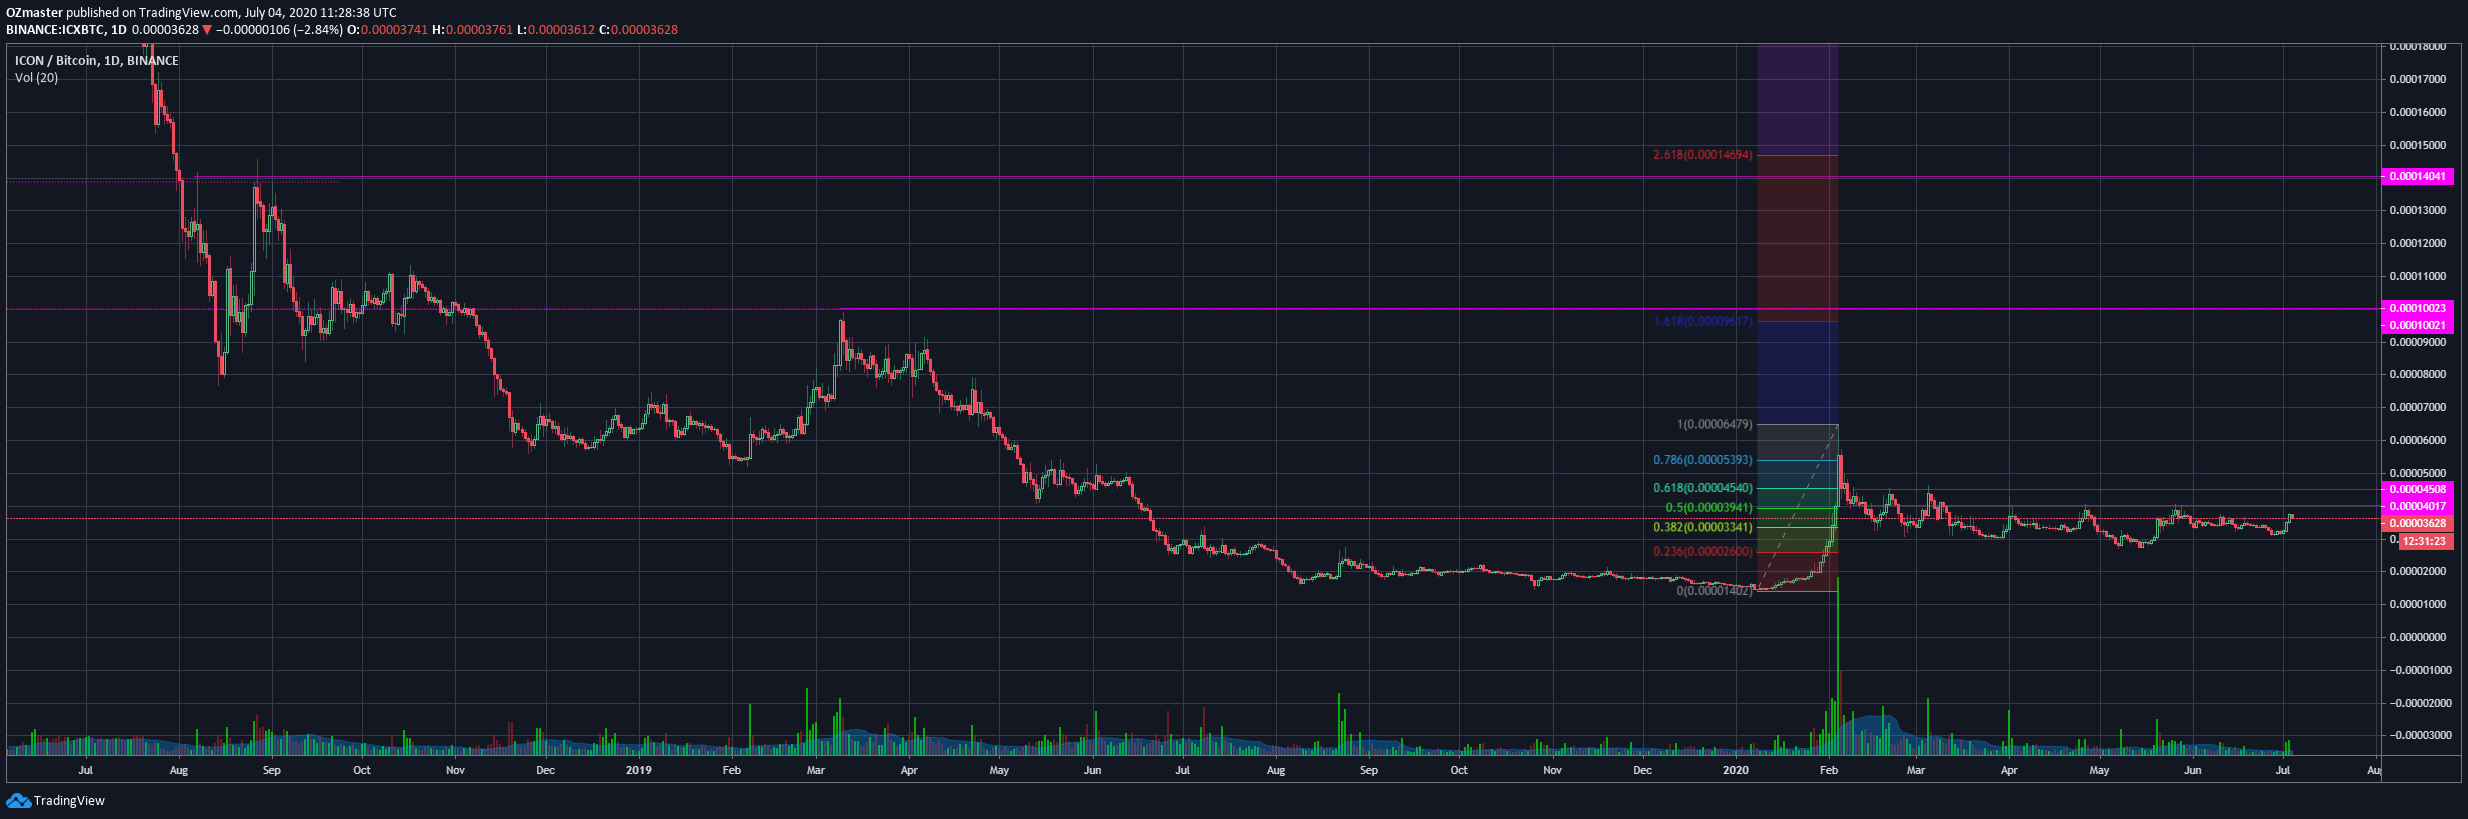
On the lower side we can see the the 0.618 and the 0.5 fib lines being closely corelated to the 2 resistance lines i marked,
but another interesting level that the fib pointed out to me is the 2600 level, one can see that the price had a fair share of support back in June 19' before dipping bellow this one, as well as the price obviously using the 2.6k level as a bottom (for now!) in the recent pullback. This makes me view this line as almost the ultimate support for this trade setup, in other words, if this support fails I would assume there is another period of low level accumulation incomming before the price is gonna try and make new local highs again.
The 1.618 dark blue fib line sits at 9617 satoshi which for me is closely enough corelated to the resistance level I marked at 10k, hence my 1st target will be that area.
The 2.618 orange fib line is showing 14694 satoshi, which althou a little higher then what I marked at 14k, would still enter the realm of enough corelation for me, additionaly I notice that if I had marked the very high point it would almost corelate perfectly, making the 2.618 my final target for this trade setup.
Leaving you to a nice day with a nice rock mix!
Remember to take a break from the charts!
This post is NOT financial advice or any kind of recomandation, nor am I lisenced to give one!
It is my personal opinion and view on the chart!
I may or may not hold this particular asset
Kind regards, OZ
ICX was a gem during the last bull run. Thanks for sharing your thoughts on it.