Radioactive elements have a chemistry which tended to make them oxidize in the young Earth: they formed compounds whose density made them float to the upper layers of the molten Earth, to be concentrated in the crust. Even so, since the mantle contains so much more material, the mantle produces much more radioactive heating than the crust. The rate of flow of this energy due to radioactive decay through surface rocks is about 80 mW per square metre. Only about a fifth of this comes from the crust, with the rest from sources deeper in the Earth. The energy is about 10 times as much as all human power sources, but 4000 times less than the Earth receives from the Sun.

Energy released in the core and mantle moves upwards by both conduction and convection. In the rigid lithosphere (crust and outer mantle), conduction is the main steady mechanism. The movement of tectonic plates and the associated volcanic activity are other significant ways in which the hot interior loses energy. The rate at which energy flows thermally, by conduction, through a solid is given by a simple heat flow formula: Energy flow = temperature difference/thermal resistance. This is analogous to Ohm’s law for charge flow (current), but in thermal calculations we tend to use thermal conductance K rather than resistance, so:
Energy flow = temperature difference × conductance.
And as with electricity, conductance can be defined as: conductivity × area of cross-section/length. Thermal conductivity depends on the nature of the material and has the units of W m-1K-1.
THE ATMOSPHERE: CLIMATE AND WEATHER
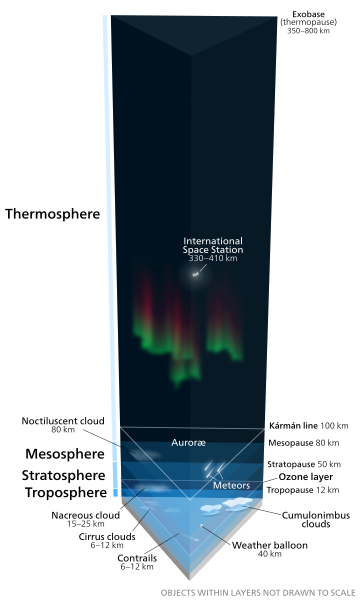
The atmosphere is a mixture of gases as we all know. The pressure of the atmosphere at the Earth’s surface is about 105 Pa (1 bar or 1000 millibars, as given on weather forecasts). Atmospheric pressure varies locally and depends on the temperature and humidity of the mass of gas below a height of about 15 km. This region is the troposphere, and is where ‘the weather happens’. The pressure variation is quite small, at ±30 mbar or so, and is caused by the differing densities of tropospheric air: cool dry air is denser than warm damp air. The figure below shows the main features of the atmosphere.
Air pressure decreases rapidly with height, following (roughly) an exponential decay law:
p = p0e-kh
Where p is pressure at height h, p0 is pressure at sea level and k is a constant.
The pressure formula assumes that the air is at a constant temperature throughout, but this is not the case. The air gets cooler up to the top of the troposphere, then its temperature rises in the stratosphere, cools in the mesosphere and warms up again in the thermosphere. This complex temperature pattern is partly due to the way that the atmosphere absorbs solar and terrestrial radiation at different levels, and partly because of a gradual cooling with height.
The overall cooling is what you would expect if a volume of gas drifted upwards into regions of lower pressure. Near the ground, air is heated by contact with the Sun-warmed land and seas. It expands, gets less dense and rises, carrying energy to higher levels. The gas expands, does work against its surroundings, loses energy and so cools: this process is called adiabatic cooling, meaning that the gas is not heated or cooled by external means.
GLOBAL CIRCULATION OF AIR
If the Earth spun vertically in its orbit, the Sun would always be overhead at the Equator. The equatorial zone would be the warmest and the poles the coolest. Thermal convection would produce a permanent circulation pattern. Warm air rises above the Equator, cools, then falls down at about 30° latitude. This air then moves towards the Equator to replace the uplifted air, causing a more or less steady air flow called the trade winds.
In fact, the Earth is tilted on its axis, so that the warmest zone (and its trade winds) moves up and down with the seasons. A hemisphere gets its summer when the warm zone is furthest into it.
WORLD ENERGY SOURCES
The figure shows how the world’s overall fuel consumption has risen over the period 1971 to 2015 as measured in Mtoe. The category of ‘Other’ includes wind, solar, geothermal, etc. but makes only a small contribution. Here the strange unit Mtoe is million tonnes of oil equivalent and its conversion factors are 1 Mtoe equals 4.187 × 10 4 TJ or 11630 GWh. One million tonnes of gas releases more energy than one million tonnes of oil whereas one million tonnes of coal produces rather less. The energy density of a fuel, the amount of energy produced per unit mass, is usually measured in J/kg.
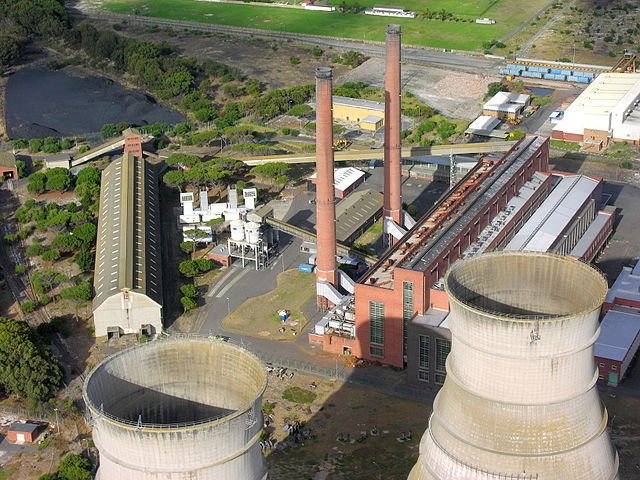
The main overall harmful effect of these fuels is the production of carbon dioxide and its influence via the greenhouse effect. Coal, oil and gas all make a significant contribution. The burning of wood and the use of other types of biomass play a much smaller part. By comparing the figure, it is obvious that, per tonne of fuel, coal has by far the most damaging effect. This explains why coal-fired power stations are being phased in some countries like the UK, although they may have a future with efficient carbon dioxide scrubbers. The figures also show why it is important for the future that alternative sources of energy are used, including nuclear energy, as these have no or little carbon dioxIde emission.
Historically, much of heavy industry developed close to supplies of fossil fuel, notably of coal. The mining and open-cast digging for coal has additional environmental problems. Meanwhile, the transportation of gas and oil is generally easier and is often achieved by pipelines crossing large global distances.
POWER PRODUCTION: TRADITIONAL AND ALTERNATIVE ENERGY SOURCES
The fuels can be used for direct energy production, such as the burning of coal, gas or oil in the home for domestic heating or cooking. The thermal energy produced is low grade (it is degraded energy); it cannot then perform useful work and it is lost to the surroundings. Improvement in the thermal insulation of houses and offices is therefore an effective method of reducing the energy required for spatial heating. Much fuel is used in power stations for producing electrical energy. This is high grade energy because the production of electricity can be used to drive motors and various electrical devices. Much of the remaining fuel is used in transport, particularly for internal combustion engines.
ELECTRICAL POWER PLANTS
The fuel used for these can be traditional, such as coal, gas or oil, or it can be nuclear. First, the consumption of the fuel (by burning or nuclear reaction) is to produce work energy. There is a limit to the efficiency of such a process. Most power plants use steam to power turbines. Water is heated to produce the steam. The optimum efficiency can never be higher than that of a carnot cycle and this depends on the incoming temperature of the superheated steam and the temperature of the condensed steam. The higher the ratio of the temperatures of the incoming and outgoing steam, the greater the efficiency. However, the turbines themselves will have a mechanical efficiency as they power electrical generators. There can be further energy losses as a result of transmission along the power lines to the end user. In the case of hydroelectric schemes, the turbines are driven by the flow of water.
SOLAR POWER
The energy of the Sun can be used to produce electricity directly via photovoltaic cells. Such cells consist of a thin layer of semiconductor, which is usually in the polycrystalline form, of a suitable band gap such that the incoming light can create electron-hole pairs. These provide the electrical current. The principle is similar to that for light-dependent resistors (LDRs). Solar cells usually use silicon doped with phosphorus or another impurity to give the best characteristics, and may consist of a sandwich of n-type silicon and p-type silicon. A contact grid is added to the top surface and a contact layer to the back surface. Silicon is highly reflective so, in order to maximise the amount of solar energy absorbed, an anti-reflective coating is added. Finally, a cover glass or similar protective layer is added. Other materials used for solar cells include gallium arsenide, copper indium diselenide and cadmium telluride.
The efficiency can be increased by having a number of layers absorbing photons of differing ranges of energy, but the advantage of silicon is that it is a well-tried and relatively cheap semiconductor. The solar cells need to be oriented to take best advantage of the Sun’s radiation. Solar heating panels, on the other hand, are used for spatial heating and for hot water. The incoming solar energy directly increases the temperature of water, which is pumped around a building or supplied to a tank.
HYDROELECTRIC POWER
The flow of water that drives the turbines in a hydroelectric scheme comes from the potential energy of water retained in a reservoir to a greater height. A mass of water m at the top of a dam, height h, has potential energy mgh. As power is energy/time, the power P is given by mgh/t, where t is the time over which the mass of water flows through the turbines. The transfer of energy to the turbines is highly efficient, being usually approximately 90%. As an example, the Grand Coulee Dam in the USA has a height of fall of 87 metres and produces approximately 700 MW from one power plant (there are a number). Taking as a guide an output of 1000 MW from established coal burning and nuclear power stations, it can be seen that hydroelectric schemes are comparable or better.
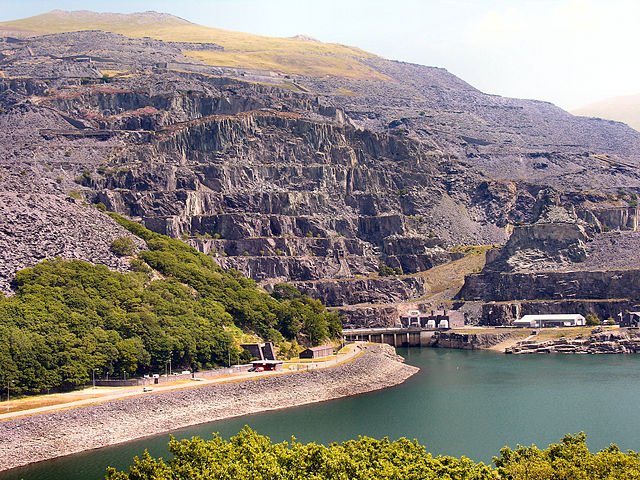
Hydroelectric power can be obtained in conjunction with pumped storage. A notable example in the UK is at Dinorwig (North Wales). There are reservoirs at two levels and the turbines are constructed so that they can operate in either direction. When there is a heavy peak demand for electricity (and this is often associated with a concentration of household activities connected to the timetable of events such as international matches on the television), water can be released at a very high rate to produce maximum power. Under these conditions Dinonwig can supply over 1.7 GW of electricity within 90 seconds of any decision. The upper reservoir can be slowly refilled at night using power from the National Grid using power stations such as nuclear ones that operate continuously.
Similar considerations exist for tidal power stations. Here, the reservoir is filled from variation of water level due to the tides, One disadvantage is that in such systems there may be intermittent and variable filling of the reservoir, although turbines operating in both directions can be incorporated. There has been a long-standing proposal for such a scheme in the Bristol Channel but this would be likely to produce associated environmental problems.
I will be stopping here for now but will conclude this series in my next post. Till then, I remain my humble self, @emperorhassy.
REFERENCES
- Energy sources
- Climate weather and atmosphere
- earth atmosphere
- Global circulation
- World energy consumption
- World energy sources
- Renewable energy
- Renewable and alternative energy sources
- Power station
- Electricity generation
- hydroelectric power
- List of largest hydroelectric power stations
- Hydroelectricity
- Dinorwig Power Station
Cool, great article!
Ever thought about bio fuels and not the damaging and destructive 'renewable' bio fuels, but biofuels like algae?
This is my documentary
https://www.chocolatescorpion.com/greengold
This is my friend
http://biomassmagazine.com/articles/7499/australian-algae-project-features-unique-pond-system
https://advancedbiofuelsusa.info/category/feedstocks/feedstock-algae/page/13/
http://campaign.r20.constantcontact.com/render?m=1101873817950&ca=4ed57be4-a049-4104-87d7-3bbec85f5ca3
Thanks for your contribution to the STEMsocial community. Feel free to join us on discord to get to know the rest of us!
Please consider supporting our funding proposal, approving our witness (@stem.witness) or delegating to the @stemsocial account (for some ROI).
Thanks for using the STEMsocial app, which gives you stronger support. Including @stemsocial as a beneficiary could yield even more support next time.
Upvoted by GITPLAIT!
We have a curation trial on Hive.vote. you can earn a passive income by delegating to @gitplait
We share 80 % of the curation rewards with the delegators.
To delegate, use the links or adjust 10HIVE, 20HIVE, 50HIVE, 100HIVE, 200HIVE, 500HIVE, 1,000HIVE, 10,000HIVE, 100,000HIVE
Join the Community and chat with us on Discord let’s solve problems & build together.