Is hive going to have a fast recovery ?
Let’s analyze the charts together:
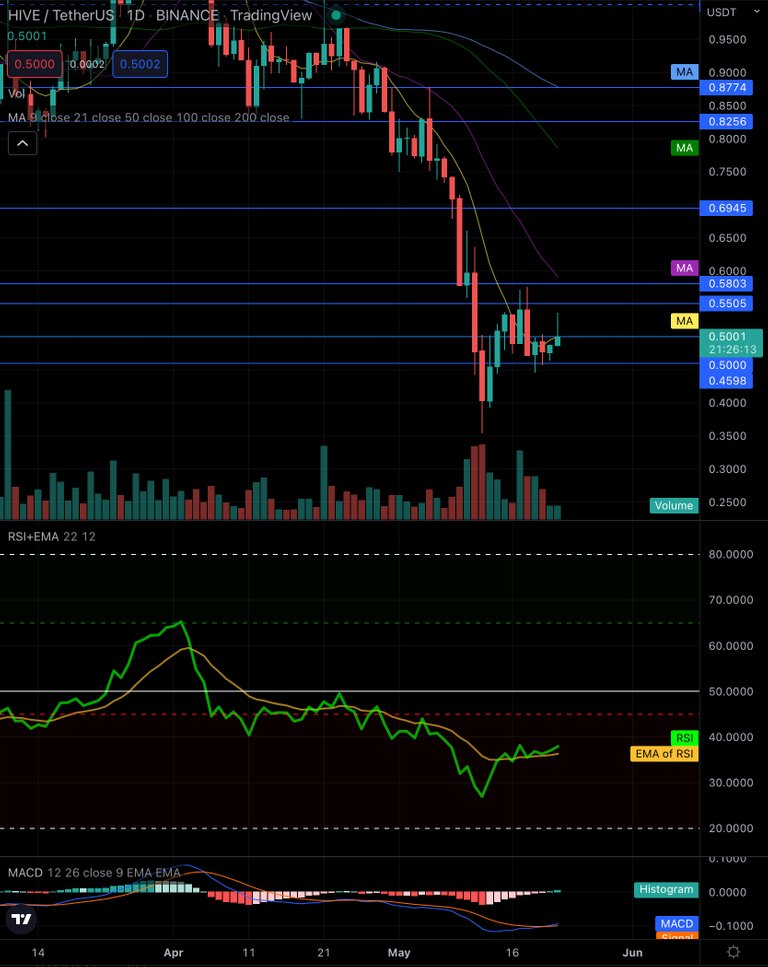
V-Shape Recovery
This is a very common pattern in crypto. I believe we are looking at a beginning of a V-Shape Recovery in the Daily Chart.
RSI
The RSI is at a very interesting level right now.
37.92 and pointing up, with a recent cross over the EMA, 6 days ago. Just compare the RSI movement with the chart and you’ll notice how strong it correlates. Higher highs and lower lows. That’s what you want to see, specially coming from a very low level. Hive RSI went all the way down to 26.97 on May 12th. If you go past in time on the charts and compare, it becomes obvious that the RSI has acted accordingly with the price in a way you could be trading just using the indicator by itself. Buy it closer to 20 and sell it when it reaches 80 or closer. Distribute your trading amounts and luck will be on your side.
On the next post I will be analyzing HIVE weekly chart. Always make sure to trade according to your own strategy and charts.
May the force be with you, pathfinder.
Best regards,
Congratulations @xmauron3!
You raised your level and are now a Minnow!
Check out the last post from @hivebuzz:
Support the HiveBuzz project. Vote for our proposal!