Most Riots in Cities with Democrat Mayors
These three cities among Republican cities without Riots.
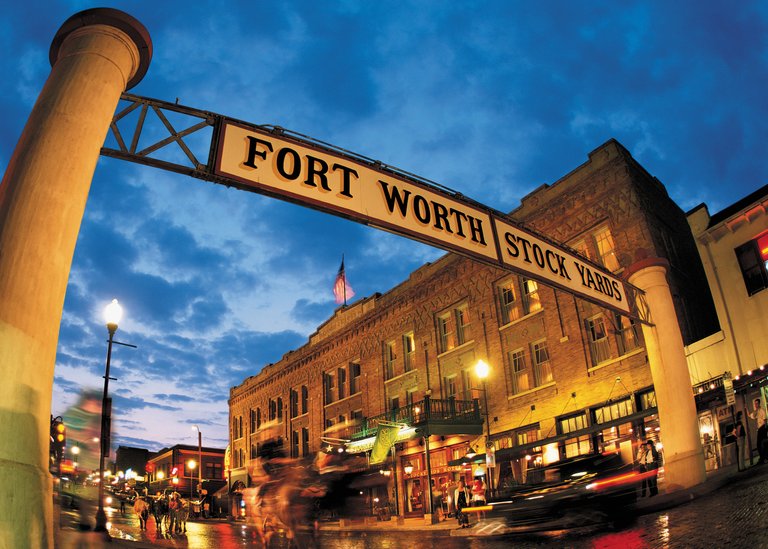
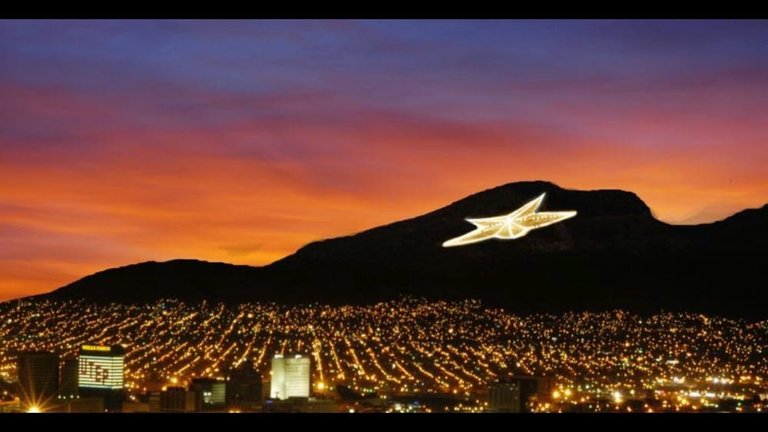
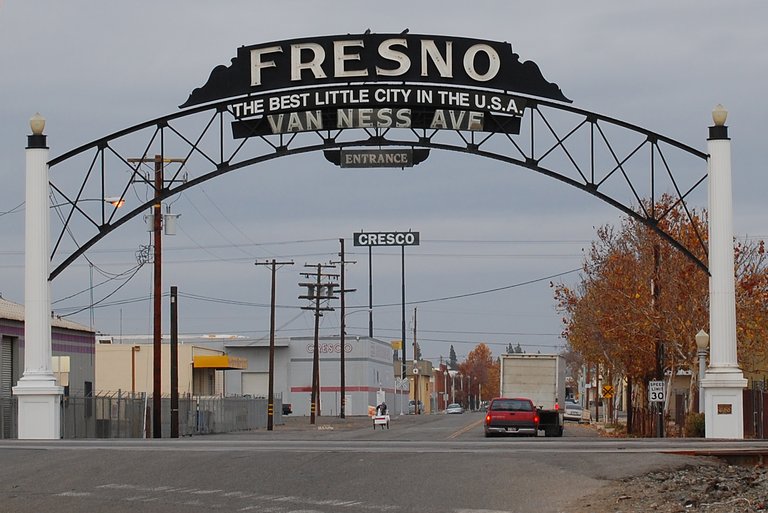
It turns out that most of the cities that are burning down have democratic mayors. This is a claim that was attributed to Trump, and it's true. Doesn't it make sense to avoid property investments in cities that have Democratic mayors?
Here it says Mike Duggan is Democrat.
I was initially leaning toward investing with RealT fractional tokens but now I would want to stay away from Detroit, Michigan. What would you do if these rental properties got burned down?
Yes, but...
But now wait a minute. Looking the top 100 cities in the US. It turns out 29% were Republican. Now, were the cities evenly split 50/50, it would seem that party affiliation is a good predictor of riots but at 29% this isn't so clear-cut.
Now '9' is the number of Republican mayors amoung the cities that have Riots out of the 58 cities with Riots. Whereas we should expect 17 Republican mayors given a 29% split.
So, what is the probability if you choose 58 cities from a population of cities where only 29% have republican mayors?
It turns out this is done with something called the Binomial Distribution
And this can be calculated using Open Office's Calc Program.
BINOMDIST(9;58;0.29;1) = 0.013
The probability of only nine cities having Republican mayors is two percent if we assume no correlation between party affiliation and riots. The number also already includes the probability of having fewer than 9.
This is a small enough number that we should take it as evidence that there is a correlation between these two things.
What does it Mean Though?
This means that given there there is no correlation between party and affiliation of the mayor and these events) then a very
unlikely event of having only nine cities that had a republican Mayor. So, we should reject the "no correlation" idea, and say there is a correlation. Now,
even though we have a correlation it doesn't mean there is cause and effect. It may just mean that there is a common thing that causes both of them. Or some other underlying causes that happen together that causes these two things.
Restricting to Top Cities
I got the distribution from the list of top 100 cities in the U.S. which may have a bias. I didn't get a count of republican, democratic, and independent mayors from all cities. It maybe some riots are not coming to my attention. So it makes sense to restrict to top cities. It may be that smaller cities tend to have Republican mayors, however. By restricting the analysis to these 100, we have 41 cities that were big enough to make the top 100 that had Riots aand would probably make the news and get attention.
In the list of 29 republican cities then seven had riots. So of the one hundred, 24% of the cities with republican mayors had riots. Whereas 42% of the cities with democrat mayors had riots. Working only within this limited set of 100 yields a p value of 0.045 (4.5%) =BINOMDIST(7;29;0.41,1). Now that is on the strong side of evidence.
Conclusion
For the top 100 cities we get a P-value of 0.045. This is considered strong evidence. This is strong evidence that a Republican mayor will significantly lower the likelihood of riots in your city.
See also:
Stephanie Glen. "Binomial Distribution: Formula, What it is and How to use it" From StatisticsHowTo.com: Elementary Statistics for the rest of us! https://www.statisticshowto.com/probability-and-statistics/binomial-theorem/binomial-distribution-formula/
Stats follow:
I got these riots with mayor party affiliations from:
(Source: https://www.tigerdroppings.com/rant/politics/list-of-cities-with-riots/90226160/)
D Minneapolis
D Atlanta
D Nashville
D Los Angeles
D Philadelphia
D San Jose
D Cleveland
D Milwaukee
D Madison
D Portland
R Colorado Springs
D Dallas
D Salt Lake City
D Seattle
D Austin
D Houston
R Greenville
D Fayetteville
D Asheville
R Oklahoma City
D New York
R Omaha
D Phoenix
R Scottsdale
In Reno
D Kansas City
D Charleston
R Jacksonville
D Tampa
D Orlando
R San Diego
D Des Moines
R Miami
D Denver
D Columbus
D DC
D Detroit
In Las Vegas
D Indianapolis
D Chicago
In San Antonio
D Tucson
D Oakland
D Chattanooga
D St Louis
D Raleigh
D Grand Rapids
D Bemidji
D Dayton
D Louisville
D Cincinnati
D Pittsburgh
D Atlantic City
D Birmingham
D West Palm Beach
D Ft Lauderdale
R Murfreesboro
D Green Bay
Mayor stats
D - 46 cities - 79.31%
R - 09 cities - 15.51%
In - 03 cities - 05.18%
Then I got these cities from
https://ballotpedia.org/List_of_current_mayors_of_the_top_100_cities_in_the_United_States#Who_runs_the_cities.3F
When I removed the cities above from those not in the list of top 100 cities I got:
D Minneapolis
D Atlanta
D Nashville
D Los Angeles
D Philadelphia
D San Jose
D Cleveland
D Milwaukee
D Madison
D Portland
R Colorado Springs
D Dallas
D Seattle
D Austin
D Houston
R Oklahoma City
D New York
R Omaha
D Phoenix
R Scottsdale
In Reno
D Kansas City
D Charleston
R Jacksonville
D Tampa
D Orlando
R San Diego
D Des Moines
R Miami
D Denver
D Columbus
D DC
D Detroit
In Las Vegas
D Indianapolis
D Chicago
In San Antonio
D Tucson
D Oakland
D St Louis
D Raleigh
D Louisville
D Cincinnati
D Pittsburgh
D Birmingham
Congratulations @leprechaun! You have completed the following achievement on the Hive blockchain and have been rewarded with new badge(s) :
You can view your badges on your board And compare to others on the Ranking
If you no longer want to receive notifications, reply to this comment with the word
STOPSupport the HiveBuzz project. Vote for our proposal!